
Paper:
Behavior Verification of a Smartphone-Based Fall Risk Alert System and Visually Impaired Users on a Station Platform
Daigo Katayama*1,*2
 , Kazuo Ishii*1,*3, Shinsuke Yasukawa*1,*3
, Yuya Nishida*1,*3, Satoshi Nakadomari*4
, Koichi Wada*4, Akane Befu*4, Chikako Yamada*4, and Atsushi Harata*4
, Kazuo Ishii*1,*3, Shinsuke Yasukawa*1,*3
, Yuya Nishida*1,*3, Satoshi Nakadomari*4
, Koichi Wada*4, Akane Befu*4, Chikako Yamada*4, and Atsushi Harata*4
*1Center for Social Implementation of Future Robots, Kyushu Institute of Technology
2-4 Hibikino, Wakamatsu-ku, Kitakyushu, Fukuoka 808-0196, Japan
*2Department of Intelligent Robotics, Kobe City College of Technology
8-3 Gakuen-higashimachi, Nishi-ku, Kobe, Hyogo 651-2194, Japan
*3Department of Life Science and Systems Engineering, Kyushu Institute of Technology
2-4 Hibikino, Wakamatsu-ku, Kitakyushu, Fukuoka 808-0196, Japan
*4NEXT VISION Public Interest Incorporated Association
Kobe Eye Center 2F, 2-1-8 Minatojima-minamimachi, Chuo-ku, Kobe, Hyogo 650-0047, Japan

We have been working on a system that alerts visually impaired people who get closer to fall risk areas, such as platform edges and stairs, in their walking direction to reduce accidental falls. This system, known as electronic travel aid (ETA), is usually attached to a white cane and assists the user to avoid collisions and falling down. Utilizing recent advancements in information technology, we have introduced a smartphone as an ETA. The proposed fall risk alert system detects fall risk areas in the walking direction of the user based on a depth image obtained by a smartphone. The system calculates the fall risk based on the shortest distance to the edge of a platform and generates an alert as vibration from the smartphone or smartwatch. We conduct verification experiments using the smartphone-based fall risk alert system on a train platform in collaboration with visually impaired persons, who walk according to scenarios expected in daily life. The experimental results demonstrate that the system generates fall risk alerts on station platforms. Based on the walking paths and questionnaire answers, the proposed system is considered to provide similar information with tactile paving.
Behavioral verification of an alert system
1. Introduction
Public transportation such as trains and buses is essential for visually impaired people to move alone. However, accidents caused by the inability to use visual information, such as falls from a station platform, occur when visually impaired people use public transportation. This problem is a serious barrier for the visually impaired. According to a report by the Ministry of Land, Infrastructure, Transport and Tourism in Japan, the number of the fall accidents in FY2023 was 49 cases a. The number of accidents has been decreasing annually. One factor is the improvement of station environments, such as the installation of a platform screen door on the station platform. However, as accidents still occur, measures from a different approach have been needed.
The main purpose of this study is to reduce the number of accidents involving falls from a station platform by improving the safety confirmation method used by visually impaired people. This study focused on assistive devices known as electronic travel aids (ETAs). ETAs are devices that recognize the environmental conditions around a user and transmit information in nonvisual forms such as voice and vibration. Han et al. proposed a sensor capable of detecting both visible and infrared light using a single element, intended for application in guide dog robots 1. Hosoda et al. investigated the role of head rotation during ambulation and developed a method for indicating walking direction using wearable devices 2. In addition to research on ETAs, efforts have been devoted toward the development of other assistive technologies for individuals with disabilities. Yasumoto and Ikeda introduced a navigation system for electric wheelchairs that considered the movement of nearby pedestrians, thereby reducing the likelihood of collisions 3. This study proposes a system designed to alert visually impaired individuals to potential fall risk areas along their walking paths, such as platform edges and staircases. The overarching objective was to prevent accidental falls from station platforms. Asakawa and Saeki proposed and verified a system that uses a laser range finder for step detection and automatic braking to prevent wheelchairs from tipping over 4. Although the ETA and approaches differ, studies on fall detection have also been conducted. Kong et al. proposed a system that detects falls by measuring the transition times between the postures of elderly individuals, and verified its effectiveness 5. We developed an ETA system utilizing smartphone-based technology and performed evaluations in environments simulating station platforms, as illustrated in Fig. 1 6,7.
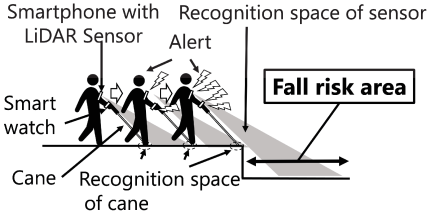
Fig. 1. Concept of a fall risk alert system (based on 6,7).
In this study, we examine the effectiveness of the system in an actual station setting and present the results of its environmental recognition and information transmission capabilities. This study also incorporates findings previously presented at academic conferences related to the verification experiments 8,9.
2. Related Works
Recent studies explored the integration of smartphones with assistive technologies to enable more advanced information processing capabilities. Owing to significant improvements in central processing unit performance and the functionality of embedded sensors, smartphones are now capable of performing sophisticated processing tasks independently. Furthermore, built-in wireless communication technologies, such as Wi-Fi and Bluetooth, facilitate seamless connectivity with external devices. Vijetha and Geetha proposed an obstacle alert system that operates solely on smartphones by combining artificial intelligence-based depth estimation and semantic segmentation techniques 10. Paratore and Leporini introduced a method for generating digital tactile maps to support spatial cognition in visually impaired users by integrating voice and vibration feedback from smartphones with global positioning system-based mapping applications 11. Raina et al. investigated whether visually impaired users could accurately perceive directions when spatial audio cues were provided using a smartphone application 12. Simultaneously, research and development efforts have focused on applications tailored to visually impaired users alongside ongoing improvements in smartphone accessibility features, such as screen readers. For instance, Zhang et al. proposed design methodologies for graphical user interfaces (GUIs) optimized for ease of use by visually impaired individuals 13. In addition, research has been conducted on ETAs that utilize head-mounted displays as alternatives to smartphones. Song et al. developed an independent indoor navigation system for visually impaired users using real-time simultaneous localization and mapping, voice-based navigation support, and remote guidance enabled by livestreaming videos from the surrounding of the user 14.
Moreover, ETAs, such as those described above, have been validated in real-world environments, reflecting their intended use. Kaniwa et al. conducted a verification experiment in an actual shopping mall for a navigation system that facilitates exploratory movement by leveraging a large-scale language model 15. Jeong et al. conducted validation experiments on a deep learning-based object recognition and alert system implemented on smartphones and augmented reality glasses using a route that included real crosswalks and bus stops 16. Cai et al. evaluated guidance methods using guide dog robots in expected application settings, such as corridors, canteens, and gardens 17. Wang et al. performed field trials in a museum to assess the effectiveness of two guidance modalities, voice output and spatial audio, within a smartphone-based guide application. Kuribayashi et al. conducted experiments in both a museum and shopping mall to evaluate a suitable case-type guidance robot that does not rely on a pre-existing map and incorporates a multimodal large-scale language model for environmental description 18. Pundlik et al. performed field evaluations in both urban and suburban settings to test the effectiveness of a navigation system designed to provide precise guidance to bus stops 19.
In addition to ETAs, other assistive devices have also been validated in practical settings. Iwamatsu and Nihei performed cognitive and behavioral analyses of experienced electric wheelchair users in real-world environments based on their regular routes 20. Doi et al. tested a step-climbing device designed for independent use on outdoor stairs by wheelchair users 21. Xu et al. proposed a wearable walking-assistance system to improve the physical activity of the elderly. The system allows users to adjust the control parameters on a smartphone according to their walking style 22.
These studies have verified a wide range of assistive technologies, which have undergone verification in diverse real-world contexts. However, relatively few evaluations have been performed in environments that present significant fall risks such as train station platforms, largely because of safety concerns for participants.
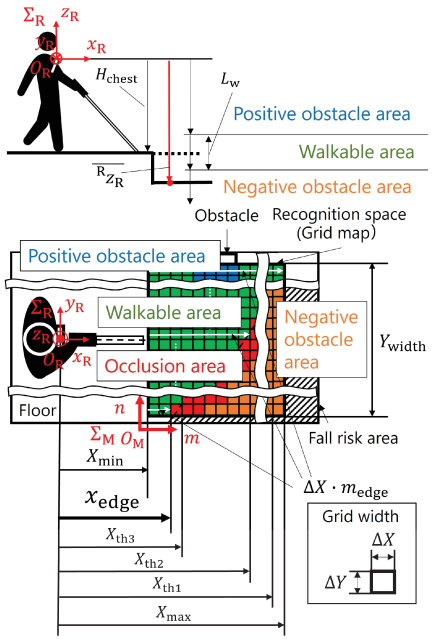
Fig. 2. Parameters and labels for a system 6,7.
3. Method
3.1. Fall Risk Alert System 6,7
This system is designed to run on a smartphone equipped with a light detection and ranging (LiDAR) sensor or a similar technology that generates depth images. The smartphone was attached to the user’s chest, and the recognition space included the ground. The system received several inputs, including depth images obtained from the LiDAR sensor of the smartphone, camera intrinsics, and three-dimensional (3D) poses. The system generates a 3D point cloud from a depth image and camera intrinsics 23. The generated point cloud is then corrected using the smartphone pose. The point cloud is positioned in a coordinate system, \(\Sigma_{\mathrm{R}}\), such that the height direction is aligned with the gravity direction. A grid map, as shown in Fig. 2, is created by this system using the height values \({}^{\mathrm{R}} z_{\mathrm{R}}\) of this point cloud and the threshold values \(H_{\textrm{chest}}\) and \(L_{\mathrm{w}}\). \({}^{\mathrm{R}}z_{\mathrm{R}}\) represents the height of a point from the ground to the smartphone along the \(\Sigma_{\mathrm{R}}\) coordinate. In addition, the system was designed to alert users while walking. Because the position of the smartphone may change during this activity, the range \(L_{\mathrm{w}}\) is set to reduce misrecognition. Each cell in the grid map has a label classified based on Eq. \(\eqref{eq:1}\), which uses the number of points within a cell, \(n_p\), and the average height within the cell, \(\overline{{}^{\textrm{R}}z_{\textrm{R}}}\). This label includes four types: walkable area \(A_1\), positive obstacle area \(A_2\), negative obstacle area \(A_3\), and occlusion area \(A_4\). These labels are relabeled according to the surrounding state of each cell or the slope angle of the ground set in advance 7. The user then sets the slope angle to an acceptable level. In the fall risk estimation described below, negative obstacle area \(A_3\) and occlusion area \(A_4\) are defined as fall risk areas.
The system estimates the fall risk in the walking direction of a user based on the shortest distance \(x_{\mathrm{edge}}\) to the fall risk area and the percentage of the fall risk area on the grid map. \(x_{\textrm{edge}}\) and \(s_{\textrm{risk}}\) were calculated from the generated grid map using Eqs. \(\eqref{eq:1}\) and \(\eqref{eq:2}\), respectively. \(\Delta X\) denotes the grid width in the \(x\)-axis, and \(m_{\textrm{edge}}\) denotes the column index (\(m\)-axis on \(\Sigma_{\mathrm{M}}\)), where the label changes from \(A_1\) to the risk area (\(A_3\) or \(A_4\)). Additionally, \(n_{\textrm{risk}}\) denotes the number of cells with labels \(A_3\) or \(A_4\), and \(N_{\textrm{grid}}\) denotes the total number of cells in the grid map.
The estimated fall risk \(\textit{FR}\) is calculated using Eq. \(\eqref{eq:4}\). \(X_{\min}\) and \(X_{\max}\) denote the lower and upper limits of the grid map, respectively. \(X_{\textrm{th}1}\), \(X_{\textrm{th}2}\), and \(X_{\textrm{th}3}\) (\(X_{\textrm{th}1}>X_{\textrm{th}2}>X_{\textrm{th}3}\)) are the thresholds for \(x_{\textrm{edge}}\), and \(S_{\textrm{th}}\) is the threshold for \(s_{\textrm{risk}}\).
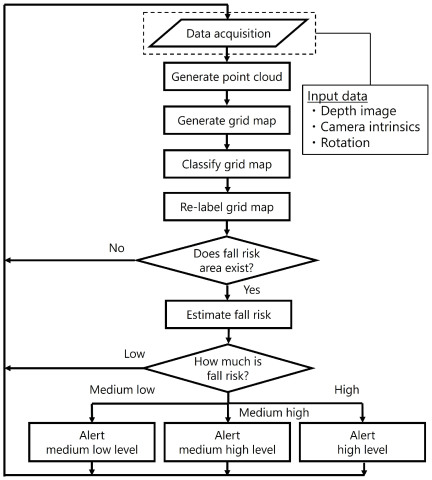
Fig. 3. Flowchart of the system 7.
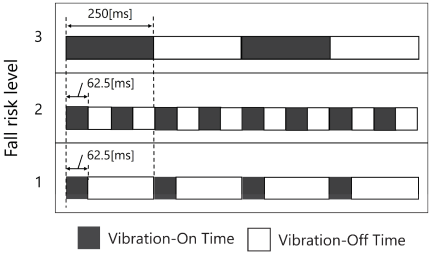
Fig. 4. Vibration pattern 7.
A flowchart of the system is shown in Fig. 3. The system alerts the user only when the estimated fall risk is \(\textit{FR}=1\), 2, or 3 in the walking direction of the user. The system sends alerts via smartphone vibrations. The system can also send alerts via wearable device vibrations that can communicate with a smartphone via Bluetooth. The vibration pattern conveys the changes in the risk level by changing the vibration rhythm according to the estimated risk level, as shown in Fig. 4. The rhythm was set according to haptic icons with rhythm 24. The system is not alert if the risk has the lowest \(\textit{FR}=0\), which allows users to determine the presence or absence of a fall risk based on the presence or absence of vibrations. Users can confirm the detailed conditions of the walking direction if they recognize the vibration rhythm. Additionally, the extra alert level is set to “\(-1\)” for the system, which generates the same alert as \(\textit{FR}= 3\) when the system cannot estimate the risk level. This occurs when the LiDAR sensor on the smartphone does not face the road surface, as determined by the pose of the smartphone.
3.2. Experiment on Station Platform
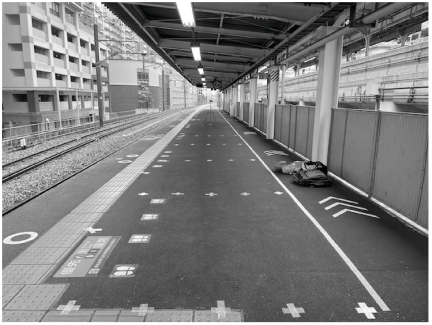
Fig. 5. Experiment site (JR-West Hyogo Station) 8.
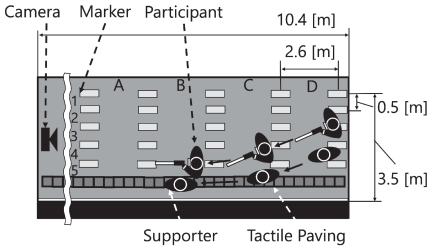
Fig. 6. Overview of experiment site 8.
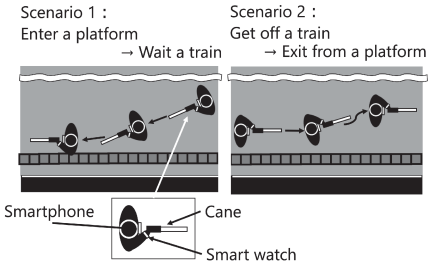
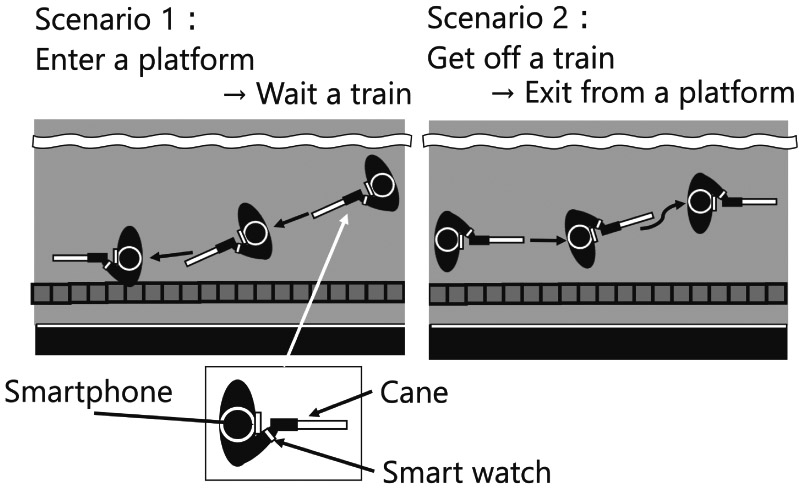
Fig. 7. Scenarios of experiment (based on 8).
We conducted experiments using an actual station platform to verify the effectiveness of the proposed system in an actual environment. The verification date was March 23, 2023, and the site was the Hyogo Station platform on the JR-West Wadamisaki Line, as shown in Fig. 5. This experiment was approved by the Institutional Review Board of the Kobe City Medical Center General Hospital. The 10.4 m \(\times\) 3.5 m experimental site on the station platform is shown in Fig. 6. Markers were placed at certain intervals on the ground using tape to identify the positions of the participants during the experiment. The camera was placed at the edge of each experimental site. The camera recorded the participants’ behaviors during the experiment. The participants in this experiment were two right-handed visually impaired individuals (ID 1: a female in her 50s and ID 2: a male in his 70s) who walked alone with a cane on a daily basis and who had no tactile abnormalities or diabetes mellitus. The experiment involved having a participant perform walking-related tasks on a station platform within the experiment site while recording the behavior of the participant and the system. The participants walked through the experimental site according to the two scenarios shown in Fig. 7. In a situation using the system described below, participants paused when they first felt an alert from the system. After pausing, they checked their surroundings and resumed walking. We explained the scenarios and target points described above to the participants before conducting the experiment. For safety reasons, participants wore helmets. During the experiment, a supporter remained on the participant’s side to monitor and prevent them from encountering dangerous situations, such as stepping over the tactile paving. The experimental conditions were combinations of the aforementioned scenarios (two conditions) and the aid usage patterns. The types of aids used were: a cane only (without the system), smartphone \(+\) cane, and smartwatch \(+\) smartphone \(+\) cane. The system alerts are transmitted as vibrations from both smartphones and smartwatches. The smartwatch receives the estimated risk \(\textit{FR}\) as a UTF-8-encoded string via Bluetooth low energy (BLE) from the smartphone. The estimated risk-transmission interval was 0.1 s. The smartwatch then adjusts its vibration pattern based on the string. We used an Apple Watch as the smartwatch. Because the Apple Watch can only generate vibration patterns specific to its operating system, we configured it to produce vibration patterns similar to those corresponding to each level of the estimated risk. We set “start” for \(\textit{FR}=1\), “directionUp” for \(\textit{FR}=2\), and “failure” for \(\textit{FR}=3\) using the vibration patterns from the WatchKit library for Apple Watch b. Three trials were performed for each combination. The recorded data included the estimated shortest distance, fall risk area, and fall risk. Data were recorded as CSV files on a smartphone. The parameters for fall risk estimation in an experiment are \(Y_{\textrm{width}}=1.00\) m, \(\Delta X=\Delta Y=0.05\) m, \(L_{\mathrm{w}}=0.10\) m, \(X_{\max}=3.50\) m, \(X_{\textrm{th1}}=3.00\) m, \(X_{\text{th2}}=2.00\) m, \(X_{\textrm{th3}}=X_{\min}=1.50\) m, and \(S_{\textrm{th}}=0.75\). \(H_{\textrm{chest}}\) is adjusted according to participants, with Participant ID 1 set to 1.22 m and Participant ID 2 set to 1.31 m.
A questionnaire was administered to each participant after the experiment. Each participant was asked whether they had stopped based on an alert using a yes/no question to evaluate the effectiveness of the system alerts. We asked each participant to rate their psychological stress on a five-point scale (higher scores indicated lower psychological stress), both when receiving an alert from the system and during the entire task to assess psychological stress during system use. Finally, we administered a system usability scale (SUS) questionnaire to evaluate the system as a welfare device 25. This experiment used the Japanese translation of the SUS c as the questionnaire.
4. Results
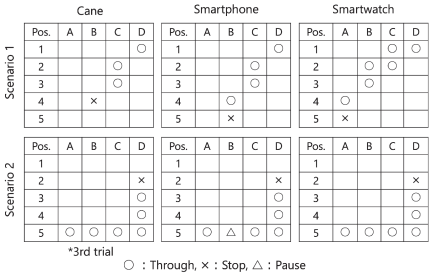
Fig. 8. Walking path of Participant ID 1 (1st trial) 8,9.
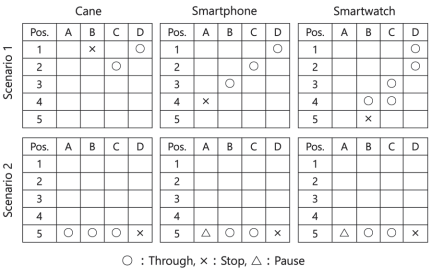
Fig. 9. Walking path of Participant ID 2 (1st trial).
Figures 8 and 9 show the walking paths of the participants under each condition during the first trial. Also, Participant ID 1’s result for a cane-only trial is from the third trial due to errors in the scenario instructions for the first and second trials. The columns and rows in the table indicate the positions in Fig. 5. In most cases, it was confirmed that the participants walked along the same route. In Scenario 1, the participants entered at a shallow angle to the platform edge and stopped when the tip of the cane touched the tactile paving. In Scenario 2, the participants walked along the tactile paving and exited along the edge of the course.
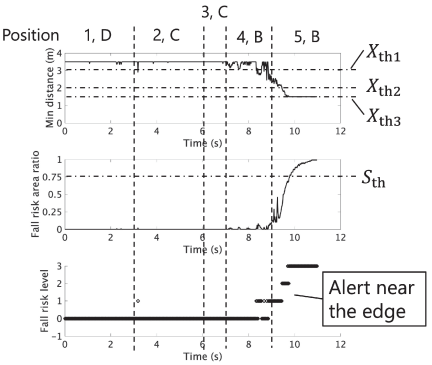
Fig. 10. Results of estimated fall risk (based on 9, ID 1, Scenario 1, smartphone, 1st trial).
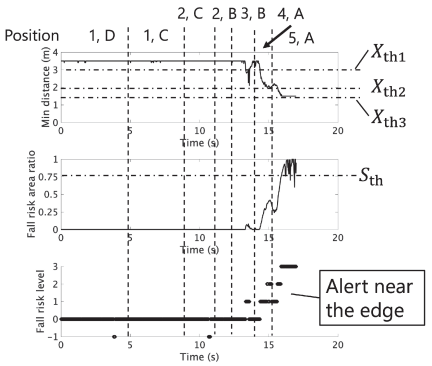
Fig. 11. Results of estimated fall risk (ID 1, Scenario 1, smartwatch, 1st trial).
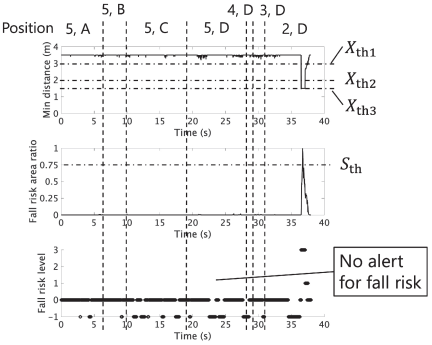
Fig. 12. Results of estimated fall risk (based on 9, ID 1, Scenario 2, smartphone, 1st trial).
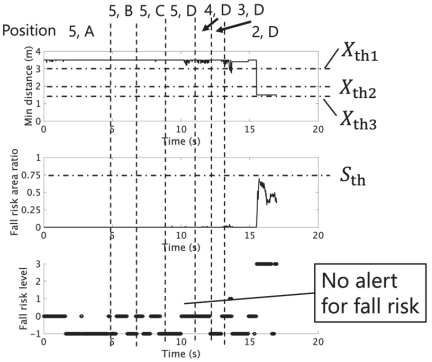
Fig. 13. Results of estimated fall risk (ID 1, Scenario 2, smartwatch, 1st trial).
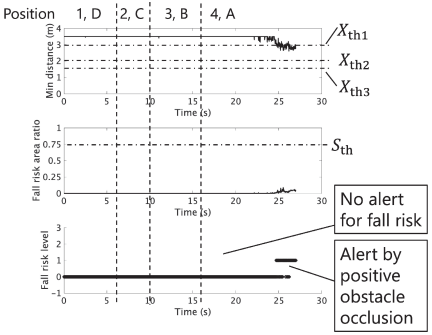
Fig. 14. Results of estimated fall risk (ID 2, Scenario 1, smartphone, 1st trial).
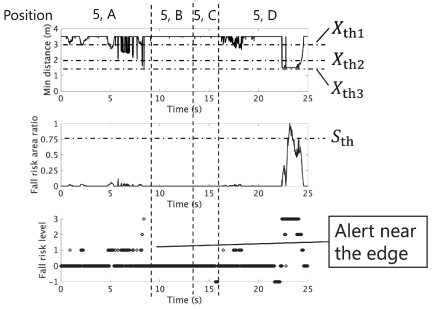
Fig. 15. Results of estimated fall risk (ID 2, Scenario 2, smartphone, 1st trial).
Figures 10 and 11 show the estimated shortest distance, fall risk area, and estimated fall risk for Participant ID 1 during the experiment in Scenario 1. The main trend in the increase in the estimated risk was a decrease in the shortest distance. In addition, no sudden changes in the shortest distance or fall risk area occurred, and no alerts were generated prior to the participant reaching the position (4, B). Figs. 12 and 13 show the estimated results for Participant ID 1 during the experiment in Scenario 2. In this scenario, no alerts were generated until the final part of the task. Figs. 14 and 15 present the estimated results for Participant ID 2 during the experiment. In both Scenarios 1 and 2, the fall risk level rarely increased above 2, and alerts were generated only when the participants paused or finally stopped, as shown in Fig. 9. Figs. 8–15 present the results of the first trial. However, the results of the second and third trials exhibited similar trends. Tables 1 and 2 present the results of the questionnaire. Regarding whether the system alert generated the task to stop, most answered “Yes” when participants received an alert from a smartphone while most answered “No” when participants received an alert from a smartwatch. Regarding psychological readiness when receiving a system alert, Participant ID 1 answered that the smartwatch alert allowed participants to respond with psychological readiness, whereas Participant ID 2 answered that both methods allowed participants to respond with the same degree of readiness. Regarding psychological stress during the task, Participant ID 1 answered that stress was slightly reduced when using a smartwatch, whereas Participant ID 2 answered no change. Regarding the SUS scores, Participant ID 1 obtained higher scores when using a smartwatch, whereas Participant ID 2 obtained the same scores under both conditions.
Table 1. Answers of Participant ID 1 (based on 8).
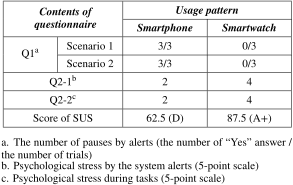
Table 2. Answers of Participant ID 2 (based on 8).
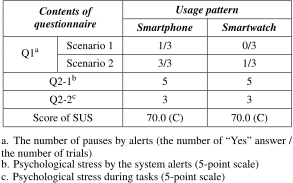
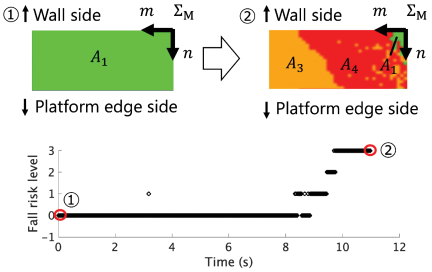
Fig. 16. Result with grid map of GUI (ID 1, Scenario 1, smartphone, 1st trial).
5. Discussion
5.1. System Behavior on Station Platform
The trends of the system behavior during the experiment were as follows: in Scenario 1, alerts were generated when the participants approached the tactile paving. The fact that system alerts were generated almost simultaneously with the contact with the tactile paving indicates that this system can provide alerts equivalent to those provided by tactile paving on actual station platforms, and when the system is used by visually impaired people. This is also evident from the fact that the area near the platform edge can be labeled correctly in the grid map displayed on the GUI of the application, as shown in Fig. 16. In Scenario 2, the fall risk increased to \(\textit{FR}=1\) only for Participant ID 2. As both participants walked along the tactile paving in the actual walking path, we assumed that an alert was generated only when the participant was walking toward the edge of the platform, as shown in Fig. 17. Therefore, even in situations close to the edge of the platform, the system does not generate an alert unless the walking direction is toward the fall risk area. This is evident from the fact that the grid maps at the start of the tasks are labeled \(A_1\) as shown in Figs. 16 and 17.
We believe that the proposed system can prevent unnecessary alerts.
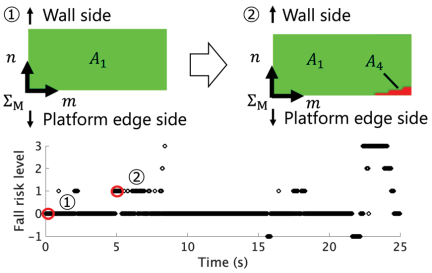
Fig. 17. Result with grid map of GUI (ID 2, Scenario 2, smartphone, 1st trial).
5.2. Participant Behavior on Station Platform
We observed no clear differences in the walking paths of participants using the system. Because the fall risk estimation is based on the shortest distance in the walking direction, in situations where the participant enters the platform edge at a shallow angle, the system does not generate alerts until approaching the tactile paving. In addition, most questionnaire answers indicated that the participants were unable to stop using an alert from the smartwatch system. We believe that the alert was generated after the cane touched the tactile paving, owing to communication delays. As a countermeasure, the shortest distance threshold can be changed to a longer distance from an alert. However, this method may also cause unnecessary alerts; therefore, care should be taken in the threshold settings. Regarding system usage patterns, according to the questionnaire, the participants answered that they could stop using smartphone alerts. However, they answered that an alert from a smartwatch caused lower psychological stress than an alert from a smartphone alone. This is likely because the smartwatch is constantly in contact with the participant’s skin, generating alerts that are more noticeable than when using a smartphone alone. The inability to stop the smartwatch based on alerts is likely due to communication delays, as previously mentioned. However, the distance between smartphones and smartwatches is small. According to Doe et al., the BLE latency was approximately 5 ms under these conditions 26. Therefore, timing differences due to transmission intervals or other system timing flows may be the cause, instead of poor communication quality. Therefore, addressing these issues is necessary. In actual use, low psychological stress is important when a user uses the system; therefore, we believe that the timing of alerts needs to be adjusted to account for communication delays.
5.3. Effective Situation of Fall Risk Alert System
We confirmed a decrease in the shortest distance and an increase in fall risk near the edge of the platform. Therefore, we consider that an alert similar to tactile paving can provide the same level of alerts on platforms in the same situation as at the experimental site. In addition, because we instructed the participants to perform tasks as similar as possible to their daily activities, we considered that the results of this experiment could be applied to actual use on quiet station platforms.
5.4. Limitation of the Experiment
As a limitation of this experiment, because we conducted it without a human presence, the effects of crowded conditions such as crowds of people could not be considered. In terms of its impact on the system, the sensor recognition space may be obstructed, and countermeasures should be considered to address this issue. In terms of the impact on participants, psychological stress may increase and attention to alerts from the system may weaken owing to the increased presence of elements requiring attention, such as crowds and voices. Because the experiment did not consider situations where trains were stopped, the effect of stopped trains on the estimated results may be uncertain for the system. Participants may also be affected by passenger movement before and after train stops, including station announcements regarding train stops.
5.5. Requirements for Implementation
Based on the above discussion, we consider that the following specific measures are necessary for the practical application of this system: consideration of the timing of the vibration presentation considering communication delays and user perception, countermeasures against crowd occlusion during peak hours, and countermeasures for situations near doors during train stops. We also consider it necessary to explore methods for visually impaired individuals to initiate and terminate the system independently, with the goal of developing a system that can be used by visually impaired individuals without assistance. About the usage pattern of the system, Wong et al. indicated that assistive systems should not provide constant assistance to the visually impaired 27. Not limited to assistive systems, constant support has been indicated as potentially leading to infantilization and self-stigmatization among the visually impaired, as well as loss of independence 28. Therefore, the system should provide alerts in a manner that respects the will of visually impaired users. For instance, when the system detects that a user is approaching a station using the location information of the smartphone, it prompts the user to activate the system. Additionally, we consider that, similar to the use of a cane, users require training for the system to be widely adopted. Tan et al. verified training methods for the visually impaired on the use of smartphone applications and concluded that the optimal content is an individualized approach, graded or scaffolded training, and instructors who are also visually impaired 29. As shown in this example, we should consider it essential to develop training programs during the system implementation phase by incorporating feedback from visually impaired people.
6. Conclusion
In this study, we conducted verification experiments using a smartphone-based fall risk alert system in an actual environment, specifically a train platform, with visually impaired participants. The experimental results demonstrated that the system could estimate fall risks on station platforms based on the estimated fall risk results. In addition, the alerts generated by the system were equivalent to those provided by tactile paving, as evidenced by the participants’ walking paths and questionnaire answers; the system did not generate unnecessary alerts.
Future tasks include examining the timing of vibration presentation by considering delays caused by communication and user perception, measures to address crowd occlusion during crowded conditions, and measures to address conditions near train doors when a train stops. In addition to these measures, for more specific situations, we performed verifications in other environments with a larger number of participants. From the perspective of system spread, we considered the development of a training program for introducing the system.
Acknowledgments
This study was supported by a research grant from the JR-West Relief Foundation, 2022 (Grant No.22R034). We would like to thank Editage (www.editage.jp) for English language editing.
- [1] Z. Han et al., “Simulating the obstacle avoidance behavior day and night based on the visible-infrared MoS2/Ge heterojunction field-effect phototransistor,” Nano Res., Vol.16, No.8, pp. 11296-11302, 2023. https://doi.org/10.1007/s12274-023-5816-6
- [2] M. Hosoda, W. Yoshida, and S. Kajikawa, “Analysis on gait trajectory influenced by forced head rotation,” Proc. of the 2024 JSME Conf. on Robotics and Mechatronics, 1A1-Q06, 2024 (in Japanese). https://doi.org/10.1299/jsmermd.2024.1A1-Q06
- [3] R. Yasumoto and T. Ikeda, “Predictive information presentation for aligning human and system intentions in cooperative wheelchair navigation,” Proc. of the 2024 JSME Conf. on Robotics and Mechatronics, 2P2-D03, 2024 (in Japanese). https://doi.org/10.1299/jsmermd.2024.2P2-D03
- [4] T. Asakawa and H. Saeki, “Risk factor attitude survey and step of road detection method about wheelchair of elderly person,” J. Robot. Mechatron., Vol.35, No.1, pp. 171-179, 2023. https://doi.org/10.20965/jrm.2023.p0171
- [5] X. Kong et al., “Three-states-transition method for fall detection algorithm using depth image,” J. Robot. Mechatron., Vol.31, No.1, pp. 88-94, 2019. https://doi.org/10.20965/jrm.2019.p0088
- [6] D. Katayama et al., “Fall risk estimation for visually impaired using iPhone with LiDAR,” J. of Robotics, Networking and Artificial Life, Vol.9, No.4, pp. 349-357, 2023. https://doi.org/10.57417/jrnal.9.4_349
- [7] D. Katayama et al., “Grid map correction for fall risk alert system using smartphone,” J. Robot. Mechatron., Vol.35, No.3, pp. 867-878, 2023. https://doi.org/10.20965/jrm.2023.p0867
- [8] D. Katayama et al., “Verification of the walking behavior of visually impaired when they use a travel aid application that alerts fall risk,” Proc. of the 31th Conf. on Rehabilitation of the Visually Impaired, O2-1, 2023 (in Japanese).
- [9] D. Katayama et al., “Demonstration experiment on a station platform of a fall risk alert system for visually impaired using a smartphone,” Proc. of the 2024 JSME Conf. on Robotics and Mechatronics, 1P2-E10, 2024 (in Japanese). https://doi.org/10.1299/jsmermd.2024.1P2-E10
- [10] U. Vijetha and V. Geetha, “Obs-tackle: An obstacle detection system to assist navigation of visually impaired using smartphones,” Mach. Vis. Appl., Vol.35, No.2, Article No.20, 2024. https://doi.org/10.1007/s00138-023-01499-8
- [11] M. T. Paratore and B. Leporini, “Exploiting the haptic and audio channels to improve orientation and mobility apps for the visually impaired,” Univers. Access Inf. Soc., Vol.23, No.2, pp. 1-11, 2023. https://doi.org/10.1007/s10209-023-00973-4
- [12] A. S. Raina, R. R. Mohanty, A. Bhuvanesh, D. Prabha, M. Swaminathan, and V. R. Krishnamurthy, “Pointing tasks using spatial audio on smartphones for people with vision impairments,” J. Comput. Inf. Sci. Eng., Vol.24, No.2, Article No.021011, 2024. https://doi.org/10.1115/1.4062426
- [13] M. Zhang, H. Liu, Y. Zhou, C. Chen, P. Huang, and J. Zhao, “Don’t confuse! Redrawing GUI navigation flow in mobile apps for visually impaired users,” IEEE Trans. on Software Engineering, Vol.50, No.12, pp. 3351-3368, 2024. https://doi.org/10.1109/TSE.2024.3485225
- [14] J. Song et al., “Mixture reality-based assistive system for visually impaired people,” Displays, Vol.78, Article No.102449, 2023. https://doi.org/10.1016/j.displa.2023.102449
- [15] Y. Kaniwa et al., “ChitChatGuide: Conversational interaction using large language models for assisting people with visual impairments to explore a shopping mall,” Proc. ACM Hum. Comput. Interact., Vol.8, No.MHCI, Article No.247, 2024. https://doi.org/10.1145/3676492
- [16] I.-J. Jeong, K. Kim, J. Jung, and J. Cho, “YOLOv8-based XR smart glasses mobility assistive system for aiding outdoor walking of visually impaired individuals in South Korea,” Electronics, Vol.14, No.3, Article No.425, 2025. https://doi.org/10.3390/electronics14030425
- [17] S. Cai et al., “Navigating real-world challenges: A quadruped robot guiding system for visually impaired people in diverse environments,” Proc. of the CHI Conf. on Human Factors in Computing Systems, Article No.44, 2024. https://doi.org/10.1145/3613904.3642227
- [18] M. Kuribayashi, K. Uehara, A. Wang, S. Morishima, and C. Asakawa, “WanderGuide: Indoor Map-less Robotic Guide for Exploration by Blind People,” Proc. of the 2025 CHI Conf. on Hum. Factors in Computing Systems, Article No.676, 2025. https://doi.org/10.1145/3706598.3713788
- [19] S. Pundlik, P. Shivshanker, T. Traut-Savino, and G. Luo, “Field evaluation of a mobile app for assisting blind and visually impaired travelers to find bus stops,” Transl. Vis. Sci. Technol., Vol.13, No.1, 2024. https://doi.org/10.1167/tvst.13.1.11
- [20] K. Iwamatsu and M. Nihei, “Combined analysis of information gathering behavior in skilled powered wheelchair users through gaze and thought processes,” Proc. of the 2024 JSME Conf. on Robotics and Mechatronics, 1P2-F09, 2024 (in Japanese).
- [21] Y. Doi, H. Kunii, K. Morimoto, and Y. Mori, “Stair climbing units with portable ramps for manual wheelchair users,” Proc. of the 2024 JSME Conf. on Robotics and Mechatronics, 1P2-F05, 2024 (in Japanese). https://doi.org/10.1299/jsmermd.2024.1P2-F05
- [22] M.-Y. Xu et al., “Development of an ankle assistive robot with instantly gait-adaptive method,” J. Robot. Mechatron., Vol.35, No.3, pp. 669-683, 2023. https://doi.org/10.20965/jrm.2023.p0669
- [23] Y. Wang, W. Chao, D. Garg, B. Hariharan, M. Campbell, and K. Q. Weinberger, “Pseudo-LiDAR from visual depth estimation: Bridging the gap in 3D object detection for autonomous driving,” Proc. of the IEEE/CVF Conf. on Computer Vision and Pattern Recognition (CVPR), pp. 8445-8453, 2019. https://doi.org/10.1109/CVPR.2019.00864
- [24] D. Ternes and K. E. MacLean, “Designing large sets of haptic icons with rhythm,” Haptics: Perception, Devices and Scenarios, pp. 199-208, 2008. https://doi.org/10.1007/978-3-540-69057-3_24
- [25] J. Brooke et al., “SUS-A quick and dirty usability scale,” Usability Evaluation in Industry, Vol.189, No.194, pp. 4-7, 1996.
- [26] N. Doe, S. Scharoba, M. Reichenbach, and C. Herglotz, “Comparison of Bluetooth low energy (BLE), Wi-fi, serial and 5G in IoMT,” Proc. of the 18th Int. Joint Conf. on Biomedical Engineering Systems and Technologies, pp. 859-866, 2025. https://doi.org/10.5220/0013321500003911
- [27] C. Y. Wong, R. A. Ananto, T. Akiyama, J. P. Nemargut III, and A. Moon, “Perspectives on robotic systems for the visually impaired,” Companion of the 2024 ACM/IEEE Int. Conf. on Human-Robot Interaction, pp. 1134-1138, 2024. https://doi.org/10.1145/3610978.3640698
- [28] M. Agmon, A. Sa’ar, and T. Araten-Bergman, “The person in the disabled body: A perspective on culture and personhood from the margins,” Int. J. Equity Health, Vol.15, No.1, Article No.147, 2016. https://doi.org/10.1186/s12939-016-0437-2
- [29] H. L. Tan, T. Aplin, H. Gullo, and T. McAuliffe, “Training and learning support to use smartphones and apps for people with vision impairment (PVI): A multi-site qualitative study on trainers’ perspectives from Australia, Canada, and Singapore,” Br. J. Vis. Impair., Vol.42, No.3, pp. 754-768, 2024. https://doi.org/10.1177/02646196231183891
- [a] Ministry of Land, Infrastructure, Transport and Tourism in Japan, “Information on safety of railway transportation (fy2023).” https://www.mlit.go.jp/tetudo/content/001973720.pdf [Accessed April 18, 2025]
- [b] Apple Inc., “WKHapticType.” https://developer.apple.com/documentation/watchkit/wkhaptictype [Accessed July 29, 2025]
- [c] S. Yamauchi, “SUS: System Usability Score,” (in Japanese). https://s-yamauchi.w.waseda.jp/ResEthics/SUS/SUS.html [Accessed July 30, 2025]
This article is published under a Creative Commons Attribution-NoDerivatives 4.0 Internationa License.