
Paper:
Shape-Based Extrapolation of Contact Patterns to Support Tactile Regrasping
Kourosh Jolaei
 , Jean-Philippe Roberge
, and Vincent Duchaine
, Jean-Philippe Roberge
, and Vincent Duchaine
École de Technologie Suérieure (ÉTS)
1100 Rue Notre-Dame Ouest, Montreal, Quebec H 1, Canada

A method is proposed to support robotic regrasping by leveraging tactile data to extrapolate unseen contact regions. Initial tactile feedback from multimodal capacitive sensors mounted on robotic fingers was used to classify the object shape into prototypical categories. Based on this classification, shape-specific extrapolation strategies extend the tactile map beyond the initial contact area, providing a computationally efficient estimate of potential contact without requiring complex physical simulations. The extrapolated regions were evaluated against measured contact data collected via a systematic grid-based scan using three metrics: the tactile centroid deviation, defined as the Euclidean distance between the geometric centers of binary contact regions; the grasp success rate estimated by a pretrained grasp assessment network; and the structural similarity index to assess local structural fidelity. Experiments on cuboidal, spherical, and cylindrical objects demonstrated the effectiveness of the approach in predicting unseen contact and identifying safe zones where extrapolated and real contacts align. The results showed reliable performance for small rigid objects, with the shape classifier achieving 94.3% accuracy on a held-out test set. However, a reduced accuracy was observed for larger, highly curved geometries, likely due to the limited curvature resolution of the tactile sensors. Large-diameter cylinders are occasionally misclassified as cuboids. Potential improvements include enlarging the dataset, refining the classifier, and integrating high-resolution sensors to enhance adaptability and precision.
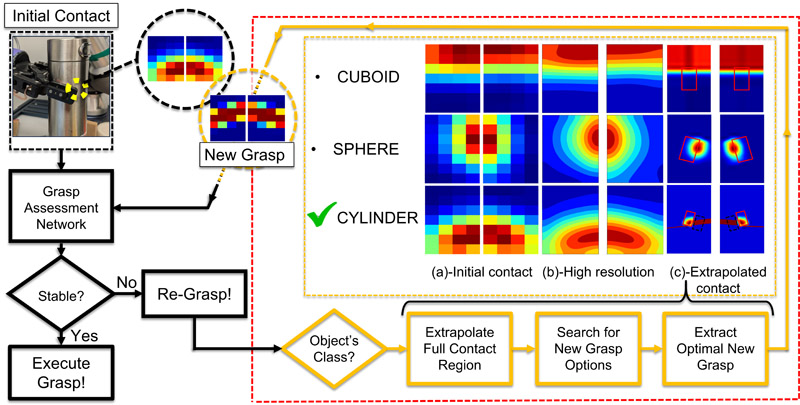
Shape-aware tactile extrapolation
1. Introduction
Robotic manipulators have evolved from performing predefined tasks in controlled settings to operating in dynamic and unstructured environments 1,2.
Robotic grasping research has traditionally focused on model-based techniques that rely on accurate 3D representations of objects, environments, and hands 3. Although these methods can be effective in controlled environments, they often struggle to generalize to real-world scenarios because of their dependence on precise analytical models 4.
Despite these advancements, grasping capabilities remain a fundamental challenge, particularly in real-world environments where objects are often irregular, moving, or present in cluttered scenes. While robots are frequently designed for specific tasks in controlled settings 5, recent advances in robot learning have aimed at enhancing adaptability in unstructured scenarios 6. Robust and adaptive grasping is essential for robotic manipulation. However, identifying a stable and feasible grasp is non-trivial. This challenge is crucial because it underpins the ability of robots to autonomously perform complex tasks in dynamic and unstructured environments 7.
Vision-based approaches, including RGB-D sensors, have advanced robotic grasping 8. However, these systems often suffer from limitations such as occlusions, sensor noise, and difficulty in perceiving detailed contact information, particularly at close range and with transparent or reflective objects 9. In contrast, tactile sensing provides a fine-grained local geometry that is often unobservable through vision alone. Although tactile sensors also present challenges, such as limited spatial coverage and resolution, their ability to detect subtle physical interactions makes them especially valuable for evaluating and refining grasp quality in manipulation tasks 10.
Tactile sensing provides direct contact feedback, allowing real-time evaluation of grasp stability. By capturing physical interactions at contact points, tactile feedback has become essential for assessing grasp quality 11,12. This sensory information is critical for converting physical interactions into controlled robotic actions, such as the regulation of gripping force 13.
Traditionally, grasp stability was assessed using deterministic approaches that analyze force resultants and contact mechanics 14,15. Recently, data-driven models have predicted grasp stability based on tactile observations 16.
Despite advances in tactile sensing for grasp assessment, challenges remain. While current methods excel at evaluating grasp quality, limited guidance is provided for correcting unstable grasps. Although grasp-quality models predict stability, adaptive adjustments during manipulation have not been supported 17. Real-time tactile feedback is essential for correcting misalignments, insufficient force, or slippage; however, these methods may be inadequate when the initial grasp is unstable or when the system has low confidence in the prediction, underscoring the need for more reliable proactive grasp improvement techniques.
This highlights the need for proactive strategies, such as regrasping, which adjusts the grasp strategy in response to low confidence in the initial grasp. Regrasping leverages an assessment method to ensure stability and mitigate the predicted instability, thereby offering a more reliable solution for determining stability 18,19. Previous research has not only focused on assessing the robotic grasp quality but also on improving it by predicting the unobserved contact area based on the current tactile image 20.
By leveraging tactile data from the initial contact with the object, crucial information about the geometry of the object can be extracted to assess grasp stability. This study focuses on extrapolating the contact beyond the immediate contact area of the fingers, thereby enlarging the search space for candidate grasps.
At the CoRo Lab at École de Technologie Suérieure (ÉTS), prior research has advanced grasp assessment methods using tactile feedback, achieving high accuracy through unsupervised learning and CNN-based models. In this study, these methods were employed to assess grasp stability and to validate the extrapolated contact by comparing the tactile data extracted from the extrapolated contact with that of the real contact.
In contrast to approaches that rely on complex physical simulations, this study investigated the efficacy of geometric tactile extrapolation as a computationally efficient alternative. We present a framework in which a neural network (NN) classifies the shape of an object based on its initial tactile imprint. Based on this prediction, a shape-based completion procedure is used to infer the unobserved regions of the tactile map. This approach considers a tactile image as a local surface patch, enabling the identification of candidate grasps without immediate finger motion or full-object reconstruction.
It is important to note that the primary contribution of this work is the validation of this extrapolation signal as a reliable basis for future regrasping strategies, rather than the physical execution of the regrasp itself. This study evaluates the accuracy and reliability of the extrapolated contact using three key performance metrics: (1) the tactile centroid (TC) deviation, which measures the Euclidean distance between the geometric centers of the binary contact regions in the measured and extrapolated tactile maps; (2) the predicted grasp success rate (GSR), representing the statistical likelihood of a stable grasp as defined in 21; and (3) the structural similarity index (SSIM) to assess the local structural fidelity and perceptual consistency between the real and virtual tactile signatures. The focus of this work is to assess the effectiveness of the extrapolation step. Fig. 1 illustrates the high-level concept, in which the initial tactile image is used to infer unseen areas of contact.
This paper is structured as follows: Section 2 reviews the state-of-the-art in tactile regrasping and establishes the context for the proposed framework. Section 3 describes the experimental setup, NN classifier, contact extension method, and evaluation metrics. Section 4 presents the experimental results and discusses their implications. Section 5 provides a summary of the key findings and outlines directions for future research.
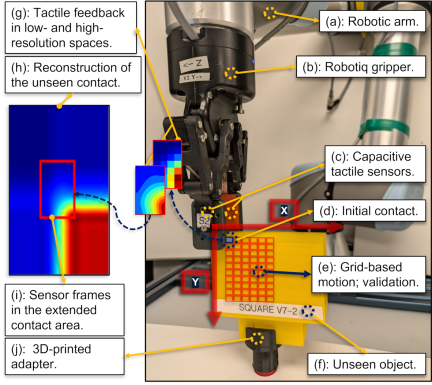
Fig. 1. Overview of the proposed contact extrapolation method. Initial contact between the object and the robot fingers is analyzed by an NN classifier to identify the prototypical shape. Based on this label, unobserved regions of the tactile map are reconstructed, enabling identification of more stable grasp candidates.
2. Contact Extrapolation as a Basis for Regrasping
Vision-based methods can struggle to accurately assess grasp and contact conditions, which are inherently tactile phenomena. Tactile sensing provides real-time information about key contact properties, such as contact location, geometry, and stability 22. Recent advancements have contributed to improving grasp robustness in dynamic and unstructured environments through tactile sensing 23.
Grasp assessment can be performed using either model-based methods or machine-learning techniques. Model-based approaches grounded in grasp theory evaluate stability using parameters such as contact locations, surface normals, and force equilibrium. Wan and Howe 24 developed a method to quantify the impact of tactile sensor spatial resolution on grasp stability, demonstrating that lower-resolution sensors introduce uncertainties in contact locations and surface normals, which, in turn, reduce the reliability of grasp stability predictions.
In contrast, machine-learning methods employ data-driven approaches to predict grasp stability, often enhancing performance through learned patterns and sensor fusion. Cockbum et al. 25 developed an unsupervised learning method that achieved an 83.7% accuracy in detecting grasp failures. Kwiatkowski et al. 26 later refined this approach by integrating exteroception and proprioception into a CNN-based model and achieved an accuracy of 92.7%. Recently, dataset augmentation techniques have further refined GSR estimation 21, highlighting the effectiveness of tactile sensing in predicting grasp stability and emphasizing its potential for intelligent feedback in robotic manipulations.
Similarly, Hyttinen et al. 27 introduced a part-based approach to grasp stability, in which tactile signatures were learned from prototypical object parts. By combining tactile feedback with finger joint data and classifying tactile impressions, their model enhanced grasp stability predictions and facilitated dynamic adjustments during manipulation.
Beyond grasp assessment, the challenge lies in responding to predicted instability. This requires strategies that not only evaluate but also guide the system toward stable grasps. In human-robot collaboration, Tanaka et al. 28 addressed this by using tactile sensors to detect interaction states, such as slipping, to dynamically adjust robotic grasping force.
Regrasping strategies in robotic manipulation often rely on visual and tactile feedback to improve grasp stability and adaptability. Vision-based methods, such as those proposed by Higo et al. 29, utilize visual data to assess and adjust grasp configurations. Kalashnikov et al. 30 enabled grasp adjustments before the final lift through closed-loop vision-based control, thereby facilitating behaviors such as probing and repositioning. By contrast, tactile-based methods are less commonly employed.
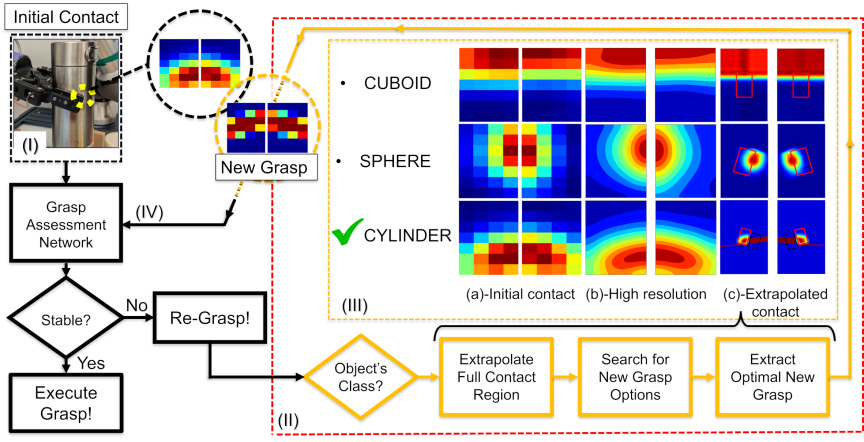
Fig. 2. Overview of the contact extrapolation framework proposed to support regrasping. (I) Initial contact: tactile data are acquired from both fingers. (II) If the grasp is predicted to be unstable, extrapolation is triggered: (a) classifying the object shape from the initial tactile imprint; (b) upsampling the tactile image; (c) extrapolating contact using shape-specific rules. (III) Examples of cuboid, sphere, and cylinder; the green checkmark denotes the predicted class, and the dotted rectangle marks the extrapolated region. (IV) The virtual contact is scored by the grasp-assessment network 21 to quantify the stability of the candidate configuration.
Hogan et al. 20 proposed a regrasp control policy that improves the grasp quality using tactile feedback. A deep CNN trained in a self-supervised manner on more than 2,800 grasps provided a tactile-only grasp-quality metric. For each candidate local regrasp, they synthesized the post-move tactile imprint by applying rigid-body translations to the measured tactile image, filled the newly introduced regions via mirror padding, then scored these synthetic imprints with the learned metric, and executed the highest-ranked action. The procedure assumes that the object pose is unchanged between grasps, and emphasizes the local contact geometry rather than the object’s global shape. The reported results included 85% accuracy for known objects, 75% accuracy for novel objects, and a 70% average relative improvement in grasp success.
In contrast, the present work leverages tactile data as the basis for reconstructing the object geometry and identifying improved grasping positions, thereby providing a perceptual foundation for a shape-aware regrasp strategy. Instead of executing closed-loop regrasps, this study focused on validating the accuracy of the extrapolation mechanism. The framework virtually explores candidate adjustments by extrapolating the contact region and inferring unseen portions based on the object’s geometry. These virtual images were then evaluated using a grasp assessment network 21 to predict stability. By comparing these virtual signatures with real tactile data collected through systematic robot motion, we demonstrated that this extrapolation is sufficiently accurate to serve as a reliable signal for future regrasping controls.
The challenge of extrapolation based on different object geometries lies in accounting for variations in surface curvature. Spheres exhibit an isotropic, constant positive curvature (principal curvatures equal to \(1/R\)). Therefore, the completion of the tactile map can be symmetric around the contact normal. Cylinders have anisotropic curvature, are non-zero in the circumferential direction (approximately \(1/R\)), and are near zero along the axis; therefore, completion should be direction-dependent. Cuboids comprise piecewise planar faces (zero curvature) separated by sharp edges where curvature is concentrated; therefore, tactile-map completion must be edge-aware to avoid introducing fictitious curved contacts near the edges. The extrapolated tactile-map patterns varied across prototypical shapes (see Fig. 2(III)).
Inspired by Hyttinen et al.’s classifier-based grasp-stability predictions 27, a shape-specific extrapolation strategy was introduced based on three prototypical shapes (cuboid, sphere, and cylinder) to enable structured, adaptive refinement. Although originally developed for a different purpose, this method has proven to be highly effective for mapping tactile images to prototypical shapes. Their approach involves reducing the graspable object space to a small set of representative shapes through data-driven clustering. By associating tactile feedback with specific parts of these shapes, their model improved the grasp stability predictions, enabling the robot to classify tactile signatures from different object regions. While applied in a different context, this work laid the foundation for the shape-specific regrasp strategy.
Assuming a continuous contact surface when extending tactile information is a common simplification, but it can fail to capture the complex and discontinuous contours of real-world objects. Instead, the proposed method employs a shape-specific extrapolation strategy, where object classification guides the extrapolation of the contact region. This explicitly differs from generic, shape-agnostic continuity extrapolation. Rather than extending the edges blindly, completion follows curvature-consistent rules tied to the estimated shape (sphere, cylinder, and cuboid). This enables more accurate extensions by aligning the extrapolated contact with the geometry of the object, rather than relying on generic continuity assumptions.
An NN classifier trained on tactile features ensures effective shape recognition and supports geometry-aware extrapolation. The resulting geometry-aware completion provides the basis for a proactive regrasp strategy that responds to the predicted instability by suggesting small, shape-informed adjustments in the grasp configuration.
3. Methodology
This section outlines the methodology for extrapolating unobserved contact regions by combining shape classification with tactile data. Fig. 2 summarizes the overall processing pipeline.
The experimental data were collected using a UR5e robotic arm equipped with a parallel-jaw gripper. Two multimodal capacitive tactile sensors 31, mounted on a Robotiq 2F-85 gripper, were used to capture the tactile images.
Developed and commercialized by the CoRo Lab, these sensors feature a \({7 \times 4}\) taxel array for normal pressure sensing at 60 Hz. Each sensor consists of 28 capacitive elements, an integrated inertial measurement unit with gyroscopes, accelerometers, and a compass for joint angle estimation relative to the palm of the gripper. A transimpedance amplifier captures capacitance variations at 1 kHz with a \({7 \times 4}\) taxel matrix representing static pressure data, whereas capacitance fluctuations and accelerometer readings provide dynamic information.
3.1. Shape Classifier Network
To extrapolate the contact beyond the initial imprint, the shape of the object was first classified from the initial tactile image. This classification, combined with the initial tactile image, formed the foundation for extrapolating the complete contact region.
The cuboid, sphere, and cylinder classes were selected as prototypical shapes representing a broad set of real-world objects 32. These shapes are widely used in robotics and object recognition for contact modeling. This choice supports the generalization of the contact extrapolation by covering a diverse range of contact geometries.
A fully connected NN was developed to classify object shapes based on tactile features, following a previous study 33. The dataset comprised approximately 6,900 samples across three object classes, with each shape 3D-printed in five sizes. The object sizes were selected according to three criteria: (i) compatibility with the gripper stroke so that the object could be enclosed stably; (ii) tactile detectability such that the initial contact produced a contiguous patch on the sensing area; and (iii) for cylinders and, in some cases, cuboids, at least one dimension exceeding the sensor’s active length so that only a portion of the true contact patch was captured. For the cuboids, the dimensions along the gripper closing axis (thickness) were varied from 20 mm to 42 mm to promote a stable enclosure. Spheres had radii from 12.5 mm to 32.5 mm. Cylinders had diameters from 22 mm to 42 mm, and their lengths were set greater than the sensor’s active length.
The tactile data from both sensors were normalized and reshaped into a \({7 \times 8}\) matrix to preserve spatial structure and sensor-specific information. The dataset was divided into three subsets: 80% training, 10% validation (for monitoring and tuning during model development), and 10% strictly held out as the test set (i.e., previously unseen data). This test set was never used during the model development and provided a measure of the generalization ability of the model.
To enhance classification, three feature families were integrated: raw pixel data from the tactile imprints, Hu moments (seven invariants that capture global shape and are invariant to translation, rotation, and scale), and selected central moments (second- and third-order: \(\mu_{20}\), \(\mu_{02}\), \(\mu_{11}\), \(\mu_{03}\), \(\mu_{21}\), and \(\mu_{12}\)), which quantify the dispersion, orientation, and asymmetry of contact intensity about the centroid 34,35. These moment-based features provide geometric/structural descriptors derived from the spatial distribution of the tactile contact, complementing the pixel representation and improving class separability. Together, these features enable more accurate shape classification.
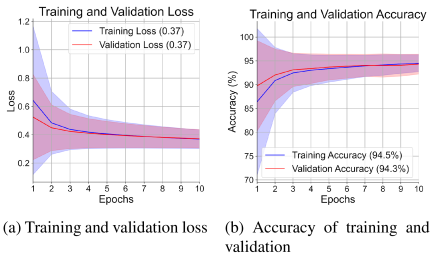
Fig. 3. Learning curves for the shape classifier over 10 epochs: (a) loss and (b) accuracy (mean \(\pm\) standard deviation across folds). The close alignment between training and validation suggests limited overfitting and stable generalization.
The combined feature vector was normalized using MinMaxScaler and input into a feedforward NN comprising three hidden layers. The first layer contained 64 ReLU-activated neurons, followed by two 32-neuron ReLU layers with L2 regularization. A softmax output layer with three neurons corresponds to the shape classes. The model was compiled using the Adam optimizer (learning rate of 0.001) and categorical cross-entropy loss. Training was performed over 10 epochs with a batch size of 32. As shown in Fig. 3, the training and validation curves closely track each other, suggesting limited overfitting, and the final accuracies were 94.5% (training) and 94.3% (validation), with losses of 0.37 and 0.37, respectively.
To evaluate the generalizability of the model to real-world conditions, a separate external dataset was constructed using objects not previously seen in the network. Five novel objects were selected from each shape category. For cuboids, a range of widths was included to assess how edge configurations, especially narrow versus wide configurations, affected tactile imprints. Across all classes, the selected objects differed in size, shape, and surface texture, while maintaining similar rigidity. Each object was grasped at multiple positions and orientations, with the number of grasps determined by the object size and the fixed spatial step size of the robot. The objects included in the external validation are shown in Fig. 4.
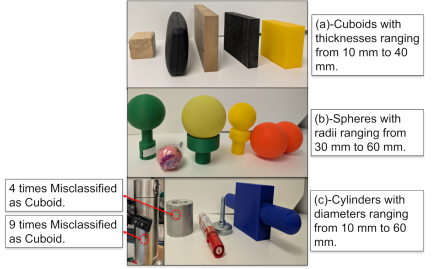
Fig. 4. External validation objects: five unseen examples per class ((a) cuboid, (b) sphere, and (c) cylinder), selected to assess generalization across geometries.
The confusion matrices for the held-out test set and external real-world object set are shown in Fig. 5. The held-out test set (Fig. 5(a)) achieved 94.3% accuracy, whereas the external dataset (Fig. 5(b)) yielded an accuracy of 80.8%.
A notable source of misclassification is the coffee container (Fig. 4(c)), which is frequently identified as a cuboid. Its large diameter creates a locally flat tactile imprint, reducing the shape discriminability. This case accounted for 9 of the 14 misclassifications in the cylinder category.
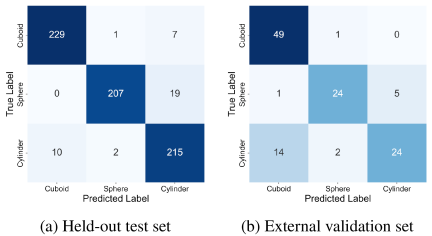
Fig. 5. Confusion matrices for the shape classifier. (a) Held-out test set. (b) External validation with unseen real-world objects.
3.2. Shape-Based Contact Extrapolation
Once the shape of the object has been classified, an extrapolation strategy is applied to extend the contact area based on both the shape category and initial tactile image. The following section outlines contact extrapolation methods tailored to the geometry of each object.
3.2.1. Contact Extrapolation
The original \({7 \times 4}\) taxel matrix was first smoothed using a Gaussian filter to reduce the noise and improve the contact accuracy. The filter was parameterized with standard deviations \(\sigma_{x}\) and \(\sigma_{y}\) controlled smoothing along the \(X\)- and \(Y\)-axes. The Gaussian function is
Next, the sensor matrix was padded on all sides to expand the tactile space with newly added taxel-assigned values based on the contact shape. Bicubic interpolation with an upsampling factor \(r = 10\) was then applied to generate a high-resolution tactile representation. This approach preserved the geometric integrity of different object shapes while ensuring continuity in the extrapolation of the contact area.
While prior research has quantitatively examined how sensor resolution affects grasp-stability prediction 24, in this work bicubic interpolation was applied to enhance the spatial resolution of the tactile signal.
Bicubic interpolation extends the cubic interpolation to two dimensions using a third-degree polynomial to approximate a function based on known values and their derivatives. For example, if the function \(f(x)\) is known at \({x = 0}\) and \({x = 1}\) and if the derivatives of \(f(x)\) are known at these points, the function can be interpolated using a third-degree polynomial within the interval \([0, 1]\).
Before applying any contact extrapolation strategy, the method verifies whether the contact footprint of the object is fully enclosed within the active area of the tactile sensor. If all the contact taxels lie within the sensor boundary without edge overlap, no extension is applied. This prevented unnecessary modifications and focused on cases with incomplete contact data. Consequently, for small objects fully contained within the sensing area, potential shape misclassifications do not affect the tactile map because shape-specific extension rules are not triggered for fully enclosed contact footprints.
3.2.2. Shape-Specific Rules
Each prototypical shape follows a tailored extension strategy.
Cuboid: For flat-surface objects, such as boxes and books, edge taxels are mirrored across the sensor boundary to extend the planar contact area, approximating a local rigid translation aligned with the sensor frame, consistent with the assumptions in 20.
Sphere: For round, smooth objects (e.g., balls and knobs), when the spherical contact intersects a sensor edge and is not fully contained, newly added taxels are populated by symmetric reflection across that edge to continue the contact. This simplifying assumption preserves the spherical geometry exactly only when the intersection is near an equatorial cross-section (i.e., the centerline lies on the edge). Otherwise, it can over- or under-extend the curvature. It is adopted here as a baseline, and future work will estimate the local radius and center offset to enforce curvature-consistent completion.
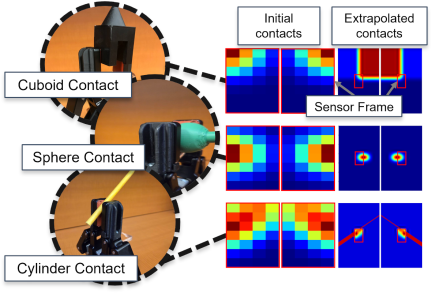
Fig. 6. Examples of contact extrapolation for cuboid, sphere, and cylinder. Left: real object contacts with the gripper. Middle: initial tactile images. Right: extrapolated regions obtained via shape-specific extrapolation.
Cylinder: The cylinder represents elongated objects, such as bottles and rods, combining elements of both cuboid and spherical shapes. When the contact intersects the sensor frame, it extends along its principal axis and symmetrically populates a region perpendicular to the axis.
In Fig. 6, representative initial and extrapolated contacts for each class are shown. The extended contact effectively enlarges the portion of the object represented in the sensor frame. This enlargement provides an extended contact surface, which can be leveraged in future studies to identify stable configurations. This promotes the spatial continuity of the tactile map and supports the prediction of grasp outcomes, thereby improving the reliability and generalizability of the contact extrapolation step.
3.3. Evaluation Metrics
After classifying the object and extrapolating the unseen contact region, quantitative evaluation metrics are used to assess the accuracy of the extrapolated contact. These metrics determine how closely the virtual data approximates the real tactile feedback.
Several studies have highlighted the importance of center-of-mass (CoM) estimation for adaptive grasping. For example, Wang et al. 36 proposed a Bayesian framework to estimate the physical CoMs of unknown objects to aid recovery from failure. By contrast, the present study computes a TC from a tactile image and compares the centroids between the measured and extrapolated maps. The TC is the geometric centroid of the binary contact region (unweighted), which enables a direct comparison between real and virtual data.
3.3.1. Tactile Centroid (TC)—Area-Normalized MSE
The mean squared error (MSE) quantifies the alignment between the real and extrapolated contact positions. Each sensor is calculated as follows:
3.3.2. Tactile Centroid (TC)—Absolute Error
The absolute error was computed by measuring the Euclidean distance between the extrapolated and actual TCs at each test point. Movements occurred along the \(X\)- and \(Y\)-axes. As the number of test points was limited by both the small object dimensions and the minimum step size of the robot, a grid-based sweeping procedure was employed. This method provides sufficient spatial coverage while capturing meaningful variations in tactile images (Fig. 1(e)).
The normalization and averaging procedures used to produce a unified TC error trend per object followed the same approach described for the GSR normalized relative error metric (see Section 3.3.4).
3.3.3. GSR—Area-Normalized Mean Absolute Error [% mm\(^{-2}\)]
The GSR provides a complementary metric to evaluate how closely the virtual tactile data aligns with real contact information. It is computed using the grasp assessment network introduced in 21, which employs an unsupervised feature-learning approach to estimate the likelihood of a successful grasp.
To quantify the extrapolation accuracy, the GSR values predicted from the extrapolated tactile images were compared with those obtained from real tactile data across all positions in the grid-based scan of the robot.
The mean absolute error (MAE), expressed in percentage points, is defined as
To allow fair comparisons across experiments with varying object sizes and grid resolutions, the MAE was normalized by the total area explored during the grid scan, yielding the area-normalized MAE:
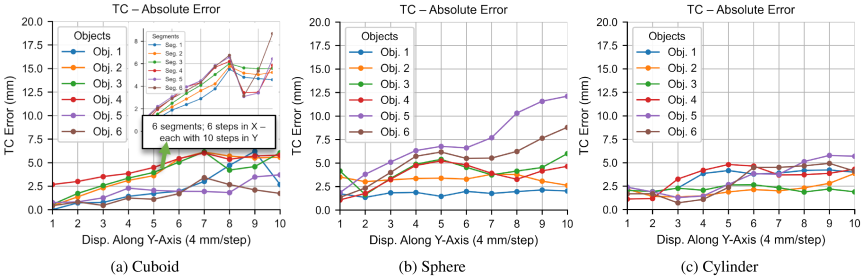
Fig. 7. TC absolute error versus displacement along the \(Y\)-axis for three shape classes: (a) cuboid, (b) sphere, and (c) cylinder. For each object, the finger scanned 10 steps along \(Y\), then shifted one step in \(X\) and repeated, covering the object’s surface in a grid. Error values from all \(X\)-displacement were averaged to form a representative curve. Panel (a) includes an example \({6 \times10}\) grid (60 points) showing the six per-\(X\) curves whose mean forms the plotted trend.
3.3.4. GSR—Normalized Relative Error
The normalized relative error quantifies the proportional discrepancy between the real and virtual GSR. It is defined as
To evaluate how this error evolves across the grid, the values are arranged into a matrix \(E \in \mathbb{R}^{P_{x} \times P_{y}}\), where \(e_{i,j}\) is the relative error at grid point \((i,j)\) (row \(i\) indexes the \(X\)-step, column \(j\) indexes the \(Y\)-step):
\(\bar{E}\) captures the average relative error at each depth step along \(Y\), smoothing out lateral fluctuations. It provides a standardized and compressed representation of the GSR error, supporting meaningful comparisons across objects and grid configurations.
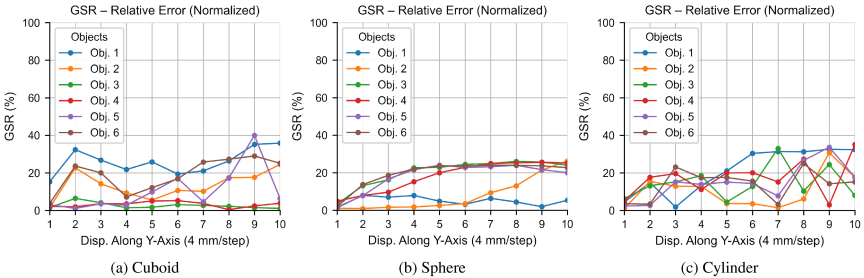
Fig. 8. Normalized relative GSR error versus displacement along the \(Y\)-axis. For comparability, each sequence is normalized to its value at the first evaluated step (the initial point with real contact is excluded), highlighting how prediction error grows as evaluation points lie farther from the initial contact edge.
4. Results and Discussion
This section evaluates the accuracy and effectiveness of the proposed method for extrapolating the unseen contact regions. Using tactile data from multiple objects, the framework extends the contact areas conditioned on the initial sensor readings and predicted object shape.
Tactile images were first captured from a starting grasp using two capacitive sensors 31. Based on this initial contact, the shape of the object was classified using the framework described in Section 3.1. A grid-based movement (Section 3.3.4), incorporating a sweep/normalization procedure, was then employed to scan the surface of the object and collect tactile data at multiple relative finger positions.
Six objects from each shape class were used for evaluation. A grid-based traversal area was defined for each object. The measured tactile data were collected by moving the robot fingers across the object surface, whereas the virtual tactile data were sampled point-by-point from the extrapolated tactile map derived from the initial imprint and shape label.
A total of 650 test points were collected across all the objects. A 3D-printed adapter (see Fig. 1(j)) held the objects upright, allowing the fingers to conform to their surfaces under a normal force without rigid anchoring.
The evaluation results obtained using the TC absolute error metric (Section 3.3.2) are shown in Fig. 7. This metric quantifies the difference between the TCs of real and virtual contacts at each test point. The fingers traversed each object in a grid pattern, typically 10 steps along the \(Y\)-axis and a variable number along the \(X\), depending on the object width. As shown in Fig. 1(e), the finger moved incrementally along \(Y\), returned to the edge, shifted by one step in \(X\), and repeated this until the entire grid was covered.
Each object produced a set of TC deviation curves across \(X\)-positions. These curves were row-normalized and averaged to obtain a single representative trend over 10 \(Y\)-steps, as described in Section 3.3.4. An example stack of TC deviation curves for a cuboid with a \({6 \times 10}\) grid (60 points) is shown in Fig. 7(a).
The combined curves in Fig. 7 do not start at zero because the initial \(X\)-step in each test corresponds to a real sensor contact, whereas the subsequent \(X\)-displacements are derived from extrapolated data. These small initial discrepancies lead to a non-zero starting value for the averaged trend. A similar evaluation procedure was applied to the GSR.
The results show a consistent increase in the absolute TC deviation with a positive \(Y\), i.e., as the finger moves away from the initial contact edge toward the interior of the object. Because only the boundary region is directly observed, predictions farther from that edge increasingly rely on shape-conditioned extrapolation, which increases uncertainty and error. This trend is consistent with the design assumption that the extrapolation accuracy degrades with the distance from the measured contact.
Unlike TC, which is geometric, the GSR metric was derived from the predicted grasp-success scores from the network proposed in 21. Fig. 8 shows the normalized relative GSR error across the six test objects per class, computed using the procedure outlined in Section 3.3.4.
Similar to the TC trends, the GSR error increases with displacement from the edge of the object, confirming that the prediction quality deteriorates with distance. This reinforces the reliability of the evaluation approach and highlights the natural limitations of contact extrapolation based solely on initial contact.
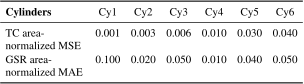
Since the grid size varies across tests due to differing object dimensions, two complementary metrics were introduced in Section 3.3 to enable fair cross-object comparisons. The area-normalized MSE, as described in Section 3.3.1, summarizes the overall alignment between the virtual and real contact regions across the entire grid. By normalizing the MSE with respect to the total scanned area, this metric compensates for grid size variations, allowing for a consistent evaluation of the contact quality, regardless of the object geometry.
Similarly, the area-normalized MAE, detailed in Section 3.3.3, quantifies GSR error in terms of % mm\(^{-2}\). This normalization ensures that GSR discrepancies are assessed independently of the grid density and object scale, making the metric suitable for evaluating both scalability and prediction accuracy.
As summarized in Tables 1–3, the area-normalized MSE for the TC ranges from 0.008 to 0.05 for cuboids, 0.003 to 0.10 for spheres, and 0.001 to 0.04 for cylinders. Correspondingly, the area-normalized MAE for GSR ranges from 0.005% to 0.10% for cuboids, 0.02% to 0.08% for spheres, and 0.01% to 0.10% for cylinders. The consistently low TC values indicate that the extrapolated contacts are geometrically close to the measured contacts, whereas the low GSR errors suggest that the extrapolated contacts preserve grasp-relevant cues, as assessed by the predictor of 21. Because GSR does not uniquely determine contact geometry, the performance is reported jointly: Section 4.1 defines a safe zone that requires both TC and GSR errors to be below thresholds.
Table 1. Error metrics for the cuboid class: area-normalized MSE for TC (dimensionless) and area-normalized MAE for GSR [% mm\(^{-2}\)] across six objects.
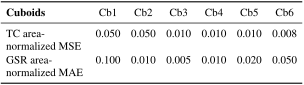
Table 2. Error metrics for the sphere class: area-normalized MSE for TC (dimensionless) and area-normalized MAE for GSR [% mm\(^{-2}\)] across six objects.
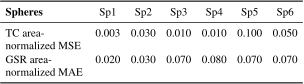
Table 3. Error metrics for the cylinder class: area-normalized MSE for TC (dimensionless) and area-normalized MAE for GSR [% mm\(^{-2}\)] across six objects.
4.1. Safe Zone
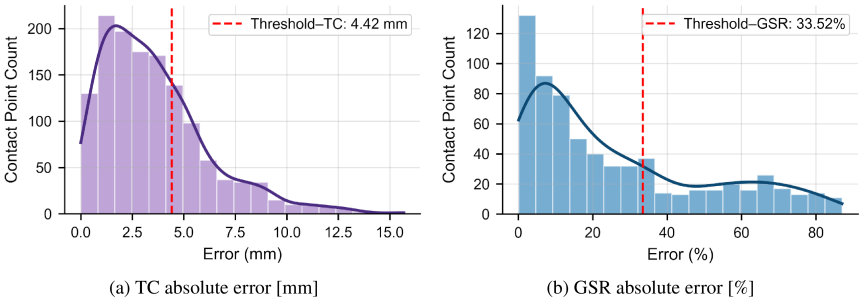
Fig. 9. Histograms of absolute errors aggregated over 650 test points from 18 objects: (a) TC (combined over two sensors) and (b) GSR. The vertical dashed line marks the 70th-percentile threshold in each panel.
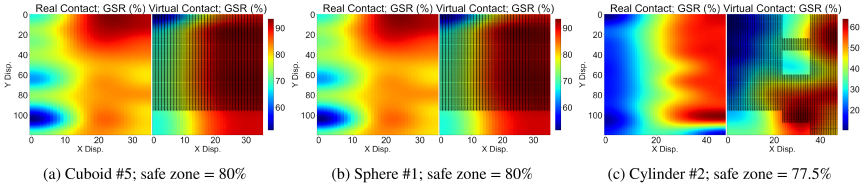
Fig. 10. Safe zones for three representative objects. Each panel compares real (left) and virtual (right) GSRs as heatmaps (color scale: 0%–100%). The extrapolated contact map is shown at an upsampled resolution (\(10\times\)). Hatched black outlines on the virtual contact heatmap mark regions where both TC and GSR errors fall below the 70th-percentile thresholds.
A safe zone was defined to identify the regions where the extrapolated contact aligned with the measured tactile feedback. It comprises grid locations where both the TC and GSR errors fall below the empirically derived thresholds, indicating agreement between the extrapolated and measured data.
Rather than setting arbitrary bounds, a data-driven approach was used, and the threshold was taken as the 70th percentile of the cumulative error distribution across all tests. This typically captures the majority of low-error points, while accommodating variations across shapes and grid sizes. Thus, the safe zone is the area in which both evaluation metrics (TC and GSR errors) are below the 70th percentile of their respective distributions. It should be emphasized that the safe zone represents regions of high extrapolation fidelity rather than high physical grasp stability.
A grid point is considered “safe” if the virtual and real metrics are aligned within the defined thresholds, thereby providing the robot with a reliable perceptual boundary. Within this area, the robot can trust the extrapolated contact map to inform its next movement, regardless of whether the predicted grasp success is high or low.
For this dataset, the corresponding thresholds were approximately 5 mm (TC) and 34% (GSR). These percentile thresholds were derived from an analysis of the error distributions across all 18 objects and 650 test points, as illustrated in Fig. 9, which presents histograms of the TC and GSR errors along with their 70th percentile markers.
To quantify the extent of the safe zone relative to the total scanned grid, we compute
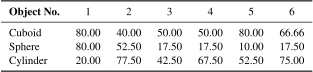
A full summary of the safe zone percentages across all objects is provided in Table 4, accounting for the varying grid sizes across object geometries.
Table 4. Safe zone percentages [%] for six objects in each class.
4.2. Supplementary Metric: SSIM Analysis
The SSIM 37 was computed to further evaluate the fidelity of the extrapolated contacts. SSIM is widely used for assessing perceptual similarity and structural consistency between images and has also been applied to tactile sensing 38. Whereas the TC error captures the geometric alignment, the SSIM reflects the preservation of the local structure, providing a complementary perspective.
Figure 11 shows the relationship between the TC deviation and SSIM for all test points and sensors. The vertical and horizontal dashed lines mark the median TC deviation and SSIM, respectively, partitioning the scattering into four quadrants. A moderate negative correlation (Pearson’s \(r = -0.64\)) was observed; lower TC error tended to coincide with higher SSIM. The marginal densities further indicate that many test points fall in the quadrant with a low TC error and high SSIM under the present protocol.
Taken together, these analyses suggest that the extrapolated contacts not only align geometrically with the measured contacts (TC) but also preserve the local structure (SSIM).
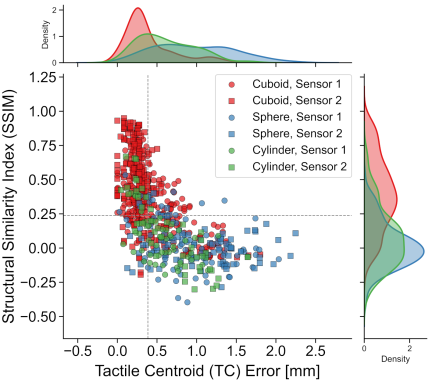
Fig. 11. Relationship between TC error and SSIM across all object classes and sensors. Each point represents a single test case. Colors denote object type; marker shape indicates sensor index (Sensor 1 \(=\) circles, Sensor 2 \(=\) squares). Dashed lines mark the median values for both metrics. Lower TC error generally corresponds to higher SSIM, confirming that accurate centroid alignment is associated with greater structural similarity between real and virtual tactile images.
5. Conclusion
This paper presented a tactile-based framework for extrapolating unseen contact regions to support robotic regrasping. A shape classifier assigned objects as cuboids, spheres, or cylinders based on the initial tactile imprint, after which the unobserved portions of the tactile map are extrapolated using shape-specific rules. Accuracy was assessed using multiple metrics, including the TC, GSR, and SSIM, and further summarized with a safe zone criterion that combines TC and GSR.
In the held-out test set, the shape classifier reached 94.3%; on an external set of unseen real-world objects, 80.8%. Across objects, area-normalized TC MSE (dimensionless) ranged from 0.008 to 0.05 for cuboids, 0.003 to 0.10 for spheres, and 0.001 to 0.04 for cylinders, while area-normalized GSR MAE ranged from 0.005% mm\(^{-2}\) to 0.10% mm\(^{-2}\), 0.02% mm\(^{-2}\) to 0.08% mm\(^{-2}\), and 0.01% mm\(^{-2}\) to 0.10% mm\(^{-2}\), respectively (Tables 1–3). SSIM analysis showed a moderate negative correlation with TC error (Pearson’s \(r = -0.64\)), indicating that lower centroid deviation tended to coincide with higher structural similarity. A recurring failure mode involved large-radius cylinders (e.g., the coffee container), whose locally flat imprints led to misclassification as cuboids (9 of 14 cylinder misclassifications), which is consistent with the limited curvature cues in the sensed contact.
Although effective under the tested conditions, this method could also benefit from improved adaptability. The shape classifier performed well on small, rigid objects, but struggled with larger ones. Expanding the dataset to encompass a wider range of shapes and scales could improve classification and enhance contact extrapolation. Similarly, refining the grasp assessment network may yield more reliable GSR predictions and support more accurate safe zone identification.
Incorporating higher-resolution tactile sensors, as suggested by prior studies on resolution effects 24, could improve the extrapolation method by capturing finer contact details, potentially leading to more precise contact estimates and more stable grasp predictions. In combination with broader training data and an updated assessment network, these changes may increase overall accuracy and practical utility.
Future studies should leverage the validated extrapolation signal to implement a virtual search strategy for closed-loop regrasping. The objective was to use the extrapolated map to identify stable grasp configurations near the initial contact, limiting the physical finger reconfiguration and compensating for misalignments. This proactive approach aims to reduce failure risks such as tipping or slippage before the final lift.
Although the TC was computed from binary tactile images for simplicity, future implementations could leverage full-valued tactile intensities. This richer input may enable a more accurate estimation of the contact distribution and better reflect the force variations across the contact region.
- [1] A. Billard and D. Kragic, “Trends and challenges in robot manipulation,” Science, Vol.364, No.6446, Article No.eaat8414, 2019. https://doi.org/10.1126/science.aat8414
- [2] F. Vicentini, “Collaborative robotics: A survey,” J. of Mechanical Design, Vol.143, No.4, Article No.040802, 2021. https://doi.org/10.1115/1.4046238
- [3] L. Zaidi, J. A. Corrales, B. C. Bouzgarrou, Y. Mezouar, and L. Sabourin, “Model-based strategy for grasping 3D deformable objects using a multi-fingered robotic hand,” Robotics and Autonomous Systems, Vol.95, pp. 196-206, 2017. https://doi.org/10.1016/j.robot.2017.06.011
- [4] H.-Y. Lin, S.-C. Liang, and Y.-K. Chen, “Robotic grasping with multi-view image acquisition and model-based pose estimation,” IEEE Sensors J., Vol.21, No.10, pp.11870-11878, 2021. https://doi.org/10.1109/JSEN.2020.3030791
- [5] M. W. Spong, “An historical perspective on the control of robotic manipulators,” Annual Review of Control, Robotics, and Autonomous Systems, Vol.5, pp. 1-31, 2022. https://doi.org/10.1146/annurev-control-042920-094829
- [6] O. Kroemer, S. Niekum, and G. Konidaris, “A review of robot learning for manipulation: Challenges, representations, and algorithms,” J. of Machine Learning Research, Vol.22, No.1, pp. 1395-1476, 2021.
- [7] H. Zhang, J. Tang, S. Sun, and X. Lan, “Robotic grasping from classical to modern: A survey,” arXiv:2202.03631, 2022. https://doi.org/10.48550/arXiv.2202.03631
- [8] H. Wang, Z. Liu, L. Zhou, H. Yin, and M. H. Ang, “PEGG-Net: Pixel-wise efficient grasp generation in complex scenes,” 2024 IEEE Int. Conf. on Cybernetics and Intelligent Systems (CIS) and IEEE Int. Conf. on Robotics, Automation and Mechatronics (RAM), pp. 199-206, 2024. https://doi.org/10.1109/CIS-RAM61939.2024.10672873
- [9] J. Shi et al., “ASGrasp: Generalizable transparent object reconstruction and grasping from RGB-D active stereo camera,” arXiv:2405.05648v1, 2024. https://doi.org/10.48550/arXiv.2405.05648
- [10] X. Mao et al., “Learning fine pinch-grasp skills using tactile sensing from a few real-world demonstrations,” arXiv:2307.04619, 2024. https://doi.org/10.48550/arXiv.2307.04619
- [11] R. Calandra et al., “The feeling of success: Does touch sensing help predict grasp outcomes?,” arXiv:1710.05512v1, 2017. https://doi.org/10.48550/arXiv.1710.05512
- [12] D. Morrison, P. Corke, and J. Leitner, “EGAD! An evolved grasping analysis dataset for diversity and reproducibility in robotic manipulation,” IEEE Robotics and Automation Letters, Vol.5, No.3, pp. 4368-4375, 2020. https://doi.org/10.1109/LRA.2020.2992195
- [13] M. R. Motamedi, D. Florant, and V. Duchaine, “A wearable haptic device based on twisting wire actuators for feedback of tactile pressure information,” J. Robot. Mechatron., Vol.27, No.4, pp. 419-429, 2015. https://doi.org/10.20965/jrm.2015.p0419
- [14] C. Ferrari and J. Canny, “Planning optimal grasps,” 1992 IEEE Int. Conf. on Robotics and Automation, Vol.3, pp. 2290-2295, 1992. https://doi.org/10.1109/ROBOT.1992.219918
- [15] A. Bicchi and V. Kumar, “Robotic grasping and contact: A review,” 2000 IEEE Int. Conf. on Robotics and Automation, Vol.1, pp. 348-353, 2000. https://doi.org/10.1109/ROBOT.2000.844081
- [16] H. Jahanshahi and Z. H. Zhu, “Review of machine learning in robotic grasping control in space application,” Acta Astronautica, Vol.270, pp. 37-61, 2024. https://doi.org/10.1016/j.actaastro.2024.04.012
- [17] Z. Lu et al., “Visual-tactile robot grasping based on human skill learning from demonstrations using a wearable parallel hand exoskeleton,” IEEE Robotics and Automation Letters, Vol.8, No.9, pp. 5384-5391, 2023. https://doi.org/10.1109/LRA.2023.3295296
- [18] Y. Chebotar, K. Hausman, Z. Su, G. S. Sukhatme, and S. Schaal, “Self-supervised regrasping using spatio-temporal tactile features and reinforcement learning,” 2016 IEEE/RSJ Int. Conf. on Intelligent Robots and Systems (IROS), pp. 1960-1966, 2016. https://doi.org/10.1109/IROS.2016.7759309
- [19] Y. Domae, A. Noda, T. Nagatani, and W. Wan, “Robotic general parts feeder: Bin-picking, regrasping, and kitting,” 2020 IEEE Int. Conf. on Robotics and Automation (ICRA), pp. 5004-5010, 2020. https://doi.org/10.1109/ICRA40945.2020.9197056
- [20] F. R. Hogan, M. Bauza, O. Canal, E. Donlon, and A. Rodriguez, “Tactile regrasp: Grasp adjustments via simulated tactile transformations,” 2018 IEEE/RSJ Int. Conf. on Intelligent Robots and Systems (IROS), pp. 2963-2970, 2018. https://doi.org/10.1109/IROS.2018.8593528
- [21] J. Kwiatkowski, M. Jolaei, A. Bernier, and V. Duchaine, “The good grasp, the bad grasp, and the plateau in tactile-based grasp stability prediction,” 2022 IEEE/RSJ Int. Conf. on Intelligent Robots and Systems (IROS), pp. 4653-4659, 2022. https://doi.org/10.1109/IROS47612.2022.9981360
- [22] F. Guo et al., “Event-driven tactile sensing with dense spiking graph neural networks,” IEEE Trans. on Instrumentation and Measurement, Vol.74, Article No.2508113, 2025. https://doi.org/10.1109/TIM.2025.3541787
- [23] Y. Hu et al., “Learning robust grasping strategy through tactile sensing and adaption skill,” 2024 IEEE Int. Conf. on Robotics and Biomimetics (ROBIO), pp. 1197-1202, 2024. https://doi.org/10.1109/ROBIO64047.2024.10907398
- [24] Q. Wan and R. D. Howe, “Modeling the effects of contact sensor resolution on grasp success,” IEEE Robotics and Automation Letters, Vol.3, No.3, pp. 1933-1940, 2018. https://doi.org/10.1109/LRA.2018.2807581
- [25] D. Cockbum, J.-P. Roberge, T.-H.-L. Le, A. Maslyczyk, and V. Duchaine, “Grasp stability assessment through unsupervised feature learning of tactile images,” 2017 IEEE Int. Conf. on Robotics and Automation (ICRA), pp. 2238-2244, 2017. https://doi.org/10.1109/ICRA.2017.7989257
- [26] J. Kwiatkowski, D. Cockburn, and V. Duchaine, “Grasp stability assessment through the fusion of proprioception and tactile signals using convolutional neural networks,” 2017 IEEE/RSJ Int. Conf. on Intelligent Robots and Systems (IROS), pp. 286-292, 2017. https://doi.org/10.1109/IROS.2017.8202170
- [27] E. Hyttinen, D. Kragic, and R. Detry, “Learning the tactile signatures of prototypical object parts for robust part-based grasping of novel objects,” 2015 IEEE Int. Conf. on Robotics and Automation (ICRA), pp. 4927-4932, 2015. https://doi.org/10.1109/ICRA.2015.7139883
- [28] Y. Tanaka, S. Shiraki, K. Katayama, K. Minamizawa, and D. Prattichizzo, “Bilaterally shared haptic perception for human-robot collaboration in grasping operation,” J. Robot. Mechatron., Vol.33, No.5, pp. 1104-1116, 2021. https://doi.org/10.20965/jrm.2021.p1104
- [29] R. Higo, T. Senoo, and M. Ishikawa, “Dynamic in-hand regrasping using a high-speed robot hand and high-speed vision,” IFAC-PapersOnLine, Vol.53, No.2, pp. 9796-9801, 2020. https://doi.org/10.1016/j.ifacol.2020.12.2671
- [30] D. Kalashnikov et al., “Scalable deep reinforcement learning for vision-based robotic manipulation,” Proc. of the 2nd Conf. on Robot Learning, pp. 651-673, 2018.
- [31] T.-H.-L. Le, A. Maslyczyk, J.-P. Roberge, and V. Duchaine, “A highly sensitive multimodal capacitive tactile sensor,” 2017 IEEE Int. Conf. on Robotics and Automation (ICRA), pp. 407-412, 2017. https://doi.org/10.1109/ICRA.2017.7989053
- [32] R. Detry, C. H. Ek, M. Madry, and D. Kragic, “Learning a dictionary of prototypical grasp-predicting parts from grasping experience,” 2013 IEEE Int. Conf. on Robotics and Automation, pp. 601-608, 2013. https://doi.org/10.1109/ICRA.2013.6630635
- [33] J.-P. Roberge, L. L’Écuyer-Lapierre, J. Kwiatkowski, P. Nadeau, and V. Duchaine, “Tactile-based object recognition using a grasp-centric exploration,” IEEE 17th Int. Conf. on Automation Science and Engineering (CASE), pp. 494-501, 2021. https://doi.org/10.1109/CASE49439.2021.9551491
- [34] B. Zhang, Y. Zhang, J. Liu, and B. Wang, “FGFF descriptor and modified Hu moment-based hand gesture recognition,” Sensors, Vol.21, No.19, Article No.6525, 2021. https://doi.org/10.3390/s21196525
- [35] X. Shu, Q. Zhang, J. Shi, and Y. Qi, “A comparative study on weighted central moment and its application in 2D shape retrieval,” Information, Vol.7, No.1, Article No.10, 2016. https://doi.org/10.3390/info7010010
- [36] Y. Wang, T. Li, and Y. Jiang, “Center-of-mass location estimation for improving the adaptability of grasping failure recovery policy,” IEEE Trans. on Industrial Electronics, Vol.72, No.9, pp. 9333-9343, 2025. https://doi.org/10.1109/TIE.2025.3544201
- [37] Z. Wang, A. C. Bovik, H. R. Sheikh, and E. P. Simoncelli, “Image quality assessment: From error visibility to structural similarity,” IEEE Trans. on Image Processing, Vol.13, No.4, pp. 600-612, 2004. https://doi.org/10.1109/TIP.2003.819861
- [38] B. A. De la Cruz Sánchez and J.-P. Roberge, “A hybrid elastic-hyperelastic approach for simulating soft tactile sensors,” Frontiers in Robotics and AI, Vol.12, Article No.1639524, 2025. https://doi.org/10.3389/frobt.2025.1639524
This article is published under a Creative Commons Attribution-NoDerivatives 4.0 Internationa License.