Paper:
Community Classification Based on Landform Distribution and Flood Hazard Characteristics in Candaba Municipality, Pampanga River Basin, Philippines
Naoko Nagumo*,†, Miho Ohara**, and Patricia Ann Jaranilla-Sanchez***

*International Centre for Water Hazard and Risk Management (ICHARM), Public Works Research Institute (PWRI)
1-6 Minamihara, Tsukuba, Ibaraki 305-8516, Japan
†Corresponding author
**Interfaculty Initiative in Information Studies, The University of Tokyo
Tokyo, Japan
***School of Environmental Science and Management, University of the Philippines Los Baños
Los Baños, Philippines

The Candaba Swamp, situated in the lower reaches of the Pampanga River on Luzon Island, is important for maintaining the local ecosystem and storing floodwaters. Analyses using an original land classification map and satellite images describing the situation of recent flood inundation show that severe flooding in the Candaba Swamp mainly results from concentrated flood flows from eastern tributary rivers and the Cabiao Floodway onto lower landform surfaces. Communities in Candaba municipality, which includes most of the swamp, are divided into four groups based on flood hazard characteristics identified from landform distributions and recent flood inundation conditions. In the most flood-prone group, located in the central swamp, the average floor height of living spaces above the ground is higher compared to the other groups. However, in two-story houses, the most common house type in the group, the flood inundation height reached an average of 1.8 ft above the floor level during the worst flood event in the past five years. These households also tend to have longer residency and show less intention to relocate, likely because flood inundation in the swamp brings both risks and certain benefits. Implementing flood countermeasures, including those that maximize the functions of the Candaba Swamp, should consider these flood hazard characteristics and local living practices.
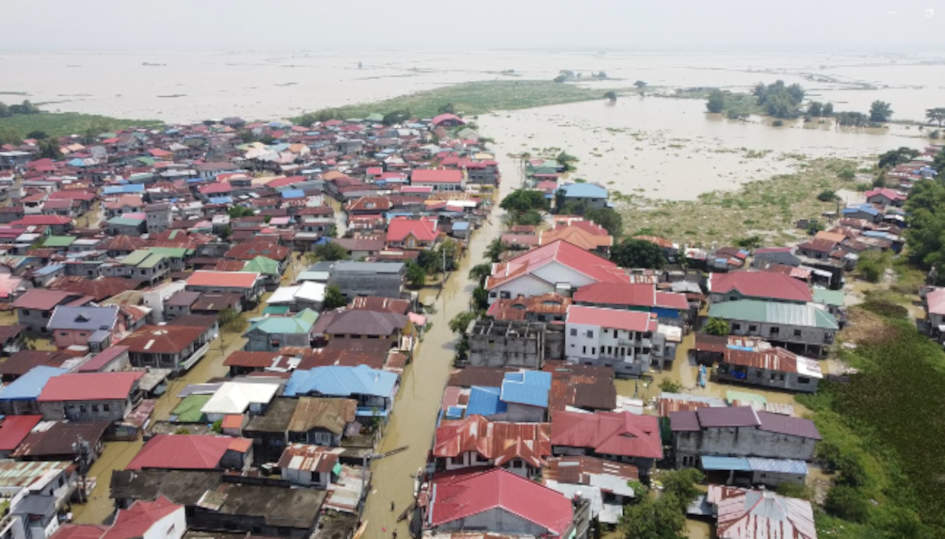
Flooding of Barangay San Agustin, Candaba Municipality in September 2022
1. Introduction
Many studies show that conserving ecosystems in wetlands, flood retention areas, and mangrove forests effectively reduces flood and storm surge risks. These solutions, often called ecosystem-based disaster risk reduction (Eco-DRR), have recently gained attention for focusing on disaster risk reduction by using ecosystem functions 1,2,3,4,5. In developing countries, where disaster risk reduction budgets are limited and local livelihoods often depend on nearby ecosystems, nature-based approaches are expected to provide effective measures against water-related disasters 6.
However, with climate change, if floods occur at unprecedented scales and frequencies, habitats for plants and animals may be destroyed, or flooding may worsen due to insufficient retention capacity, increasing the potential for damage. In particular, developing countries often lack the infrastructure, technology, data, research, and financial resources needed to sustain Eco-DRR, which may result in even more severe consequences. Designing strategies to address social challenges, such as reducing flood disaster risks and adapting to and mitigating climate change impacts, requires a comprehensive approach that combines Eco-DRR with conventional structural and non-structural measures to address the limitations of Eco-DRR. To achieve this, understanding local flood hazard characteristics and the local way of life is essential, as is identifying current and potential challenges related to flooding.
Candaba Swamp in the Republic of the Philippines is a major rice-producing area and serves as a flood retention basin during the rainy season. It is essential for maintaining the local ecosystem and is protected under the Wildlife Resources Conservation and Protection Act (Republic Act No.9147) of the Philippines. As a result, the swamp is recognized as one of the best examples of Eco-DRR in the country.
During the rainy season (approximately June to November), tropical cyclones can increase flood extent and depth in the swamp beyond typical conditions, sometimes causing severe damage to surrounding areas. After each flood event, recovery efforts usually focus on restoring conditions to pre-disaster levels or lower, so lessons from past disasters are often not fully used to improve local resilience. In addition, climate change may increase extreme rainfall 7, which could lead to more floodwater accumulating in Candaba Swamp and potentially raise flood risk.
This study examines Candaba Swamp and its surrounding areas in central Luzon Island, aiming to clarify current flood hazard characteristics at the community level based on landform distribution and recent flood inundation and to analyze residential patterns in relation to flood hazards. The target area is Candaba municipality, which includes most of Candaba Swamp. The results provide a basis for assessing local flood risks and challenges under climate change and for designing flood management strategies that maximize the swamp’s functions.
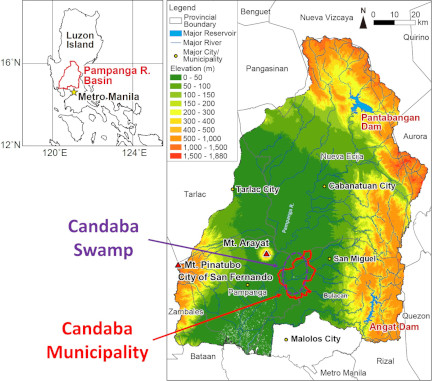
Fig. 1. Map of the Pampanga River basin.
2. Study Area
The Candaba Swamp is in the lower reaches of the Pampanga River, as shown in Fig. 1. The river is 265 km long, has a drainage area of 10,430 km\(^2\), and flows into Manila Bay. The northern and eastern parts of the basin have mountains and hills over 300 m in elevation, while the western part contains volcanoes such as Mt. Pinatubo (1,486 m) and Mt. Arayat (1,033 m). The Pampanga River flows southward in a meandering channel through the center of the basin. Downstream of Mt. Arayat, the riverbed slope becomes very gentle, less than \(1/10,000\). In this area, a low-lying alluvial plain, mostly below 10 m in elevation, has formed, with Candaba Swamp located east of Mt. Arayat 8.
Candaba municipality has a population of 124,019 according to the 2024 census and consists of 33 barangays, which are the smallest administrative units with their own budgets, similar to communities, as shown in Fig. 2. This is the oldest municipality in the Pampanga area, established in the late 1570s. The oldest barangay is Mandasig 9. The area around Barangay Buas, which contains the municipal hall, a historical church, and a public market, currently serves as the municipal center. Major roads from this center extend to the eastern and southeastern parts of the municipality and are mostly elevated to prevent disruptions from flooding during the rainy season.
A bridge connects the barangays of Buas and Pasig, linking the right and left banks of the Pampanga River. The right bank is protected by both the inner Setback Levee and the outer Arnedo Dike, while the left bank lacks levee protection. The Setback Levee is higher than the Arnedo Dike and also serves as an elevated road. The Cabiao Floodway, located north of the municipality, can divert discharge from the Pampanga River into the Candaba Swamp and reduce downstream flood peaks during major flood events.
Candaba municipality frequently experiences severe flooding, particularly due to tropical cyclones. In November 2020, Typhoon Ulysses (international name: Vamco) crossed the Pampanga River basin, with some observation stations recording 24-hour accumulated rainfall of more than 300 mm 10. In Candaba municipality, flooding affected 29 barangays and more than 76,000 people 11. In September 2022, Typhoon Karding (international name: Noru) also crossed the Pampanga River basin, with some observation stations recording 24-hour accumulated rainfall of more than 200 mm 12.
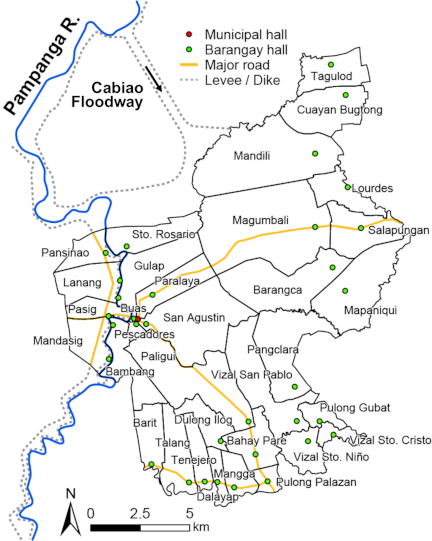
Fig. 2. Barangays in Candaba municipality. Each barangay has a barangay hall, serving as the administrative center.
Figure 3 presents a photograph of houses in Barangay San Agustin and the Candaba Swamp following Typhoon Karding’s passage across the basin. The image shows that floodwaters from the swamp, visible in the background, entered the barangay.

Fig. 3. Flooding of Barangay San Agustin. The photograph was taken on September 22, 2022.
3. Methodology
In alluvial plains, the distribution of landform surfaces reflects past flood inundation and sediment transport processes. Therefore, it is possible to estimate the scale and characteristics of potential flood hazards in these areas 13. In this study, a land classification map of Candaba municipality is developed to show the morphology and distribution of landform surfaces. To develop this map, ALOS PRISM stereo satellite images acquired on February 11, 2007, are used, and the previously published basin-scale land classification map 6 and Google Earth satellite images are also referenced. Observations of local agriculture and land use patterns made during field visits by the authors are considered as additional reference information for classifying landforms. The land classification map is then used to characterize flood hazards in each barangay, combined with recent satellite images from flood events, including Sentinel-2 images captured on November 13, 2020, and November 2, 2022.
Residential patterns, such as building distribution, house structures, and local flood experiences, are examined using selected items from an interview survey conducted in the municipality from June 24 to July 2, 2024. The survey used a questionnaire with approximately 40 items covering flood experiences, risk perception, intention to take flood countermeasures, and basic attributes. The questionnaire was written in Tagalog, and interviews were conducted with sequential translation into Kapampangan, the local language commonly spoken in the area. Each household was represented by one respondent, and the geographic locations of the surveyed houses were recorded 14.
4. Landform Distribution and Flood Hazard Characteristics
4.1. Landform Distribution Based on the Land Classification Map
Figure 4(a) presents the elevation map, and Fig. 4(b) shows the land classification map produced in this study. Fig. 4(c) displays a Sentinel-2 satellite image taken after Typhoon Paeng in October 2022. Fig. 4(d) shows an image captured after Typhoon Ulysses in November 2020, which was among the most severe flood events in recent years.
As shown in Fig. 4(a), the central part of the municipality is low-lying, with elevations below 4 m. The lowest areas, with elevations between 2 m and less than 3 m, are found in the barangays of Sto. Rosario, Gulap, Paralaya, and San Agustin. Adjacent areas with elevations between 3 m and less than 4 m are located in the barangays of Magumbali, Barangca, Viazal San Pablo, Paligui, Bambang, Barit, Talang, and Pescadores. These areas are considered the Candaba Swamp in the narrow sense. In the western part of the municipality, along the right bank of the Pampanga River, low-lying areas with elevations between 2 m and less than 3 m are found in the barangays of Lanang, Pasig, and Mandasig. In contrast, the eastern and southern parts of the municipality are surrounded by slightly higher areas with elevations of 5 m or more.
According to the land classification map (Fig. 4(b)), the landforms of Candaba municipality are divided into uplands and lowlands. Uplands are found in the northern and southern parts of the municipality and are further classified as higher upland I and upland II, based on relative elevation and surface morphology. Lowlands are classified as fan, valley plain, delta, meander scroll, swamp, swamp core, former channel, and riverbed in the dry season. The lowest landform surface on the left bank of the Pampanga River is the swamp core, where tributaries of the Bulo, San Miguel, and Garlang Rivers converge. The surrounding area is classified as swamp, with former channels appearing during the dry season. In the eastern part of the municipality, a fan formed by the San Miguel River and traces of former river channels are present. The fan apex is near the eastern edge of Barangay Salapungan. Along the Pampanga River, meander scrolls indicate past shifts of the meandering channel, but their boundaries on the right bank are unclear because of levee construction. Most of the right bank area is classified as delta, which is a slightly higher landform surface than swamp.
Artificial modifications to the tributary channels on the left bank of the Pampanga River are extensive, with these altered channels often integrated into the irrigation and drainage systems that serve paddy fields and fish ponds. Land modifications for the construction of fish ponds on the right bank are also prominent.
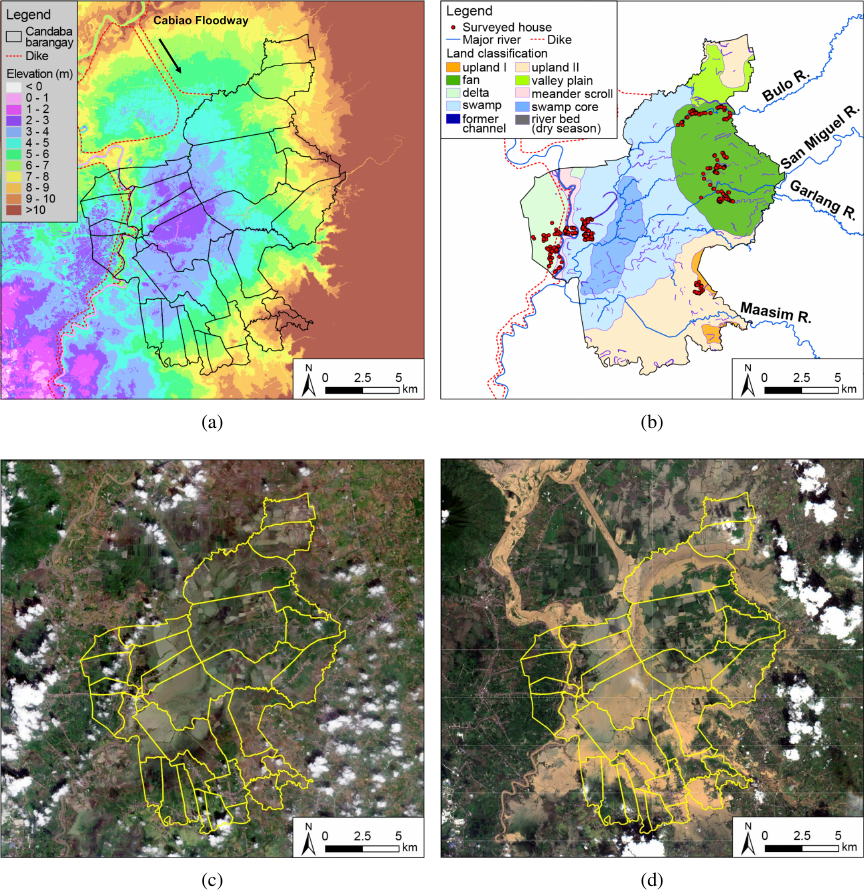
Fig. 4. Maps showing landform characteristics and flood situation in Candaba municipality. (a) Elevation map using ifSAR DEM by National Mapping and Resource Information Authority (NAMRIA); (b) land classification map; (c) Sentinel-2 satellite image taken on November 2, 2022; and (d) Sentinel-2 satellite image taken on November 13, 2020. Fig. 4(b) includes locations of houses for the interview survey.
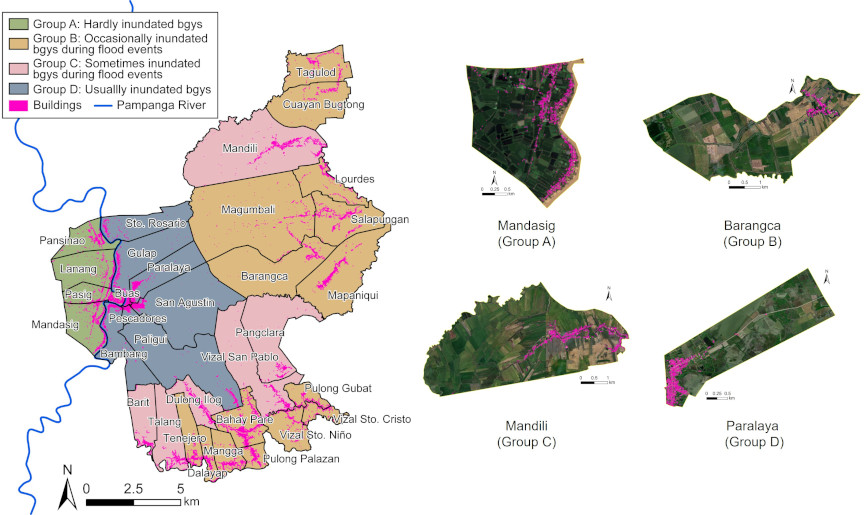
Fig. 5. Barangay classification map and enlarged maps of selected barangays with building distribution.
4.2. Flood Hazard Characteristics
Figure 4(c) shows inundation of the entire swamp core and adjacent areas classified as swamp. In more severe flooding, as shown in Fig. 4(d), inundation expands around the swamp core. This expansion results from inflow from the Pampanga River via the Cabiao Floodway, inflows from the eastern part of the municipality along tributary channels, and overflow from the Pampanga River north of Barangay Sto. Rosario.
When the tributary channels from the eastern part of the municipality overflow, higher landform surfaces such as upland II and the fan, which often act as pathways for floodwaters, are also inundated. However, because of their relatively higher elevations, most inundation in these areas is better interpreted as surface ponding, with shallower depths and shorter durations than those in the swamp core and swamp.
Although overflow from the Pampanga River occurred north of Barangay Sto. Rosario and contributed to flooding, the inundation area is limited, and no other significant flooding from the Pampanga River is observed on the left bank. In addition, no clear flood inundation is shown on the right bank of the Pampanga River. This indicates that severe flood inundation around Candaba Swamp is mainly due to floodwater inflow from eastern tributary rivers and the Cabiao Floodway, rather than major flooding from the Pampanga River itself.
Table 1. Characteristics of each barangay group.

4.3. Barangay Grouping
Based on the observations above, the barangays of Candaba municipality can be classified into four groups by flood hazard characteristics. As shown in the left map of Fig. 5 and in Table 1, Group A includes barangays that are hardly inundated, Group B includes those occasionally inundated during flood events, Group C includes those sometimes inundated during flood events, and Group D includes barangays that are usually inundated.
Group A consists of the barangays (Pansinao, Lanang, Pasig, and Mandasig), situated on the right bank of the Pampanga River. The area is primarily classified as delta, with elevations ranging from approximately 2 m to 5 m. During major flood events, only minor ponding is observed, and significant flood inundation is not expected.
Group B comprises the barangays (Tagulod, Cuayan Bugtong, Lordes, Magumbali, Salapungan, Barangca, Mapaniqui, Pulong Gubat, Vizal Sto. Cristo, Vizal Sto. Niño, Bahay Pare, Pulong Palazan, Mangga, Dalayap, and Tenejero), located in the eastern and southern parts of the municipality. Elevations in this group are generally above 3 m, with higher landform surfaces such as upland II and fan. During major flood events, flooding may result from tributary overflow or ponding, but inundation is typically shallow and of short duration.
Group C includes the barangays (Mandili, Pangclara, Viazal San Pablo, Dulong Ilog, Talang, and Barit) in the northern and southern parts of the municipality. Like Group B, the landform surfaces are primarily upland II and fan; however, elevations are lower, ranging from 3 m to 8 m, and these areas are closer to the swamp core, with some parts classified as swamp. During major flood events, these barangays are likely to be affected by the expansion of Candaba Swamp, as well as flood flows from tributaries and surface ponding.
Group D consists of barangays (Sto. Rosario, Gulap, Paralaya, Buas, San Agustin, Pescadores, Paligui, and Bambang) in the central part of the municipality. Most areas in this group are classified as swamp core and swamp, with elevations of 2 m to 4 m, and experience annual inundation during the rainy season due to the concentration of floodwaters from surrounding areas.
5. Residential Patterns by Barangay Group
5.1. Building Distribution
The map on the left of Fig. 5 shows building distribution 15 in Candaba municipality, while the maps on the right present enlarged views of representative barangays from each group. Each barangay group displays characteristic building distribution patterns that reflect the flood hazard level. These patterns can be broadly categorized as either linear or clustered, as summarized in Table 1.
In the barangays of Groups A, B, and C, buildings are primarily arranged along roads and channels, resulting in linear distribution patterns. In Barangay Mandasig (Group A), most buildings are situated along the major roads on the Setback Levee and Arnedo Dike. In Barangay Barangca (Group B), buildings are located along barangay roads and former river channels. In Barangay Mandili (Group C), buildings are mainly distributed along the Bulo River channel.
In Group A, serious flooding appears to be rare, so residents have likely chosen locations that are convenient for transportation, businesses, and water use. In Groups B and C, buildings are also located along roads and channels, which may be inundated during severe flood events, but they do not become completely submerged. In contrast, Group D shows both linear and clustered building patterns. In Barangay San Agustin, for example, buildings are concentrated in the western part of the barangay. Because most of the barangay area is within the Candaba Swamp and faces annual flooding, residents settle in the safest available areas, as far from the swamp as possible. As a result, clustered building patterns, which are not seen in the other groups, have formed. Additionally, in some Group D barangays, such as Gulap, buildings are distributed along the Pampanga River. This occurs because, even during major floods, the Pampanga River does not overflow in this area, and the riverbank has the highest elevation in the barangay, making it suitable for avoiding floods.
Table 2. Number of households surveyed.

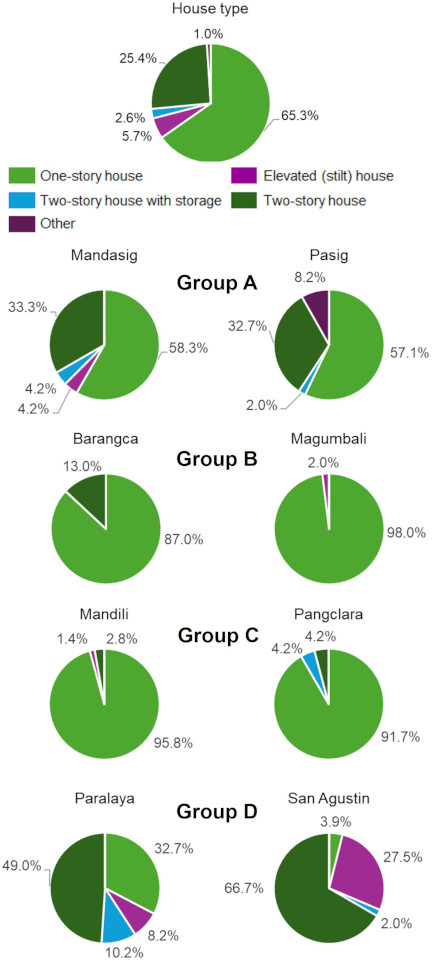
Fig. 6. Proportions of house structures in each group (\({N = 389}\)).
5.2. Housing Types and Structures
Based on interview surveys with households in representative barangays from each group, as listed in Table 2, Fig. 6 shows the proportions of house structures. The categories include one-story houses, elevated (stilt) houses, two-story houses with storage on the first floor, two-story houses, and others.
One-story houses are the most common in the surveyed barangays, representing 65.3% of total, followed by two-story houses at 25.4%. Elevated houses account for 5.7%, and two-story houses with storage make up 2.6%. In Group A, one-story houses are most prevalent, comprising 58.3% in Barangay Mandasig and 57.1% in Barangay Pasig. Two-story houses are the second most common type in both barangays, accounting for 33.3% in Barangay Mandasig and 32.7% in Barangay Pasig. In Groups B and C, most households also live in one-story houses.
Group D has a higher proportion of two-story houses than the other groups, with 66.7% in Barangay San Agustin and 49.0% in Barangay Paralaya, reflecting the flood-prone landform characteristics of these areas (Fig. 4). Elevated houses, which are rarely found in the other barangay groups, are also common in Barangay San Agustin, accounting for 27.5%. In Barangay Paralaya, only 8.2% of houses are elevated, while one-story houses make up 32.7% and two-story houses with first-floor storage account for 10.2%. Both one-story houses and two-story houses with first-floor storage are more common in Barangay Paralaya than in Barangay San Agustin.
Figure 7 presents the average floor height of living spaces above ground level for each house type among the surveyed households. Feet are used as the unit of measurement, consistent with local standards; one foot equals 0.3048 meters. One-story houses have the lowest average floor height at 1.96 ft, followed by two-story houses at 3.82 ft. Elevated houses and two-story houses with first-floor storage have significantly higher floor levels, at 7.41 ft and 8.30 ft, respectively.
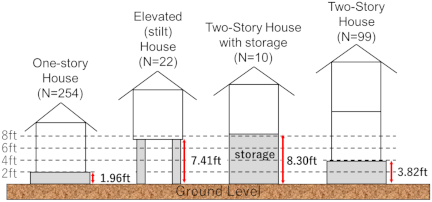
Fig. 7. Average floor height of living spaces (\({N = 389}\)).
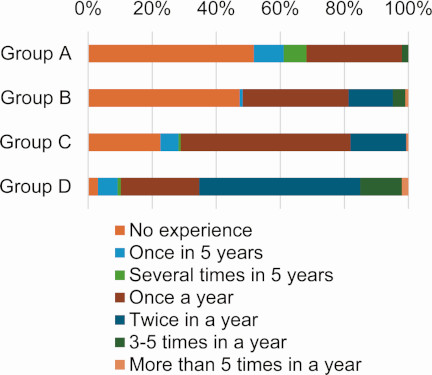
Fig. 8. Frequency of annual average flood experience at the household residences (\({N = 389}\)).
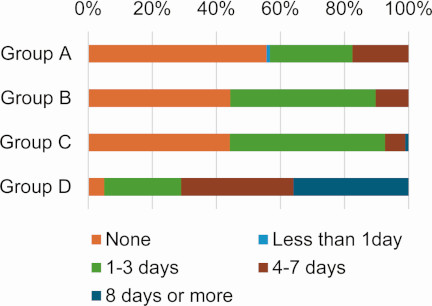
Fig. 9. Duration of flooding during the worst flood event in the last five years (\({N = 389}\)).
5.3. Household Flood Experience
Figure 8 presents the frequency of annual average flood experience at the household residences for each barangay group. The proportion of households that have experienced flooding is highest in Group D at 96.9%, followed by 77.5% in Group C, 52.7% in Group B, and 48.3% in Group A. Among the groups, Group D shows the highest frequency of flooding, with 89.8% of households experiencing flooding at least once per year. In contrast, the proportion is lowest in Group A at 31.9%. These results indicate that groups characterized by higher inundation levels tend to experience flooding more frequently.
Figure 9 presents the duration of flood inundation during the worst flood event in the last five years (from 2019 to 2024) at the household residences for each barangay group. Households in Group D experienced longer flood durations, with 24.0% inundated for one to three days, 35.0% for four to seven days, and 36.0% for eight days or more. These results show that 95% of households in Group D experienced flooding lasting at least one day. Additionally, households that experienced flooding for more than one week were almost all in Group D.
Figure 10 explains the maximum flood inundation height above ground level at the household residences during the worst flood event in the last five years (from 2019 to 2024) for each barangay group. Consistent with flood duration, households in Group D experienced higher maximum flood heights. Specifically, 71% of households in Group D experienced flooding of 4 ft or more. Additionally, 36% of households faced flood inundation of 8 ft or more. This height is comparable to or exceeds the average floor height of living spaces among all barangay groups shown in Fig. 7.
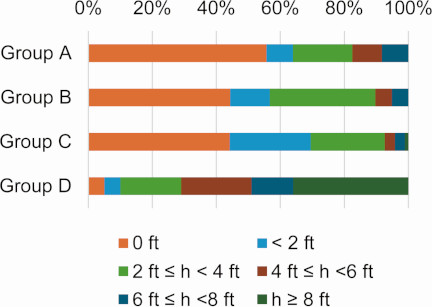
Fig. 10. Maximum flood inundation height above ground level during the worst flood event in the last five years (\({N =389}\)).
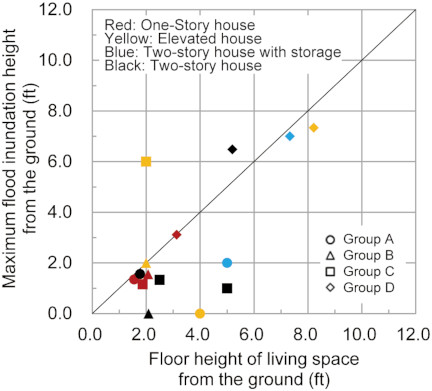
Fig. 11. Comparison between average floor height of living spaces and average maximum flood inundation height from the ground during the worst flood event in the last five years (\({N = 385}\)).
Figure 11 compares the average floor height of living spaces and the average maximum flood inundation height above ground level during the worst flood event at the household residences in the last five years (from 2019 to 2024) for each barangay group. In all house types, Group D has a higher average floor height of living spaces than the other groups, with elevated houses reaching the highest value at 8.2 ft. The flood inundation height in two-story houses reached 1.8 ft above the floor level, while in other house types it remained at or below the floor level. More than half of households in Group D live in two-story houses (Fig. 6), indicating that many likely experienced above-floor flooding during the worst flood event. For elevated houses in Group C, the flood inundation height also exceeds the floor height of living spaces, however, only a few households live in these houses (Fig. 6). These results show that, during the most severe flood events, households in Group D are at greater risk of above-floor flood inundation than those in the other barangay groups.
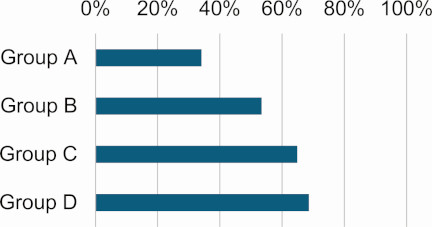
Fig. 12. Proportion of residents who have lived in their residences since birth (\({N = 389}\)).
6. Flood Hazard and Local Adaptation
Figure 12 presents the proportion of residents in each barangay group who have lived in their residences since birth. This proportion is high across all groups, with more than half of residents in Groups B, C, and D having lived in their houses for an extended period. Group D has the highest proportion at 69%.
Figure 13 shows the intention to relocate as a flood countermeasure in each barangay group if the maximum flood inundation height increases due to climate change. Despite their flood experiences and the flood hazard levels, the intention to relocate remains relatively low. The highest proportions of “Strongly Agree” or “Agree” responses are in Group A, at 41.8% and 3.6%, respectively, while these proportions are lower in Groups B, C, and D. These results indicate that residents are likely strongly attached to their barangay and remain unwilling to relocate, even if flood inundation height increases.
Figure 14 presents responses to whether flooding provides benefits for agriculture, fisheries, and daily life. In Groups A, B, and D, over 50% of households answered “Strongly Agree” or “Agree.” Group D, in particular, reported a high proportion at 78%. These results indicate that residents perceive the benefits of flooding outweighing the associated risks, which likely influences their decision to remain in the area.
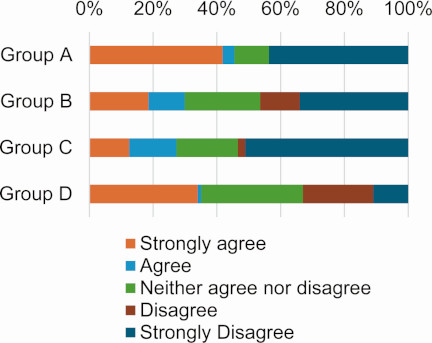
Fig. 13. Relocation intention under increased maximum flood inundation height (\({N = 340}\)).
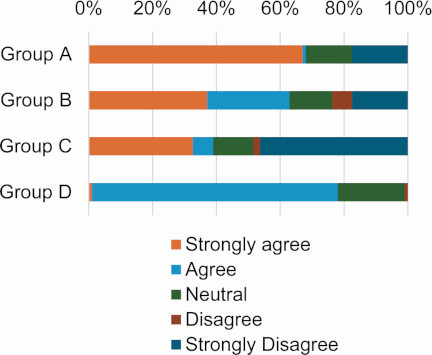
Fig. 14. Responses on the benefits of flooding for agriculture, fisheries, and daily life (\({N = 389}\)).
To reduce flood risk and increase benefits, residents around Candaba Swamp have adopted practices such as owning boats and temporarily living on the second floor during the rainy season 8. They also adjust their livelihoods by engaging in agriculture that aligns with the seasonal flooding cycle and by catching wild fish in the swamp when farming is not possible 16. In the future, changes in the amount of water accumulating in Candaba Swamp may affect the duration and depth of flooding. While it is important to respect the swamp’s ecological and hydrological functions, as well as the livelihoods and preferences of residents, it will soon be necessary to consider specific strategies to address these changes.
7. Conclusion
This study examined Candaba municipality, which includes most of the Candaba Swamp on Luzon Island, and analyzed flood hazard characteristics and local residential patterns at the community level using landform distribution, past flood records, and interview survey results. The major findings are as follows.
-
Analysis of the land classification map and satellite images of recent major floods showed that severe flooding in Candaba Swamp occurs mainly through tributary rivers from the east and the Cabiao Floodway, while the Pampanga River itself has relatively little direct effect. Based on these flood hazard characteristics, the barangays of Candaba municipality are classified into four groups.
-
Building distribution varied among groups based on flood hazard levels. In areas with the highest flood hazard, buildings are clustered in relatively safer locations. Housing types also differ: two-story and elevated houses are common in the highest flood hazard group, while one-story houses are more prevalent in the lowest flood hazard group. Additionally, floor heights of living spaces are higher in groups with greater flood hazard levels across all house types.
-
Even residents in areas with higher flood hazard levels often do not consider relocation as a response to increased flood inundation levels. Instead, they acknowledge potential benefits from flooding, and adopt adaptive practices and maintain their livelihoods by using the flooding. This enables many to remain in these environments for long periods.
Flood magnitude in Candaba Swamp may change because of climate change. Considering the flood hazard characteristics and local living practices described above, it is important to design and implement flood management strategies that maximize the swamp’s natural functions and minimize damage from unexpected floods.
Acknowledgments
This research was conducted as part of the project titled “Development of a Hybrid Water-Related Disaster Risk Assessment Technology for Sustainable Local Economic Development Policy under Climate Change,” supported by the Science and Technology Research Partnership for Sustainable Development (SATREPS (JPMJSA1909)), Japan Science and Technology Agency (JST), and Japan International Cooperation Agency (JICA). We thank Mr. Jomar Y. Guevarra of the Agricultural Office of Candaba municipality for his invaluable support in conducting this research.
- [1] United Nations Office for Disaster Risk Reduction (UNDRR), “Ecosystem-based disaster risk reduction,” United Nations, 2020.
- [2] U. Nehren et al., “Towards a typology of nature-based solutions for disaster risk reduction,” Nature-Based Solutions, Vol.3, Article No.100057, 2023. https://doi.org/10.1016/j.nbsj.2023.100057
- [3] P. Menéndez, I. J. Losada, S. Torres-Ortega, S. Narayan, and M. W. Beck, “The global flood protection benefits of mangroves,” Scientific Reports, Vol.10, Article No.4404, 2020. https://doi.org/10.1038/s41598-020-61136-6
- [4] T. Ichinose, J. Ishii, and I. Imoto, “The Watarase Retarding Basin—A historical example of ecosystem-based disaster risk reduction in Japan,” M. Mukherjee and R. Shaw (Eds.), “ Ecosystem-Based Disaster and Climate Resilience: Integration of Blue-Green Infrastructure in Sustainable Development,” pp. 441-464, Springer, 2021. https://doi.org/10.1007/978-981-16-4815-1_20
- [5] Y. Wu, J. Sun, B. Hu, G. Zhang, and A. N. Rousseau, “Wetland-based solutions against extreme flood and severe drought: Efficiency evaluation of risk mitigation,” Climate Risk Management, Vol.40, Article No.100505, 2023. https://doi.org/10.1016/j.crm.2023.100505
- [6] Forest and Natural Environment Group, Global Environment Department, Japan International Cooperation Agency (JICA), “Ecosystem-based disaster risk reduction (Eco-DRR), JICA’s Eco-DRR cooperation in developing countries.” https://www.jica.go.jp/english/our_work/thematic_issues/disaster/c8h0vm0000bvqtv9-att/Ecosystem-basedDisasterRiskReduction.pdf [Accessed October 25, 2025]
- [7] R. A. E. Acierto, T. Ushiyama, P. A. Jaranilla-Sanchez, and M. Ohara, “Downscaled climate projections for rainfall extremes and drought in Pampanga and Pasig-Marikina-Laguna basins,” J. Disaster Res., Vol.21, No.2, pp. 287-298, 2026. https://doi.org/10.20965/jdr.2026.p0287
- [8] N. Nagumo and H. Sawano, “Land classification and flood characteristics of the Pampanga River basin, central Luzon, Philippines,” J. of Geography, Vol.125, No.5, pp. 699-716, 2016. https://doi.org/10.5026/jgeography.125.699
- [9] M. A. Henson, “The Province of Pampanga and its towns (A.D. 1300–1962),” Angeles, Philippines, 1963.
- [10] Pampanga River Basin Flood Forcasting and Warning Center, “Pampanga River basin flood event: Typhoon Ulysses (international name: Vamco) November 10 to 17, 2020,” PRFFWC Post-Flood Report 2020, 2021.
- [11] National Disaster Risk Reduction and Management Council, The Philippines, “Sitrep No.29 re preparedness measures and effects for Typhoon ‘Ulysses’ (I.N. Vamco),” 2021.
- [12] Pampanga River Basin Flood Forcasting and Warning Center, “Pampanga River basin flood events: Tropical cyclone “Karding” (international name: Noru) flood watch coverage: September 24 to October 01, 2022; and Tropical cyclone “Paeng” (international name: Nalgae) flood watch coverage: October 28 to November 01, 2022,” PRFFWC Post-Flood Report 2022, 2023.
- [13] M. Oya, “Applied geomorphology for mitigation of natural hazards,” Springer, 2002.
- [14] Z. Pang et al., “Survey on flood impacts and countermeasures in Candaba Municipality, Pampanga Province, Republic of the Philippines,” Research Survey Reports in Information Studies, Interfaculty Initiative in Information Studies, The University of Tokyo, Vol.41, pp. 107-224, 2025 (in Japanese). https://doi.org/10.15083/0002013518
- [15] https://github.com/microsoft/IdMyPhBuildingFootprints [Accessed October 25, 2025]
- [16] A. M. Juarez-Lucas, K. M. Kibler, M. Ohara, and T. Sayama, “Benefits of flood-prone land use and the role of coping capacity, Candaba floodplains, Philippines,” Natural Hazards, Vol.84, No.3, pp. 2243-2264, 2016. https://doi.org/10.1007/s11069-016-2551-2
This article is published under a Creative Commons Attribution-NoDerivatives 4.0 Internationa License.