Survey Report:
Application of Satellite Data and Google Earth Engine for Flood Assessment in the HyDEPP Project
Kentaro Aida*1,*2,†
 , Miho Ohara*3, Naoko Nagumo*1, and Patricia Ann Jaranilla-Sanchez*4
*1International Centre for Water Hazard and Risk Management (ICHARM), Public Works Research Institute (PWRI)
1-6 Minamihara, Tsukuba, Ibaraki 305-8516, Japan
*2Earth Observation Research Center (EORC), Japan Aerospace Exploration Agency (JAXA)
Tsukuba, Japan
*3Institute of Industrial Science, The University of Tokyo
Tokyo, Japan
*4School of Environmental Science and Management, University of the Philippines Los Baños
Los Baños, Philippines
†Corresponding author

This study examines the effectiveness of freely available satellite data and the Google Earth Engine (GEE) platform for early flood detection and information sharing, within the constraints of the COVID-19 pandemic, which restricted field surveys. The case study focuses on Typhoon Ulysses in the Philippines in November 2020, covering three basins: the Cagayan, Pampanga, and the Pasig–Marikina–Laguna (PML) basins. Flooded areas were extracted from Sentinel-2 using the modified normalized difference water index (threshold =0.15) and Sentinel-1 synthetic aperture radar (SAR) using a VH (vertical transmit polarization and horizontal receive polarization) backscatter decrease of 5 dB. These were overlaid with WorldPop 100 m population data to estimate the “potentially affected population,” which was then compared with evacuee counts reported by the National Disaster Risk Reduction and Management Council. Satellite observations taken on the day after landfall enabled the detection of wide-area floods. The estimated affected populations differed from the actual evacuees (e.g., ∼10 times in Cagayan and around 70% in PML). The detection rate of evacuation occurrence was generally high (up to 100% with Sentinel-2), suggesting its value as an early warning indicator. Limitations were identified in detecting urban/under-canopy flooding, as well as uncertainty in population distribution estimates. The GEE-based web application integrated rainfall, track, and inundation data, facilitating rapid information sharing among international teams and demonstrating potential for monitoring during the recovery phase. Future improvements in population data accuracy and automated processing are expected to enhance support for administrative decision-making.
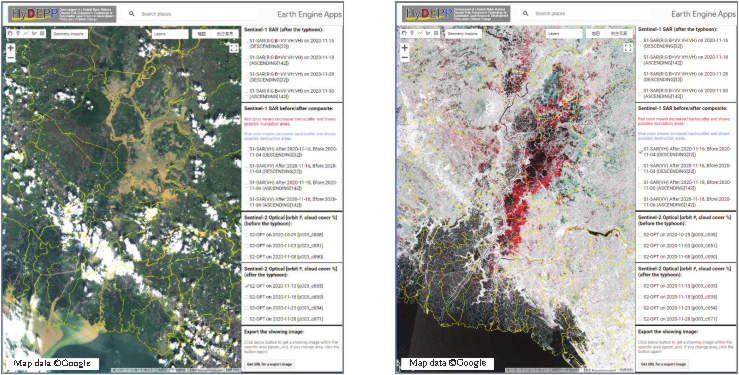
Flood map displayed in the GEE app
- [1] S. Hallegatte et al., “Unbreakable: Building the resilience of the poor in the face of natural disasters, Ch. 3,” World Bank, pp. 63–77, 2016.
- [2] CRED and UNDRR, “Human cost of disasters – An overview of the last 20 years: 2000–2019,” 2020. https://reliefweb.int/report/world/human-cost-disasters-overview-last-20-years-2000-2019 [Accessed Septembner 30, 2025]
- [3] B. Tellman et al., “Satellite imaging reveals increased proportion of population exposed to floods,” Nature, Vol.596, pp. 80–86, 2021. https://doi.org/10.1038/s41586-021-03695-w
- [4] N. Gorelick et al., “Google Earth Engine: Planetary-scale geospatial analysis for everyone,” Remote Sens. Environ., Vol.202, pp. 18–27, 2017. https://doi.org/10.1016/j.rse.2017.06.031
- [5] E. Hamidi et al., “Fast flood extent monitoring with SAR change detection using Google Earth Engine,” IEEE Trans. Geosci. Remote Sens., Vol.61, Article No.4201419, 2023. https://doi.org/10.1109/TGRS.2023.3240097
- [6] M. Ashhar et al., “Flood inundation mapping of a river stretch using machine learning algorithms in the Google Earth Engine environment,” J. Flood Risk Manag., Vol.18, No.2, Article No.e70062, 2025. https://doi.org/10.1111/jfr3.70062
- [7] G. Singh and K. S. Rawat, “Mapping flooded areas utilizing Google Earth Engine and open SAR data: A comprehensive approach for disaster response,” Discov. Geosci., Vol.2, No.1, Article No.5, 2024. https://doi.org/10.1007/s44288-024-00006-4
- [8] R. Johary et al., “Detection of large-scale floods using Google Earth Engine and Google Colab,” Remote Sens., Vol.15, No.22, Article No.5368, 2023. https://doi.org/10.3390/rs15225368
- [9] C. Li et al., “Increased flooded area and exposure in the White Volta River basin in Western Africa identified from multi-source remote sensing data,” Sci. Rep., Vol.12, No.1, Article No.1, 2022. https://doi.org/10.1038/s41598-022-07720-4
- [10] A. Smith et al., “New estimates of flood exposure in developing countries using high-resolution population data,” Nat. Commun., Vol.10, No.1, Article No.1, 2019. https://doi.org/10.1038/s41467-019-09282-y
- [11] NDRRMC, “Situational report re preparedness measures and effects for Typhoon ‘ULYSSES’,” https://ndrrmc.gov.ph/index.php/disaster-reports/20-incidents-monitored/4138-situational-report-re-preparedness-measures-and-effects-for-severe-tropical-storm-ulysses-i-n-vamco.html [Accessed May 31, 2022]
- [12] Japan Meteorol. Agency, “RSMC Tokyo – Typhoon Center, Best Track Data,” https://www.jma.go.jp/jma/jma-eng/jma-center/rsmc-hp-pub-eg/trackarchives.html [Accessed Feb. 2, 2026]
- [13] Japan Meteorol. Agency, “RSMC Best Track Data,” https://www.jma.go.jp/jma/jma-eng/jma-center/rsmc-hp-pub-eg/besttrack.html [Accessed February 2, 2026]
- [14] NII, “Digital Typhoon: Typhoon images and information,” http://agora.ex.nii.ac.jp/digital-typhoon/index.html.en [Accessed September 30, 2025]
- [15] T. Kubota et al., “Global Satellite Mapping of Precipitation (GSMaP) products in the GPM era,” in *Satellite Precipitation Measurement*, V. Levizzani et al., Eds., pp. 355–373, Springer, 2020. https://doi.org/10.1007/978-3-030-24568-9_20
- [16] ESA, “Copernicus Sentinel data,” 2015.
- [17] H. Xu, “Modification of normalised difference water index (NDWI) to enhance open water features in remotely sensed imagery,” Int. J. Remote Sens., Vol.27, No.14, pp. 3025–3033, 2006. https://doi.org/10.1080/01431160600589179
- [18] S. Long et al., “Flood extent mapping for Namibia using change detection and thresholding with SAR,” Environ. Res. Lett., Vol.9, No.3, Article No.035002, 2014. https://doi.org/10.1088/1748-9326/9/3/035002
- [19] Google Developers, “WorldPop global project population data: Earth Engine data catalog,” https://developers.google.com/earth-engine/datasets/catalog/WorldPop_GP_100m_pop_age_sex_cons_unadj [Accessed September 30, 2025]
- [20] NII, “Digital Typhoon: Typhoon images and information,” https://agora.ex.nii.ac.jp/digital-typhoon/index.html.en [Accessed February 2, 2026]
- [21] K. Aida et al., “Evaluations of satellite data analyses for the 2020 Typhoon Ulysses disaster in the Philippines,” J. JSCE Soc. Civ. Eng. Ser. B1 (Hydraul. Eng.), Vol.78, No.2, pp. I_985–I_990, 2022. https://doi.org/10.2208/jscejhe.78.2_I_985
- [22] UN-SPIDER, “Flood mapping and damage assessment using Sentinel-1 SAR data in Google Earth Engine,” https://un-spider.org/advisory-support/recommended-practices/recommended-practice-google-earth-engine-flood-mapping [Accessed tember 30, 2025]
This article is published under a Creative Commons Attribution-NoDerivatives 4.0 Internationa License.