
Paper:
Object Surface Identification Using Finger Vibration Information and Machine Learning in High-Precision Tracing Motion
Ryuichi Hodoshima
 , Tomohiro Uchida, Manabu Kasahara, Shinya Kotosaka, and Yoshihiro Tanaka
Department of Science and Mechanical Engineering, Saitama University
255 Shimo-Okubo, Sakura-ku, Saitama, Saitama 338-8570, Japan

This study proposes an object identification method that combines high-precision tracing motion by an industrial robot with vibration information obtained from a polyvinylidene fluoride (PVDF) film sensor mounted on the finger surface. In conventional tactile sensing technology, methods that place sensors on the contact surface face challenges such as reduced durability due to wear and limited design freedom for the finger surface. The proposed method overcomes these issues by exploiting vibration propagation to physically isolate the sensor from the contact point. In this paper, we first investigate how tracing speed and pressing depth affect the vibration spectrum based on the mechanism of vibration generation. We then verify, through fundamental experiments using sandpaper, how finger material influences vibration transmission characteristics. The results demonstrate that a lightweight resin finger is advantageous for acquiring high-frequency vibrations and that strict control of tracing speed is essential for ensuring identification accuracy. Based on these findings, we conducted identification experiments using wide-band vibration information from 0 Hz to 8,000 Hz as features. The experiments targeted 33 types of diverse objects selected from real-world environments according to onomatopoeic classification. Evaluation with a support vector machine achieved an extremely high identification rate exceeding 99% for both finely textured sandpaper and real-world objects under high-precision robot control. Furthermore, high identification rates were maintained even when the tracing position and pressing depth were varied randomly, demonstrating the effectiveness and robustness of the proposed method.
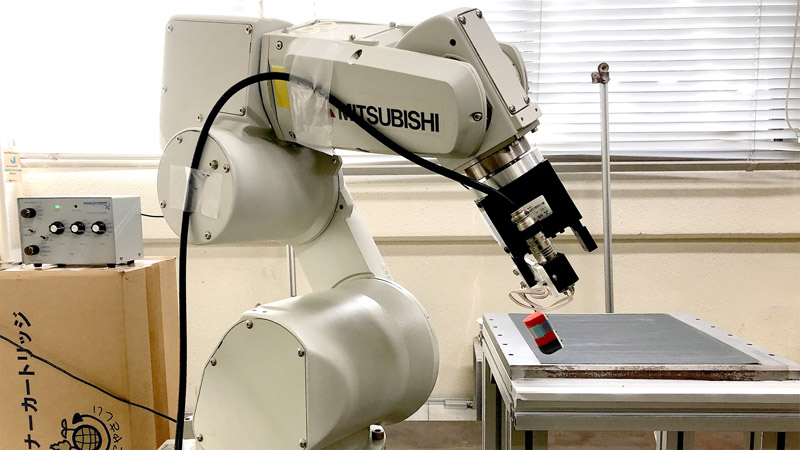
Robot-based surface identification
1. Introduction
1.1. Research Background
For robots to autonomously perform tasks in highly uncertain real-world environments, the ability to accurately recognize the state of objects and the surroundings is indispensable 1. Visual sensors such as cameras and LiDAR are widely used for external perception and have achieved significant results in object recognition and self-localization. However, visual information is susceptible to lighting variations, specular reflections, and occlusion. Furthermore, vision alone cannot directly measure physical properties such as material texture or friction characteristics. In contrast, tactile information enables the direct acquisition of a target’s physical properties through contact, making it an important modality for complementing vision and enhancing a robot’s environmental adaptability 2. In particular, recognizing the slipperiness and surface roughness of an object is essential for successful grasping and assembly tasks.
1.2. Challenges of Conventional Technologies
When humans perceive the material or surface state of an unknown object, they do not merely touch it but perform a tracing motion (Active Touch) with their fingertips 3,4. Perceptual psychology research has revealed that skin deformation and vibration generated by this tracing motion contribute significantly to the perception of roughness and texture.
According to the Duplex theory of roughness perception proposed by Hollins and Risner 5 and research by Bensmaïa and Hollins 6, high-frequency vibration information generated during tracing motion is essential for identifying fine textures beyond the limits of spatial resolution. In robotics, the development of tactile sensors based on these findings has advanced considerably. However, many conventional high-performance tactile sensors embed minute detection elements on the contact surface using MEMS technology or conductive rubber. Although such contact-surface sensors can acquire high-resolution information, they remain vulnerable to wear and damage caused by friction with objects, making durability assurance a serious issue in industrial applications 7. Furthermore, structures that cover the entire finger surface with sensors and wiring limit design freedom for grasping mechanisms and constrain gripper material selection 8.
1.3. Purpose and Approach of This Study
To address these issues, this study proposes a new object identification method that integrates internal vibration measurement with high-precision motion control.
First, the method places the sensor inside the finger at its base, exploiting vibration propagation to physically isolate it from the contact point. This approach avoids sensor wear in principle, achieving both high durability and design freedom for the finger. Second, the method introduces high-precision tracing motion by exploiting the precise positioning capability of industrial robots. Measuring vibration inside the finger has disadvantages compared to direct measurement at the contact surface; signal attenuation occurs, and fluctuations in motion speed or contact force are superimposed as noise. To address these challenges, we strictly control motion parameters such as speed, pressing depth, and angle to maximize the signal-to-noise ratio (SNR) and realize high-precision identification through machine learning. The concept and parameterization of the tracing motion used in this study are summarized in Fig. 1.
The remainder of this paper is organized as follows. Section 2 reviews related research. Section 3 describes the theoretical background of the proposed method, including the vibration generation model, contact mechanics model, sensor principle, and machine learning algorithm. Section 4 verifies, through fundamental experiments using sandpaper, the influence of finger material properties and motion parameters. Section 5 evaluates the effectiveness of the method through identification experiments using diverse objects in a real environment. Section 6 provides a discussion, and Section 7 concludes the paper.
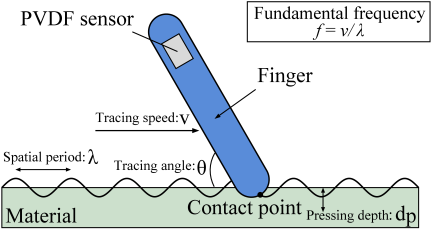
Fig. 1. Concept of the tracing motion defined in this study and its control parameters (tracing speed \(v\), pressing depth \(d_{p}\), tracing angle \(\theta\), and surface spatial period \(\lambda\); \(f = v/\lambda\)).
3. Theoretical Background and Proposed Method
This section models the physical phenomena in tracing motion and, on this basis, presents the theoretical foundation for the proposed system configuration and algorithm.
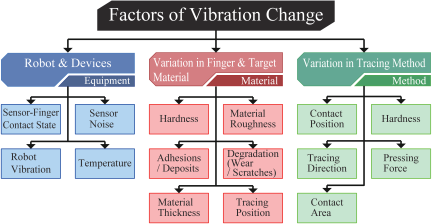
Fig. 2. Hierarchical organization of the factors influencing the measured vibration signal during robotic surface tracing. Equipment, method, and material are shown as parallel top-level factors, each connected to an intermediate factor group and its corresponding sub-factors.
3.1. Geometric Model of Vibration Generation and Definition of High-Precision Tracing
Vibration generated at the fingertip during tracing motion arises from the interaction between the microscopic surface geometry of the object and the movement of the finger (Fig. 1).
Figure 1 illustrates the geometric model of tracing motion defined in this study. The robot fingertip moves with a velocity vector \(v\) while maintaining a constant angle (tracing angle) and pressing depth relative to the object surface. The factors that influence the measured vibration signal, including equipment-related and method-related variations, are summarized separately in Fig. 2. Assuming the object surface has a sinusoidal profile with spatial period \(\lambda\) [m], the fundamental frequency \(f\) [Hz] of the generated vibration is given by:
This equation indicates that tracing speed is the primary factor determining vibration frequency. For example, when tracing sandpaper (#320), which has an average particle diameter of approximately 46 μm, at a speed of 50 mm/s, the theoretical dominant frequency is calculated as follows:
This estimate represents an idealized upper bound based on a sinusoidal surface model with spatial period equal to the particle diameter. As discussed in Section 4.3, the experimentally observed dominant frequency is lower because the effective spatial period of real abrasive surfaces exceeds the nominal particle diameter. As illustrated in Fig. 1, actual object surfaces possess random textures containing various spatial frequency components rather than a single periodic structure, and the relationship expressed by Eq. \(\eqref{eq:eq1}\) holds for each component. Therefore, if the tracing speed \(v\) fluctuates, the entire observed power spectral density (PSD) scales along the frequency axis. This scaling causes the same object to appear as completely different features in pattern recognition using machine learning. Consequently, high-precision tracing motion that maintains constant velocity is theoretically essential for achieving accurate identification.
3.2. Contact Mechanics and Spatial Filtering Effect
The contact state between the fingertip and the object affects both the excitation efficiency and the frequency characteristics of vibration. According to Hertzian contact theory, when an elastic sphere (fingertip) of radius \(R\) is pressed against a flat surface (object) with load \(F\), the radius \(a\) of the contact circle follows the proportional relationship:
The contact area (\(\pi a^2\)) acts as a spatial low-pass filter for surface irregularities. Surface features with wavelengths sufficiently smaller than the contact region are averaged out and become difficult to excite as vibration. However, as Eq. \(\eqref{eq:eq2}\) shows, the contact radius is proportional to the cube root of load \(F\), so the rate of change in contact area relative to load variation is relatively gradual. This implies that while speed fluctuation has a linear effect on frequency, load fluctuation has a comparatively small effect on spectral shape. In this study, we hypothesize that this mechanical characteristic contributes to recognition robustness.
3.3. Experimental System Configuration and PVDF Sensor Implementation
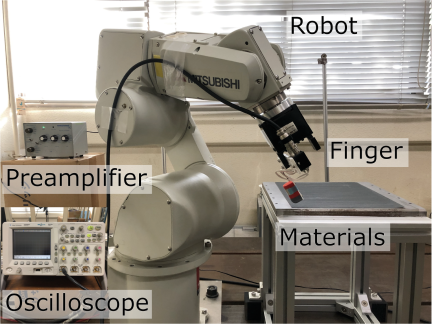
Fig. 3. Overview of the automated measurement system for vibration-based surface identification.
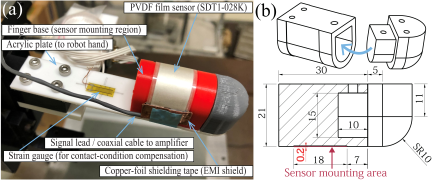
Fig. 4. Instrumented finger and PVDF sensor mounting. (a) Labeled photograph indicating the PVDF film sensor (SDT1-028K), copper-foil shielding tape, finger base, acrylic plate, signal lead/coaxial cable, and strain gauge. (b) Dimensional schematic of the finger and sensor element; all dimensions are in millimeters.
Figure 3 shows the overall configuration of the experimental system constructed in this study. The system consists of a vertical articulated robot (Mitsubishi Electric RV-3SD), a custom-built artificial finger, a data acquisition system, and an analysis PC. The RV-3SD has a positioning repeatability of \(\pm\)0.02 mm, which enables high-precision reproduction of commanded trajectories in terms of speed and pressing depth. Because the manufacturer’s datasheet does not specify a speed-accuracy index, we quantified the accuracy of the executed tracing speed independently by logging the tool-center-point (TCP) position during constant-velocity motion and computing the instantaneous TCP speed via forward kinematics. Under the baseline tracing-speed command of 50 mm/s used in this study, the measured coefficient of variation was approximately 1%–2% and the maximum deviation from the commanded speed was also approximately 1%–2% (\(N = 10\) repeated trials). According to Eq. \(\eqref{eq:eq1}\), this level of speed variation limits the frequency-axis shift to approximately 1%–2%, which is sufficiently small for PSD-based feature extraction. Fig. 4 shows the sensor implementation at the finger base.
For vibration detection, this study employs a polyvinylidene fluoride (PVDF) film sensor (TE Connectivity SDT1-028K). PVDF is a ferroelectric polymer that generates electric charge in response to mechanical strain due to its strong piezoelectric properties. The sensor dimensions, mounting position, and finger geometry are shown quantitatively in Fig. 4. As shown in Fig. 4(a), the PVDF sensor is bonded along the curved surface of the finger base, and copper-foil tape is applied over a portion of the sensor mounting region as an EMI shield and connected to ground to reduce external electromagnetic noise.
The finger is mounted on the robot hand via an acrylic plate whose compliance maintains constant contact with the object surface. Because objects of different thicknesses produce different contact forces even at the same commanded fingertip position, a strain gauge is bonded to the acrylic plate to continuously measure its strain. During tracing motion, the vertical displacement of the fingertip is adjusted so that the strain gauge reading remains constant, thereby ensuring a uniform contact condition across objects of different thicknesses.
Based on the piezoelectric constitutive equation (charge form), the electric flux density \(D\) generated in the PVDF film is expressed by stress \(T\) and electric field \(E_\textrm{field}\) as:
Here, \(d_{31}\) is the piezoelectric constant (approximately 23 pC/N), and \(\epsilon^T\) is the permittivity at constant stress. In this study, the PVDF electrodes are connected to a charge amplifier. Because the amplifier input is maintained at virtual ground, \(E_\textrm{field} \approx 0\) holds, and thus \(D \approx d_{31}T\). The generated charge is \(Q = AD\) (where \(A\) is the electrode area), and the charge amplifier converts it to the measured output voltage as:
This study selected the PVDF sensor for the following three reasons:
-
Wideband frequency response: Piezoelectric polymers have extremely low mass and consequently a high mechanical resonant frequency, providing flat detection characteristics from several Hz to kHz range relevant to tactile vibration sensing 13. This property is essential for detecting high-frequency vibrations (several kHz) derived from fine textures 13,16.
-
Flexibility: The film form enables placement along the curved shape of the finger, as shown in Fig. 4, ensuring intimate contact with the vibration propagation path 16,17.
-
High sensitivity: The piezoelectric voltage constant is larger than that of ceramic piezoelectric materials such as PZT, enabling detection of minute mechanical displacements as large voltage signals 13.
3.4. Vibration Transmission Characteristics and Finger Material Selection
Vibration generated at the contact point propagates through the finger structure to the base sensor. Modeling the finger–sensor path as a one-degree-of-freedom vibration system with equivalent mass \(m\), spring constant \(k\), and damping coefficient \(c\), the natural frequency \(f_{n}\) is given by:
This equation shows that the larger the equivalent mass \(m\) of the finger, the lower the natural frequency \(f_{n}\). For input frequencies above the natural frequency, the amplitude response drops at \(-\)40 dB/dec due to inertia, causing the finger itself to function as a mechanical low-pass filter. Transmitting high-frequency vibrations of the order of several kHz to the sensor without attenuation requires minimizing finger mass \(m\) to raise the natural frequency \(f_{n}\). In addition to the inertia effect, internal material damping also plays a non-negligible role. PLA resin absorbs more vibration energy than metal during propagation through the finger structure, which attenuates the signal amplitude. A metal finger, with its higher rigidity and lower internal damping, can in principle transmit vibration components to higher frequencies. However, as confirmed in Section 4.3, the high-frequency components that a metal finger transmits are not necessarily useful for identification because the finger’s large mass severely reduces the overall signal gain in the frequency band relevant to texture discrimination. Therefore, minimizing finger mass to ensure sufficient signal gain in the identification-relevant band is more effective than pursuing a wider transmission bandwidth through high rigidity.
Based on this analysis, this study adopts lightweight PLA resin with moderate rigidity instead of a conventional metal finger.
3.5. Machine Learning Classifier Implementation
Figure 5 shows the signal processing flow for identifying objects from the acquired vibration signals.
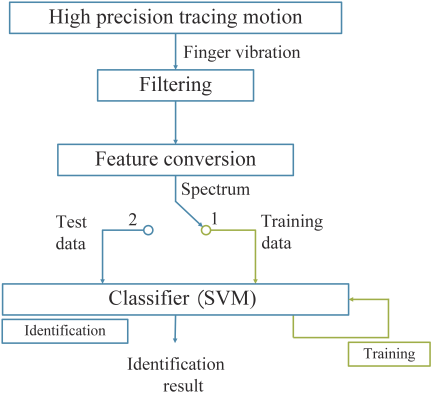
Fig. 5. Signal-processing and classification pipeline for vibration-based surface identification.
As shown in Fig. 5, the raw signal from the sensor is converted to voltage and amplified by a charge amplifier with the gain set to 30 dB, then digitized by an A/D converter at a sampling frequency of 40 kHz. A 10 kHz low-pass filter is then applied as preprocessing to remove aliasing noise. The amplifier gain was kept constant for all experiments reported in this paper, ensuring that relative comparisons of spectral features across different conditions and objects are unaffected by amplifier settings. Subsequently, data are extracted from the steady-state interval, excluding the transient response at the start and end of tracing motion, and the PSD is calculated using Welch’s method. Welch’s method reduces the variance of spectral estimation by dividing the signal into overlapping segments, applying a window function such as a Hanning window to each segment, and performing FFT. Finally, the PSD undergoes logarithmic transformation (dB) and is input into a support vector machine (SVM) as a feature vector.
This study adopted an SVM as the classifier for its high generalization performance and implementation reliability 22,23. The three main reasons for selecting SVM are as follows:
-
Suitability for high-dimensional data: SVM demonstrates high identification performance while suppressing overfitting, even for high-dimensional features such as spectral data 22,23.
-
Robustness to outliers: The margin maximization principle forms the decision boundary using only a subset of data points called support vectors, reducing susceptibility to noisy data 22,23.
-
Implementation convenience: SVM is supported as standard in machine learning libraries, enabling highly reproducible implementation 24.
The classifier was implemented using scikit-learn 24, an open-source machine learning library in Python. The identification model was constructed using the standard support vector classification class svm.SVC provided by the library. For data splitting, the dataset was divided by trial units of tracing motion rather than by simply segmenting time-series data. This approach prevents data leakage due to correlations within the same motion and ensures reliable evaluation of generalization performance.
4. Fundamental Experiments: Verification Using Sandpaper
This section verifies both the validity of the theoretical model described in the previous section and the fundamental characteristics of the system configuration, using sandpaper with standardized surface properties.
4.1. Experimental Setup and Conditions
The finger was fabricated using a 3D printer with PLA resin (density approx. \(1.25~\textrm{g/cm}^3\)). The finger is a cylinder 60 mm in length and 15 mm in diameter, with a hemispherical tip having a radius of curvature of 10 mm. Fig. 6 shows the experimental setup using sandpaper.
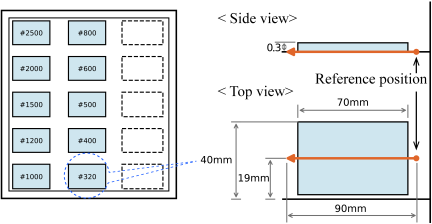
Fig. 6. Arrangement of the sandpaper specimens, programmed tracing path, and definition of the reference position used in the sandpaper-identification experiments.
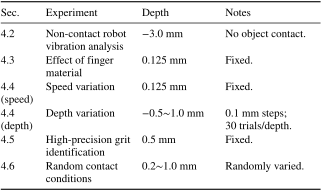
As shown in Fig. 6, the target sandpaper is placed on an experimental table constructed from aluminum frames. The sandpaper is secured with a magnetic sheet, allowing easy replacement and repositioning to accommodate the robot’s motion range. Ten types of sandpaper conforming to JIS R6010 were prepared: #320, #400, #500, #600, #800, #1000, #1200, #1500, #2000, and #2500. The average particle diameter ranges from approximately 46 μm for #320 to approximately 8 μm for #2500; this range provides a suitable metric for evaluating tactile identification resolution. For each grit number, 240 tracing motions were performed, with 150 used for training and 90 for testing (Table 1). The reference position, defined as the point where the fingertip first contacts the object surface, is explicitly shown in Fig. 6. The pressing depth is defined as the vertical displacement from this reference position; positive values indicate indentation into the surface, and negative values indicate a gap between the fingertip and the surface. Because the pressing depth varied across experiments, the specific values used in each experiment are summarized in Table 2. In this study, the absolute normal force was not directly measured; instead, the contact condition was regulated indirectly by controlling the indentation depth from the strain-gauge-detected reference position, as summarized in Table 2. This position-based approach was adopted to exploit the standard high-precision position control of the industrial robot without requiring a separate force-control loop.
Table 1. Experimental conditions for the sandpaper-grit identification experiments.
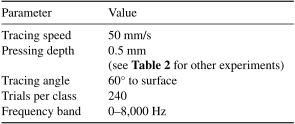
Table 2. Pressing depth conditions for each experiment. Note: The contact condition was specified by the commanded pressing depth from the strain-gauge-detected reference position; absolute pressing force in newtons was not directly measured.
4.2. Preliminary Experiment 1: Robot Vibration Analysis via Non-Contact Tracing
Before evaluating contact vibration with objects, it is necessary to characterize the mechanical noise generated by the robot itself. Industrial robots incorporate multiple servo motors and reducers (gears) that generate mechanical vibrations during operation. To investigate noise components originating from the robot, we performed non-contact tracing motions without touching any object.
Analysis of the PVDF sensor output while operating the arm at 15 different positions within the workspace revealed slight fluctuations in the low-frequency region (below 100 Hz) associated with changes in arm posture. We attribute this to variations in the moment of inertia caused by posture changes and the resulting load fluctuations on the servo motors. However, fluctuations in spectral components in the high-frequency band (500 Hz and above), which serves as the primary information source for texture identification in this study, were extremely small (coefficient of variation less than 5%). This result confirms that changes in high-frequency vibration observed in subsequent experiments arise purely from contact phenomena with objects, not from robot drive noise.
4.3. Preliminary Experiment 2: Effect of Finger Material on Frequency Response
To verify the effect of finger material on vibration transmission characteristics, we compared the PSD of the PVDF sensor output during sandpaper tracing using a metal finger (aluminum/stainless steel composite, 464 g) and a resin finger (PLA, 8 g) of identical shape. Regarding the fingertip surface condition, the metal finger was a machined aluminum part with a surface roughness \(R_a\) of 3.2 μm, whereas the PLA finger was fabricated by fused deposition modeling (FDM) with a layer pitch of 0.127 mm. No additional polishing or intentional surface texturing was applied to either finger after fabrication. Thus, the metal finger is characterized by its measured roughness value (\(R_a\)), whereas the PLA finger is characterized by its fabrication condition (FDM layer pitch), which determines the effective surface texture.
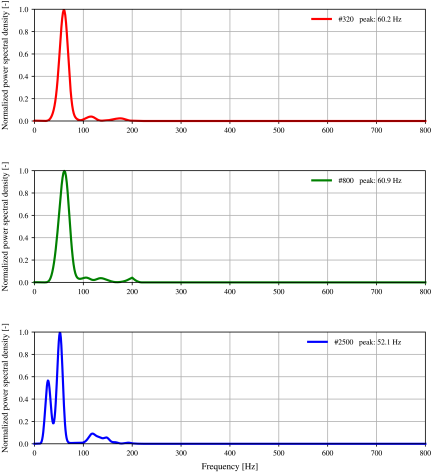
Fig. 7. Vibration spectra (PSD) during sandpaper tracing with the metal finger (aluminum/stainless steel composite, 464 g) for grit numbers #320, #800, and #2500. Tracing speed: 50 mm/s. The PSD in each subplot is normalized by its maximum value.
Figures 7 and 8 show the PSD for three representative grit numbers (#320, #800, #2500) at a tracing speed of 50 mm/s. In Fig. 7, the metal finger exhibits a dominant peak near 60 Hz for all grit numbers, and the response in the high-frequency band above several hundred Hz is essentially zero. The peak position remains unchanged regardless of grit number, while the PSD magnitude decreases by approximately two orders of magnitude from #320 (order of \(10^{-3}\) V\(^{2}\)/Hz) to #2500 (order of \(10^{-5}\) V\(^{2}\)/Hz). These observations indicate that the 60 Hz component originates from the mechanical resonance of the heavy finger structure rather than from surface texture. As predicted by Eq. (5), the large mass of the metal finger lowers its natural frequency, causing the finger to function as a mechanical low-pass filter that attenuates texture-derived vibration components.
In contrast, Fig. 8 shows that the PLA resin finger produces distinct spectral peaks whose positions shift with grit number: 330 Hz for #320, 390 Hz for #800, and 426 Hz for #2500. As the grit number increases and the particle spacing \(\lambda\) decreases, the peak frequency rises monotonically. This trend is qualitatively consistent with the relationship \(f = v/\lambda\) expressed in Eq. \(\eqref{eq:eq1}\) and confirms that the PLA resin finger successfully transmits texture-derived vibration to the sensor.
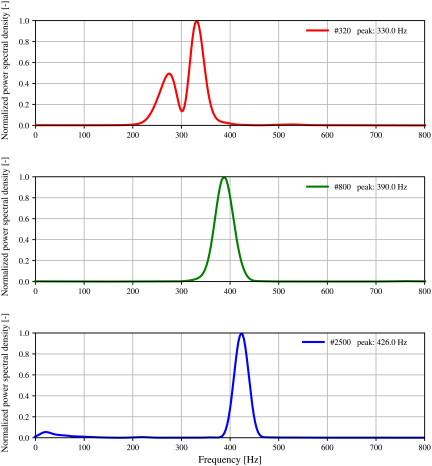
Fig. 8. Vibration spectra (PSD) during sandpaper tracing with the PLA resin finger (8 g) for grit numbers #320, #800, and #2500. Tracing speed: 50 mm/s. The PSD in each subplot is normalized by its maximum value.
However, the observed peak frequencies are lower than the values predicted by substituting the nominal average particle diameter into Eq. \(\eqref{eq:eq1}\). For example, #320 sandpaper has a nominal particle diameter of approximately 46 μm, which yields a theoretical frequency of 1,087 Hz at 50 mm/s, whereas the observed peak is 330 Hz. This corresponds to an effective spatial period of approximately 152 μm, roughly 3.3 times the nominal particle diameter. The discrepancy arises because Eq. \(\eqref{eq:eq1}\) assumes a simple sinusoidal surface profile with spatial period equal to the particle diameter, whereas real coated abrasives have random multi-grain surface structures whose dominant spatial wavelength exceeds the individual grain size. Despite this quantitative discrepancy, the monotonic increase in peak frequency with decreasing particle size confirms that the fundamental physical relationship between tracing speed and vibration frequency holds.
Scheibert et al. noted that microstructures such as fingerprints and material properties play an important role in coding tactile information 25. Consistent with this finding, the results in Figs. 7 and 8 demonstrate that lightweight finger materials are physically superior for acquiring texture-derived high-frequency vibration information, supporting the validity of this system’s design guidelines. The significant difference between the two finger materials also underscores the importance of minimizing finger mass to raise the natural frequency, as discussed in Section 3.4.
4.4. Effect of Motion Parameter Variations on Vibration Spectrum
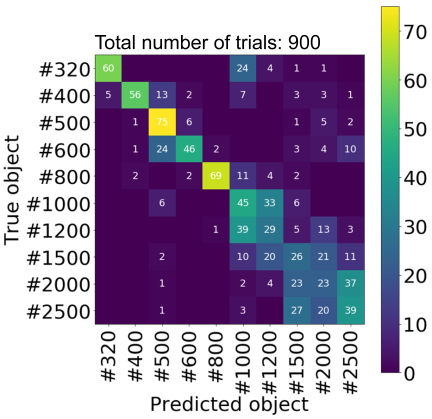
Fig. 9. Confusion matrix for sandpaper-grit identification with randomized tracing speed. The vertical axis indicates the true traced object, the horizontal axis indicates the classifier prediction, and the numbers in the cells denote counts. The mean identification accuracy under this condition was 52.0%.
Based on the theoretical models described in Sections 3.1 and 3.2, we verified the effect of motion parameter variations on identification. First, we randomly varied the tracing speed \(v\) within the range of 30 mm/s to 80 mm/s. Fig. 9 shows the resulting confusion matrix. In this matrix, the vertical axis represents the true traced object, and the horizontal axis represents the object predicted by the classifier. The white numbers in each cell indicate the count of classification results, and the cell color corresponds to that count according to the color bar on the right. Cells near the diagonal with colors close to the upper end (yellow) of the color bar indicate a high number of correct classifications. A classification was regarded as correct when the classifier prediction matched the actually traced object, and the identification rate was defined as the number of correct classifications divided by the total number of samples. Under this speed-variation condition, the mean identification rate decreased to 52.0%. This decline occurs because velocity variations cause the entire spectrum to expand and contract along the frequency axis, as predicted by Eq. \(\eqref{eq:eq1}\) (\(f=v/\lambda\)) and consistent with the grit-dependent peak shifts observed in Fig. 8, resulting in overlapping class distributions in the feature space.
In contrast, when the pressing depth was varied from \(-\)0.5 mm to 1.0 mm in increments of 0.1 mm, with 30 trials at each depth (see Table 2), the identification rate was 87.1% as shown in Fig. 10, indicating a less pronounced effect than speed variation. Note that the absolute pressing force was not directly measured with a force sensor; the normal contact condition was regulated indirectly by controlling the indentation depth from the strain-gauge-detected reference position, as described in Section 3.3. Because the contact force changes with indentation depth through the compliance of the finger and object, this experiment effectively evaluated the influence of contact force variation on identification accuracy. This result can be interpreted as follows: when the pressing depth changes, the contact area and the resulting vibration amplitude change, but the dominant peak position in the PSD remains essentially unchanged because it is determined by the ratio of tracing speed to surface spatial period (Eq. \(\eqref{eq:eq1}\): \(f = v/\lambda\)), not by contact force. That is, varying the pressing depth scales the spectral magnitude (power) without shifting the peaks along the frequency axis. Since the SVM classifier relies on the overall spectral shape, changes in power level alone are less disruptive to class separation than the frequency-axis shifts caused by speed variation. The effect of contact area variation (which changes with the effective normal load according to Hertzian contact theory, \(a \propto F^{1/3}\)) on spectral shape is limited compared to the frequency shift caused by velocity changes. These results confirm that maintaining constant tracing speed is critically important for identification based on vibration information.
4.5. Sandpaper Identification with High-Precision Tracing
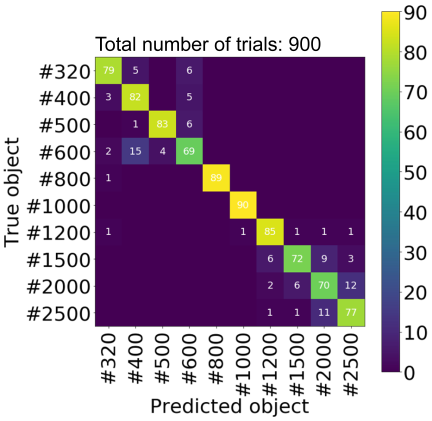
Fig. 10. Confusion matrix for sandpaper-grit identification with varied pressing depth. Mean accuracy: 87.1%.
Based on the findings from the preceding sections, we conducted identification experiments on 10 types of sandpaper with motion parameters (speed 50 mm/s, pressing depth 0.5 mm; see Table 2) strictly controlled by the robot. Fig. 11 shows the resulting confusion matrix.
The diagonal elements in Fig. 11 demonstrate that the system achieved an extremely high average identification rate of 99.1%. Misclassifications (off-diagonal elements) occurred only between adjacent grit numbers with particle diameter differences of just a few micrometers, such as #2000 and #2500. This result indicates that under high-precision motion control, the system can detect microscopic differences in surface properties with extremely high resolution.
4.6. Verification of Robustness: Identification Under Random Contact Conditions
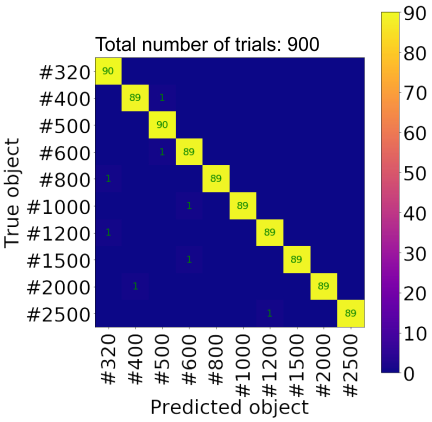
Fig. 11. Confusion matrix for sandpaper-grit identification under high-precision tracing conditions. Mean accuracy: 99.1%.
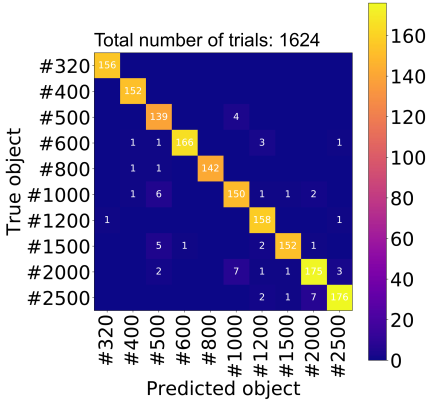
Fig. 12. Confusion matrix for sandpaper-grit identification with randomized pressing depth and tracing start position. The numbers in the cells denote counts of classification results (not percentages); values exceed 100 because of the larger number of test samples per class in this experiment. Mean identification accuracy: 95.6%.
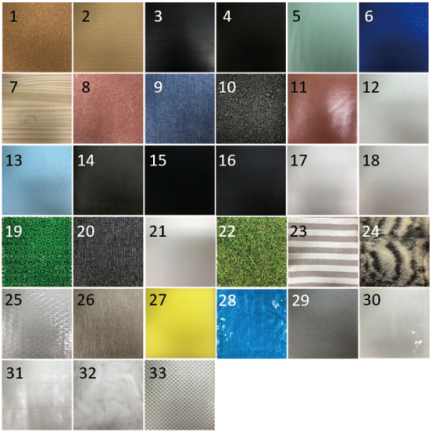
Fig. 13. Photographs of the 33 objects used in the diverse-object identification experiment; the photograph numbers correspond directly to the entries in Table 3.
To simulate real-world applications, we performed training and evaluation using a dataset in which the tracing position and pressing depth (0.2–1.0 mm) were randomly varied. In this experiment, we traced arbitrary locations on sandpaper sheets of approximately \(280 \times 230\) mm, rather than using the fixed test pieces from previous experiments. A total of 6,495 tracing motions were performed, of which 5,196 samples were used for training and 1,299 samples were used for testing. The tracing direction and speed remained constant across all trials. Fig. 12 shows the resulting confusion matrix, where, as in all confusion matrices in this paper, the numbers in the cells denote counts of classification results, not percentages. Because the test dataset under random contact conditions contains more samples per class than the fixed-condition experiments in Sections 4.4 and 4.5 (where each class had 90 test samples), some cell values exceed 100.
The system maintained a high identification rate of 95.6% even when contact conditions such as starting position and pressing depth were varied. Section 4.4 demonstrated that inputting data acquired under different conditions into a model trained under specific conditions reduces accuracy. However, the results in this section show that including diverse contact states in the training data enables the SVM to learn robust decision boundaries. This characteristic is critically important when strict positioning is difficult and for active sensing applications.
5. Application to Diverse Real-World Objects and Evaluation
Having confirmed the system’s effectiveness through sandpaper experiments, we evaluated its performance on real-world objects with more complex characteristics.
5.1. Selection of Identification Targets
Given the vast variety of objects in real environments, systematic evaluation requires clear selection criteria. In this study, we selected 33 objects to cover representative tactile categories based on the onomatopoeia-based tactile classification proposed by Hayakawa et al. 26. Fig. 13 shows the appearance of the selected objects; the photograph numbers correspond directly to the entries in Table 3, which lists them with their corresponding onomatopoeic descriptors.
Table 3. Test objects shown in Fig. 13, listed according to the photograph numbers, with their corresponding onomatopoeia categories (Ono.).
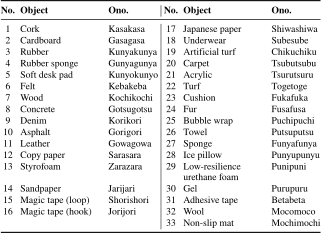
The selected objects include hard and smooth materials (acrylic, wood, concrete), fibrous materials (denim, towel, felt), porous materials (sponge, cork), and materials with special textures (artificial turf, cardboard). These objects exhibit wide diversity in physical properties such as hardness, roughness, friction coefficient, and thermal conductivity, providing a comprehensive dataset for evaluating the system’s versatility.
5.2. Experimental Conditions
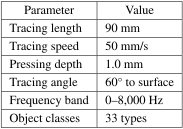
We performed 1,000 tracing motions for each object, yielding a large-scale dataset of 33,000 samples. Of these, 26,400 samples (800 per object) were used for training and 6,600 samples (200 per object) were used for testing. Table 4 summarizes the tracing conditions.
Table 4. Experimental conditions for the 33-object identification experiments.
5.3. Results and Analysis
The identification experiment achieved an extremely high average identification rate of 99.3% (standard deviation 0.4%) despite involving 33-class classification. Fig. 14 shows the resulting confusion matrix. The axis labels M1–M33 are material IDs corresponding to the object numbers in Table 3.
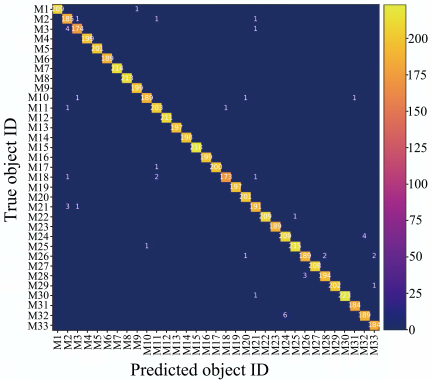
Fig. 14. Confusion matrix for the 33-object identification experiment. Mean accuracy: 99.3%. The axis labels M1–M33 denote material IDs corresponding to the object numbers listed in Table 3 and the photograph numbers in Fig. 13.
In Fig. 14, high values are concentrated along the diagonal, indicating that most objects were accurately classified. Detailed analysis yielded the following findings:
-
Identification of hard materials: Hard materials such as acrylic, wood, and concrete achieved 100% identification rates. Although their smooth surfaces produce low vibration levels, minute differences in friction characteristics and stick-slip phenomena appear as distinctive spectral features.
-
Separation of similar tactile sensations: The system successfully distinguished between materials that humans perceive as tactilely similar (with close onomatopoeic classifications), such as cork and cardboard. This is presumably because wide-band spectral analysis captures subtle features below the human perception threshold.
-
Challenges with flexible materials: Slight misclassification (identification rates of 97%–98%) occurred between flexible materials such as felt and sponge. Material deformation likely prevented the contact geometry from stabilizing, slightly reducing spectral reproducibility. Nevertheless, this accuracy remains sufficiently high for practical applications.
6. Discussion
6.1. Role of Motion Precision in Recognition Accuracy
This study quantitatively demonstrated that robot motion accuracy is directly linked to recognition accuracy. In our setup, the industrial robot exhibited a measured tracing-speed variation of approximately 1%–2% (coefficient of variation; evaluated as described in Section 3.3), which, according to Eq. \(\eqref{eq:eq1}\), suppresses frequency-axis variations to approximately 1%–2%. In contrast, manual tracing by a human would likely produce speed variations of 10%–20%. The difference of roughly one order of magnitude between robotic and manual speed variation explains why high-precision robot control is essential for stable PSD-based identification.
The primary factor enabling the high identification rate achieved by this method is not only the machine learning algorithm’s performance but also the physical-level guarantee of input data quality, including SNR and reproducibility, through robot control. This finding suggests that developing intelligent systems requires improving physical control precision rather than relying solely on advanced AI algorithms.
6.2. Durability Benefits of Internal Sensor Placement
Because the sensor is placed inside the finger in this method, vibration attenuates while propagating through the finger structure. PLA resin absorbs more vibration energy than metal due to its higher internal damping, which reduces the signal amplitude reaching the sensor. Nevertheless, the experimental results showed that high-frequency components up to 8,000 Hz contributed effectively to identification. This is likely because the rigidity of PLA resin was sufficient for vibration transmission, while its low density suppressed the inertia-induced filtering effect. Furthermore, because the sensor is not exposed to the contact surface, no observable degradation of sensor characteristics occurred even after thousands of tracing motions on abrasive objects such as sandpaper. This inherent durability enables maintenance-free long-term operation, a major advantage for industrial applications. As discussed in Section 3.4, ensuring sufficient signal gain in the identification-relevant frequency band by minimizing finger mass proved more important than pursuing a wider transmission bandwidth through high rigidity and low damping.
6.3. Comparison with Human Tactile Perception
According to Johnson et al. 27, Pacinian corpuscles, the mechanoreceptors in human fingertips that detect high-frequency vibrations, have a sensitivity bandwidth of approximately 40–400 Hz, and human spatial resolution is also limited. In a preliminary experiment with human subjects in this study, participants achieved approximately 92% accuracy in identifying 33 types of objects but only approximately 49% for fine sandpaper grit identification. In contrast, the proposed system achieved over 99% accuracy even for sandpaper. This performance results from wide-band sensing (up to 8 kHz) that exceeds human biological limits and constant-speed motion that humans cannot achieve. The system is positioned not merely as an imitation of human touch but as a technology that complements human perception by enabling quantitative evaluation of fine textures that are difficult for humans to assess.
6.4. Limitations and Future Work
This method has the following limitations:
-
Shape dependence: This study was limited to planar objects. For curved surfaces, contact area and pressure fluctuate with changes in contact angle, requiring integration with trajectory generation for three-dimensional surfaces.
-
Anisotropy: For directional textures such as wood grain or woven fabrics, single-direction tracing provides insufficient information. An exploration strategy incorporating multi-directional scanning is required.
-
Adhered substances: For liquids or adhesive substances, force information such as peel force must be integrated with vibration information.
For future work, we plan to incorporate the active sensing framework proposed by Kaboli et al. 28 to develop an algorithm that dynamically optimizes tracing speed and direction based on initial contact information. Adaptive strategies are expected to further improve recognition accuracy: for example, low-speed pressing for flexible objects with dominant low-frequency components and high-speed tracing for hard textures rich in high-frequency components.
7. Conclusions
This study developed a durable, high-precision object identification system that integrates high-precision tracing motion by an industrial robot with vibration measurement inside the finger, and verified its effectiveness. The main findings are as follows:
-
Theoretical consistency: Based on the relationship between tracing speed and vibration frequency (\(f=v/\lambda\)) and the vibration response model of the finger, we demonstrated both theoretically and experimentally that constant-speed robot control and lightweight finger materials are essential for acquiring high-frequency vibration information.
-
Outstanding identification performance: Using SVM classification with wide-band spectral features (0–8,000 Hz), the system achieved extremely high identification rates of 99.1% for 10 types of fine-grit sandpaper and 99.3% for 33 types of diverse real-world objects.
-
Practicality and robustness: By isolating the sensor from the contact point, the system resolves durability issues while maintaining a 95.6% identification rate even for datasets with variations in contact position and pressing depth, demonstrating robustness sufficient for real-world applications.
These results establish a foundational technology for equipping robots with tactile recognition capabilities exceeding those of humans in environments with limited visual information or manufacturing settings requiring precise surface inspection.
- [1] S. Hido, “Artificial Intelligence Technology for Industrial Robot Applications,” J. of the Robotics Society of Japan, Vol.35, No.3, pp. 186-190, 2017 (in Japanese). https://doi.org/10.7210/jrsj.35.186
- [2] Q. Li, O. Kroemer, Z. Su, F. F. Veiga, M. Kaboli, and H. J. Ritter, “A Review of Tactile Information: Perception and Action Through Touch,” IEEE Trans. on Robotics, Vol.36, No.6, pp. 1619-1634, 2020. https://doi.org/10.1109/TRO.2020.3003230
- [3] J. J. Gibson, “The Senses Considered as Perceptual Systems,” Houghton Mifflin, 1966.
- [4] S. J. Lederman and R. L. Klatzky, “Hand movements: A window into haptic object recognition,” Cognitive Psychology, Vol.19, No.3, pp. 342-368, 1987. https://doi.org/10.1016/0010-0285(87)90008-9
- [5] M. Hollins and S. R. Risner, “Evidence for the duplex theory of tactile texture perception,” Perception & Psychophysics, Vol.62, No.4, pp. 695-705, 2000. https://doi.org/10.3758/BF03206916
- [6] S. J. Bensmaïa and M. Hollins, “The vibrations of texture,” Somatosensory & Motor Research, Vol.20, No.1, pp. 33-43, 2003. https://doi.org/10.1080/0899022031000083825
- [7] H. Lee, K. Park, Y. Kim, and J. Kim, “Durable and repairable soft tactile skin for physical human robot interaction,” Proc. of the 2017 ACM/IEEE Int. Conf. on Human-Robot Interaction, pp. 183-184, 2017. https://doi.org/10.1145/3029798.3038417
- [8] Z. Kappassov, J.-A. Corrales, and V. Perdezuela, “Tactile sensing in dexterous robot hands – Review,” Robotics and Autonomous Systems, Vol.74, Part A, pp. 195-220, 2015. https://doi.org/10.1016/j.robot.2015.07.015
- [9] A. Khasnobish, G. Singh, A. Jati, A. Konar, and D. N. Tibarewala, “Object-shape recognition and 3D reconstruction from tactile sensor images,” Medical & Biological Engineering & Computing, Vol.52, No.4, pp. 353-362, 2014. https://doi.org/10.1007/s11517-014-1142-1
- [10] W. Yuan, S. Dong, and E. H. Adelson, “GelSight: High-Resolution Robot Tactile Sensors for Estimating Geometry and Force,” Sensors, Vol.17, No.12, Article No.2762, 2017. https://doi.org/10.3390/s17122762
- [11] N. Jamali and C. Sammut, “Material classification by tactile sensing using surface textures,” 2010 IEEE Int. Conf. on Robotics and Automation, pp. 2336-2341, 2010. https://doi.org/10.1109/ROBOT.2010.5509675
- [12] J. A. Fishel and G. E. Loeb, “Bayesian exploration for intelligent identification of textures,” Frontiers in Neurorobotics, Vol.6, Article No.4, 2012. https://doi.org/10.3389/fnbot.2012.00004
- [13] Y. Xin, H. Tian, C. Guo, X. Li, H. Sun, P. Wang, J. Lin, S. Wang, and C. Wang, “PVDF tactile sensors for detecting contact force and slip: A review,” Ferroelectrics, Vol.504, No.1, pp. 31-45, 2016. https://doi.org/10.1080/00150193.2016.1238723
- [14] J. Dargahi and S. Najarian, “A supported membrane type sensor for medical tactile mapping,” Sensor Review, Vol.24, No.3, pp. 284-297, 2004. https://doi.org/10.1108/02602280410545416
- [15] R. Kikuuwe, K. Nakamura, and M. Yamamoto, “Finger-Mounted Tactile Sensor for Evaluating Surfaces,” J. Robot. Mechatron., Vol.24, No.3, pp. 430-440, 2012. https://doi.org/10.20965/jrm.2012.p0430
- [16] H. Hu, Y. Han, A. Song, S. Chen, C. Wang, and Z. Wang, “A Finger-Shaped Tactile Sensor for Fabric Surfaces Evaluation by 2-Dimensional Active Sliding Touch,” Sensors, Vol.14, No.3, pp. 4899-4913, 2014. https://doi.org/10.3390/s140304899
- [17] P. Yu, W. Liu, C. Gu, X. Cheng, and X. Fu, “Flexible Piezoelectric Tactile Sensor Array for Dynamic Three-Axis Force Measurement,” Sensors, Vol.16, No.6, Article No.819, 2016. https://doi.org/10.3390/s16060819
- [18] S. Luo, J. Bimbo, R. Dahiya, and H. Liu, “Robotic tactile perception of object properties: A review,” Mechatronics, Vol.48, pp. 54-67, 2017. https://doi.org/10.1016/j.mechatronics.2017.11.002
- [19] J. M. Romano and K. J. Kuchenbecker, “Creating realistic virtual textures from contact acceleration data,” IEEE Trans. on Haptics, Vol.5, No.2, pp. 109-119, 2012. https://doi.org/10.1109/TOH.2011.38
- [20] J. Sinapov, V. Sukhoy, R. Sahai, and A. Stoytchev, “Vibrotactile recognition and categorization of surfaces by a humanoid robot,” IEEE Trans. on Robotics, Vol.27, No.3, pp. 488-497, 2011. https://doi.org/10.1109/TRO.2011.2127130
- [21] Y. Tanaka, D. P. Nguyen, T. Fukuda, and A. Sano, “Wearable skin vibration sensor using a PVDF film,” 2015 IEEE World Haptics Conf. (WHC), pp. 146-151, 2015. https://doi.org/10.1109/WHC.2015.7177705
- [22] C. Cortes and V. Vapnik, “Support-vector networks,” Machine Learning, Vol.20, pp. 273-297, 1995. https://doi.org/10.1007/BF00994018
- [23] C. J. C. Burges, “A Tutorial on Support Vector Machines for Pattern Recognition,” Data Mining and Knowledge Discovery, Vol.2, pp. 121-167, 1998. https://doi.org/10.1023/A:1009715923555
- [24] F. Pedregosa et al., “Scikit-learn: Machine Learning in Python,” J. of Machine Learning Research, Vol.12, No.85, pp. 2825-2830, 2011.
- [25] J. Scheibert, S. Leurent, A. Prevost, and G. Debrégeas, “The role of fingerprints in the coding of tactile information probed with a biomimetic sensor,” Science, Vol.323, No.5920, pp. 1503-1506, 2009. https://doi.org/10.1126/science.1166467
- [26] T. Hayakawa, S. Matsui, and J. Watanabe, “Classification method of tactile textures using onomatopoeias,” Trans. of the Virtual Reality Society of Japan, Vol.15, No.3, pp. 487-490, 2010 (in Japanese). https://doi.org/10.18974/tvrsj.15.3_487
- [27] K. O. Johnson and J. R. Phillips, “Tactile spatial resolution. I. Two-point discrimination, gap detection, grating resolution, and letter recognition,” J. of Neurophysiology, Vol.46, No.6, pp. 1177-1192, 1981. https://doi.org/10.1152/jn.1981.46.6.1177
- [28] M. Kaboli, K. Yao, D. Feng, and G. Cheng, “Tactile-based active object discrimination and target object search in an unknown workspace,” Autonomous Robots, Vol.43, pp. 123-152, 2019. https://doi.org/10.1007/s10514-018-9707-8
This article is published under a Creative Commons Attribution-NoDerivatives 4.0 Internationa License.