
Paper:
Surface Distortion Mapping System Narrowing Down Existence Probability via Touch Scanning
Yui Suzuki and Hiromi Mochiyama

University of Tsukuba
1-1-1 Tennodai, Tsukuba, Ibaraki 305-8573, Japan

This study proposes and develops a surface-scanning tactile sensor and mapping system that amplifies strain gauge signals to enable the detection of minute defects. The research objectives include: (1) developing high-strength, high-sensitivity sensing for distortions of tens of micrometers; (2) constructing a system capable of rapidly scanning a large inspection area; and (3) visualizing and digitizing defect locations. To achieve these objectives, three key approaches were implemented. First, we developed a tactile sensor with a simple, flexible structural design. By arranging pins parallel to the strain gauges, the sensor effectively amplifies mechanical deformation to increase output. Experiments showed that the proposed sensor achieves signal amplification of approximately 7.6 times compared to a strain gauge-only sensor and produces an output approximately 3.3 times greater than that of a conventional sensor. Second, because the sensor cannot independently determine positional information, we estimated positions using a marker-based approach. Specifically, we measured the distance between a target marker attached to the sensor and a reference marker during scanning. The accuracy was evaluated using a dimensionless error metric normalized by the 60 mm gauge length, and the system yielded an error of 7.6% with a standard deviation of 5.5 mm. Third, we developed a system capable of probabilistically estimating the precise location of micro-surface distortions. The strain gauges used in current tactile sensors have a gauge length of 60 mm, which introduces the limitation that the exact location of a micro-surface distortion cannot be determined from a single measurement. To address this limitation, we developed a method that increases the probability of detecting micro-surface distortions through repeated scanning, thereby progressively narrowing the estimated detection range.
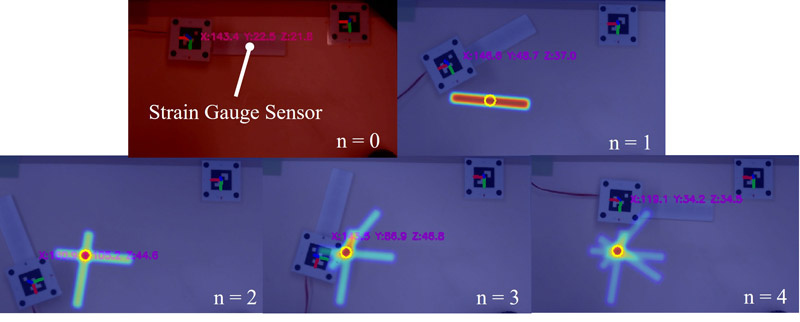
Process of narrowing down the estimated position based on the existence probability
1. Introduction
In the manufacturing industry, there is a persistent demand for technologies that improve production efficiency and ensure consistent product quality. Maintaining uniform quality with minimal variation is particularly critical, making rigorous product inspection indispensable. A prominent example is manual tactile inspection, which is extensively employed in automotive production lines to detect surface distortions. These distortions typically involve minute height variations on the order of tens of micrometers and widths of several millimeters, arising from surface undulations during molding processes or from dust contamination. As such defects significantly degrade product appearance and overall quality, eliminating the defects is mandatory. Currently, these distortions are detected primarily through human touch; however, this method depends heavily on highly trained personnel. While surface distortions can also be identified during final inspection by analyzing light reflected from the painted car body, this process is performed only after painting. Consequently, detecting defects at this late stage makes correction more difficult and inefficient. Ideally, surface distortions should be detected upstream in the production line to enable immediate removal or correction. However, several factors complicate the detection of surface distortions upstream in the production line, such as the minute scale of the distortions, the need to perform inspections rapidly as processed parts continuously move along the line, and the need to cover a large inspection area spanning several hundred square millimeters. These requirements were identified through interviews with workers 1,2,3.
Existing approaches for detecting surface distortions on the order of tens of micrometers include the use of laser sensors and image processing-based detection techniques. However, these methods encounter several limitations: contamination, such as oil present on the car body surface, or metallic gloss can lead to false detections, and the complex body shape makes their application difficult. Moreover, the implementation of dedicated equipment is costly, thereby posing a high barrier to adoption. For these reasons, product inspection on manufacturing production lines remains largely manual, relying on human tactile perception for surface distortion inspection. The most critical task in automotive production line inspection is the detection of surface distortions, which requires operators to maintain consistent inspection accuracy. However, in practice, inspection accuracy varies due to differences in operator skill levels and physical conditions. Such fluctuations in inspection accuracy represent a key challenge in tactile inspection. To support operators and improve the efficiency of this process, an effective screening system is highly desirable. Considering the workflow of practical on-site operations, identifying the microscopic location of a defect at the millimeter level is unnecessary; alternatively, a position estimation accuracy of a few centimeters is sufficient to guide the operator’s attention to the defective area.
Based on the above, the objective of this research is to detect extremely minute surface distortions present across a wide inspection area and to visualize and digitize their spatial location information. To achieve this objective, this research focuses on the following three points.
First, this study establishes a practical surface distortion sensing technology. Specifically, we developed a highly sensitive sensing technology capable of detecting minute surface deformations while maintaining high mechanical robustness.
Second, this study develops a system capable of efficiently and rapidly scanning a large inspection area.
Third, this study establishes a method to visualize the detected surface distortion locations with sufficient accuracy and to quantitatively process them as data.
With regard to the detection of minute surface distortions, Sano et al. 1,4 proposed a tactile contact lens designed to enhance the perception of subtle convexities, thereby facilitating the detection of surface distortions. Although this device utilizes a lever mechanism to amplify tactile sensitivity, allowing even inexperienced operators to detect minute irregularities, it lacks the capability for quantitative assessment. Tanaka et al. 2 proposed a finger-mounted sensor that inspects surface irregularities via active touch, enabling real-time measurement using wavelet transforms. However, its limited inspection area makes it unsuitable for large-area measurements. For high-precision surface measurement, GelSight [5, a] is a well-known technique. It reconstructs surface geometry in the digital domain by pressing a flexible elastomeric material against an object and analyzing the deformation through image processing. However, as this method requires physical contact across the entire target area, it is inefficient for the rapid exploration of large regions. To address the challenge of large-area measurement, Kikuuwe et al. proposed a sensor that detects temporal changes in shear strain 6. While this handheld device allows operators to intuitively and immediately perceive the location of irregularities by tracing the surface, its large form factor limits its application to highly curved surfaces or confined areas. Takei et al. 3,7,8 demonstrated the detection of minute undulations using a fingertip-mounted rubber tactile sensor. However, this method faces challenges in terms of inspection efficiency due to its limited contact area. Ando et al. 9 utilized a long strain gauge to detect surface distortions and determine their locations. The tactile sensor described in this study is referred to as the conventional sensor. While this technique provides a wider inspection range and enables quantitative evaluation, it does not offer real-time visualization of the surface distortions. The tactile sensors used in this study present the following two issues: (1) they are prone to breaking during manufacturing or measurement; and (2) their structural design makes them difficult to hold securely by hand. With advancements in semiconductor and microfabrication technologies, artificial skin has emerged as a thin tactile sensor that mimics human skin. In electronics, ultralight, ultrathin, and stretchable circuits—including epidermal electronics applied directly to the skin—have been realized and utilized to create artificial skin sensors 10,11,12. Nevertheless, a significant barrier to widespread application is that the fabrication of such electronic skins requires highly sophisticated and complex manufacturing processes.
Within the aforementioned related works, few studies have specifically focused on the detection of minute surface distortions over a wide inspection area. Moreover, although the localization of such distortions has been successfully achieved, research regarding the real-time visualization of their specific positions remains limited. Therefore, this study proposes a sensor capable of accurately and quantitatively detecting surface distortions and a sensing system that can effectively visualize the positions of minute irregularities in real time.
This research contributes to addressing key challenges in the manufacturing and robotics fields through the following achievements.
-
In the manufacturing field, we developed a system that enables real-time detection and position estimation of minute surface distortions by digitizing surface deformation information.
-
In the soft robotics field, we demonstrated the effectiveness of continuum sensing using long strain gauges and a simple amplification mechanism.
-
We developed a planar scanning tactile sensor and introduced a novel concept of collaborative tactile sensing between humans and sensors, thereby advancing the state of the art in tactile sensing technology.
2. Proposed System
2.1. Surface Distortion Mapping System
Figure 1 presents the system architecture proposed in this study. In this system, a human operator scans the inspection surface using a tactile sensor, and the regions of detected minute surface distortions are displayed on a monitor. The actual implementation of the system is shown in Fig. 2. The system estimates the sensor’s position upon detecting a distortion and plots a marker at the corresponding coordinates. Moreover, the system incorporates a human-in-the-loop framework, in which the operator visually confirms the plotted markers and performs focused scanning of the surrounding area, thereby increasing the probability of defect detection. For surface distortion detection, we adopted the wavelet transform method proposed by Tanaka et al. 2. Additionally, a camera-based marker tracking system is employed to estimate the sensor position during detection. Details of the tactile sensors utilized in this study are described in Section 2.2.
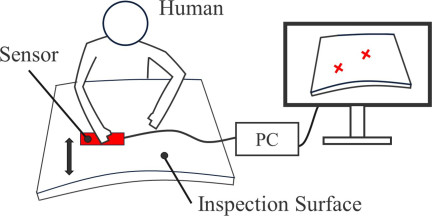
Fig. 1. Surface distortion mapping system.
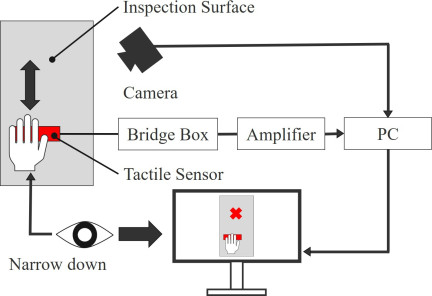
Fig. 2. Detailed view of the proposal system.
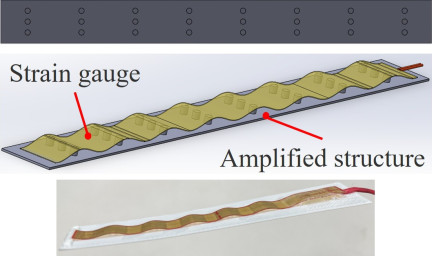
Fig. 3. Conventional sensor.
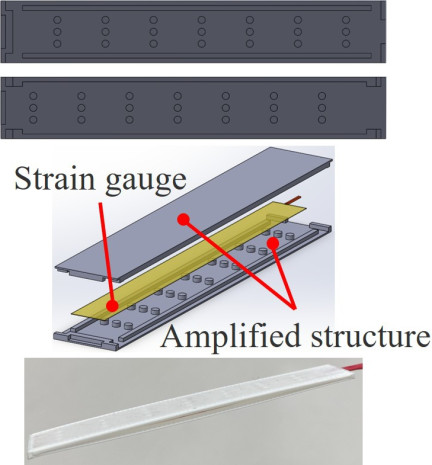
Fig. 4. Proposed sensor.
2.2. Proposed Sensor
In this study, the sensor used in Ando et al. 9 is treated as the conventional sensor for the purposes of this research. The conventional sensor is presented in Fig. 3. It consists of a flexible sheet and numerous pins, with strain gauges (KC-60-120-A1-11L1M2R, Kyowa Electronic Instruments Co., Ltd., Japan) attached to its surface. The strain gauges are only bonded where they contact the sheet; they are not adhered to the pins. The main limitations of this sensor include its susceptibility to tearing during fabrication and measurement, as well as the difficulty of manually holding it during operation due to its non-flat contact surface. Fig. 4 shows the newly developed sensor designed to address these issues. This sensor features a structure in which the strain gauge is sandwiched between the amplification structure from above and below, with adhesion occurring only at the sensor edges. It employs a strain gauge with a gauge length of 60 mm, and the sensor dimensions are 13 mm \(\times\) 80 mm.
One limitation of conventional sensors is their tendency to tear during fabrication or measurement. This issue is attributed to the large number of bonding surfaces between the sheet and the strain gauge, which makes the gauge susceptible to damage under deformation. To address this problem, the bonding area was restricted to the sensor edges, thereby reducing the total bonding area compared with that of conventional sensors and improving resistance to tearing during both fabrication and measurement. In addition, the difficulty of manually holding the sensor was noted. This problem was also addressed by sandwiching the strain gauge between two layers of the amplification structure. Consequently, this study employs the proposed sensor for detecting surface distortions.
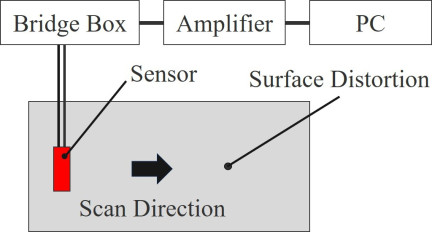
Fig. 5. Experimental system.
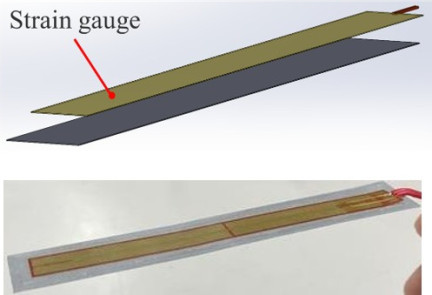
Fig. 6. Strain gauge-only sensor.
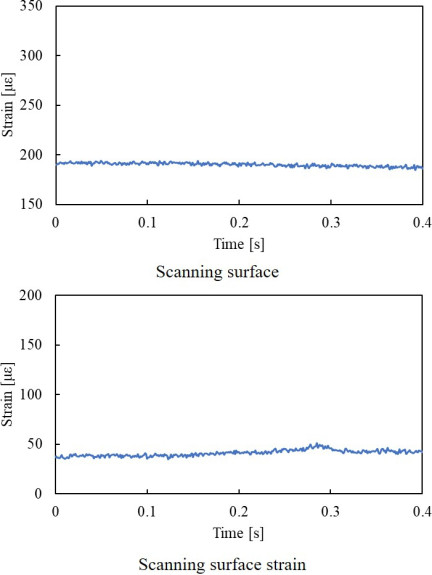
Fig. 7. Scanning using the strain gauge only sensor.
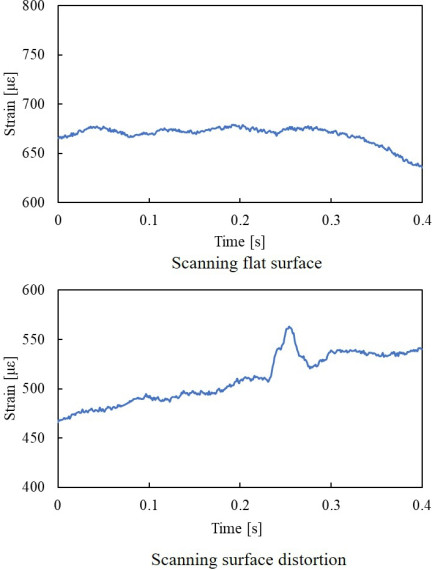
Fig. 8. Scanning using the proposed sensor.
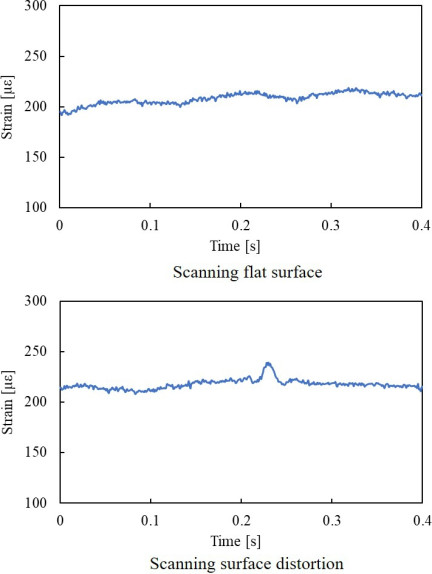
Fig. 9. Scanning using conventional sensors.
3. Experiment
3.1. Validation of the Amplification Effect
Figure 5 illustrates the experimental system for measuring surface distortion. The convex profile has a diameter of \(\phi\)4 mm and a height of 50 μm. In the experiment, a tactile sensor is used to scan both convex and non-convex surfaces. The evaluation method involves calculating the difference between the maximum value and the value measured 0.025 s prior to the maximum value, and then analyzing that difference. To verify the amplification effect, experiments were conducted using three types of sensors: a strain gauge-only sensor (Fig. 6), a conventional sensor, and the proposed sensor. The unit used for the strain measurements obtained from the sensor is μ\(\epsilon\), which corresponds to a strain magnitude of \(10^{-6}\). The experimental results are presented in Figs. 7–9, which display graphs of scans over a flat surface and over a surface with a convex profile, respectively. Additionally, to evaluate the variation in sensor output values between trials, a total of 10 trials were conducted under identical conditions. The results for the difference between the maximum value obtained from all 10 trials and the value measured 0.025 s prior are presented in Table 1.
Table 1. Evaluation of sensor output fluctuations.
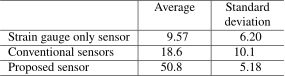
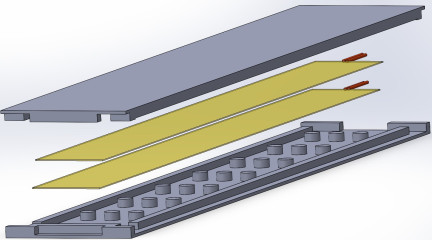
Fig. 10. Proposed sensor with two stacked strain gauges.
The result graph confirms that the range from distortion detection to the maximum value is approximately 7.08 μ\(\epsilon\) for the strain gauge-only sensor, approximately 16.3 μ\(\epsilon\) for the conventional sensor, and approximately 53.8 μ\(\epsilon\) for the proposed sensor. As the sensor values vary as each sensor passes over convex surface features, the results demonstrate that the strain gauge-based sensor can reliably detect minute convex shapes on an object’s surface. Moreover, the results indicate that the sensor incorporating the amplification structure produces larger strain values than the sensor using only the strain gauge. This suggests that the proposed sensor is amplified by approximately 7.6 times through the integrated amplification structure. Additionally, comparison with the output of the conventional sensor confirms that the proposed sensor produces a larger output. As presented in Table 1, the proposed sensor exhibits a higher average output value and a smaller standard deviation compared to the other two sensors. This demonstrates that the proposed sensor is capable of generating high-output signals with enhanced reproducibility while effectively suppressing inter-trial variability, even for minute convex shapes with a height of 50 μm.
3.2. Improved Sensitivity Through Signal Superposition
Small-scale features, such as micro-convexities, induce localized deformation in only a portion of the strain gauge, potentially reducing sensitivity and causing signals to be obscured by noise. Therefore, multiple strain gauges were used, and their signals were combined to improve sensitivity. In the experiment, scanning of the micro-convexity was performed using the proposed sensor, which consists of two strain gauges stacked as presented in Fig. 10, and the combined signal was subsequently analyzed. The test specimens and the evaluation methodology are identical to those in Section 3.1. Additionally, as in Section 3.1, 10 experimental trials were conducted to evaluate inter-trial variability. Moreover, to verify the noise suppression effect achieved by summing the outputs of the stacked strain gauges, the root mean square (RMS) of the output signal was calculated and compared. Specifically, the RMS of a signal artificially amplified to twice the output level of a single strain gauge was calculated and compared with the RMS of a signal obtained by summing the outputs of two individual strain gauges.
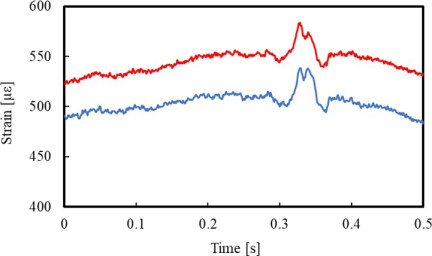
Fig. 11. Output signals from each strain gauge.
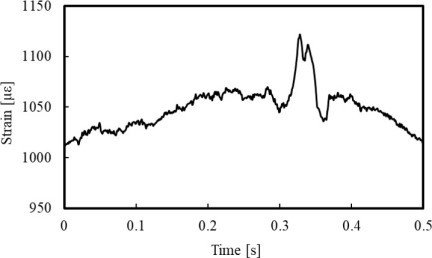
Fig. 12. Summed output signal.
Table 2. Evaluation of reproducibility for each strain gauge.
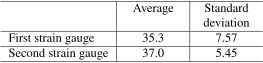
Table 3. Comparison of noise RMS between doubled single-gauge output and summed two-gauge output.
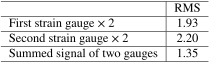
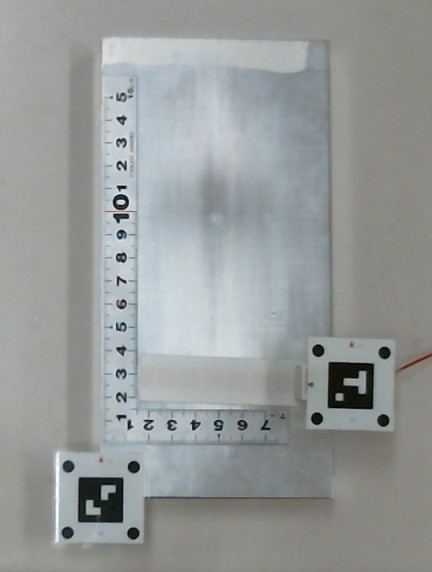
Fig. 13. Marker-based position detection system.
The experimental results are shown in Figs. 11 and 12, as well as Tables 2 and 3. The graphs clearly show a distinct peak around 0.35 s. Although the variation in each strain is relatively small, at approximately 34 μ\(\epsilon\), combining the signals yields an output of approximately 68 μ\(\epsilon\) without being obscured in noise. Table 2 indicates that the output of each strain gauge exhibits low variation and is stable. Table 3 demonstrates that the RMS value of the signal obtained by adding the outputs of two gauges is significantly smaller than the RMS value of the signal obtained by doubling the output of a single gauge. This demonstrates that the proposed method, in contrast to simple electrical amplification, is effective in isolating minute strain variations from noise. This further indicates that the sensor sensitivity is enhanced through the combination of signals from two strain gauges.
3.3. Position Detection Using Markers
This study aims to visualize minute convex features using the proposed sensor. However, such visualization cannot be achieved without accurately determining their spatial locations, making position detection essential. Current systems only detect the presence of micro-convex features without accurately localizing them, leaving their exact positions unknown. Therefore, position detection of micro-convex features was performed using markers, as presented in Fig. 13. The test specimen was the same as that described in Section 3.1. In the experiment, the \(y\)-coordinate of the micro-convexity feature was detected using markers upon detection. We collected 20 \(y\)-coordinate measurements for evaluation.
The experimental results showed that the average estimated position was 124.6 mm, with a standard deviation of 5.5 mm, compared to the actual value of 120 mm. Moreover, the dimensionless error, obtained by dividing the error from the true value by the gauge length of 60 mm, was 7.2%. These results indicate that the position estimation achieved satisfactory accuracy. Therefore, the proposed sensor’s surface distortion localization capability enables position estimation using multiple markers.
3.4. Narrowing Down Estimated Positions Based on Existence Probability
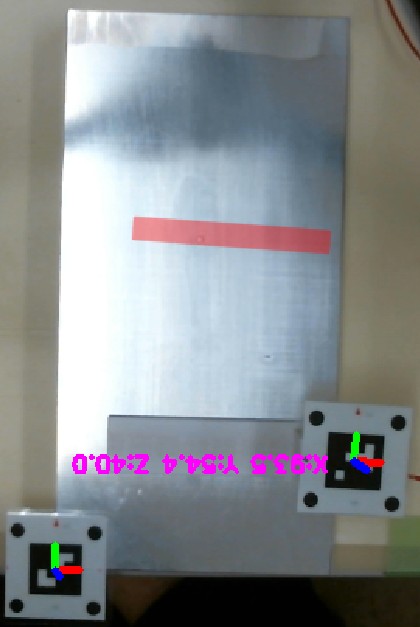
Fig. 14. Position estimation experiment setup.
In Section 3.2, we performed position detection using markers. However, as shown in Fig. 14, the estimated micro-convex positions reflect the geometry of the sensor, necessitating further refinement of the estimated positions. Therefore, we constructed a system that detects micro-scale surface distortions multiple times to increase their probability of existence and refine the estimated positions. Here, we propose the following update law to compute the probability \(P_n\) of surface distortion at position \(\pmb{p} \in \mathcal{S} \subset \Re^2\) at the \(n\)-th detection by the sensor:
We further prove, by mathematical induction, that the unity condition of the existence probability is preserved for all detection steps \(n \ge 0\), that is,
(i) Unity condition at the initial stage (\(n = 0\))
At the initial state, the probability is assumed to be uniformly distributed over the entire region of the camera image \(\mathcal{S}\). Integrating \(P_0(\pmb{p})\) over the entire domain \(\mathcal{S}\) yields:
(ii) Unity condition assumption at the \((n-1)\)-th detection
We assume that the unity condition of the probability at the \((n-1)\)-th detection step holds, i.e., \(\int_{\mathcal{S}} P_{n-1}(\pmb{p}) d\pmb{p} = 1\).
(iii) Unity condition at the \(n\)-th detection
Integrating both sides of the update law over the entire domain \(\mathcal{S}\) yields
From (i), (ii), and (iii) above, it has been proven by mathematical induction that the unity condition of the probability distribution is preserved for all \(n \ge 0\).
The proposed update rule \(P_n(\pmb{p})\) functions not as a mathematically independent convergence algorithm, but rather as part of an interactive exploration process involving human operation. The update rule accumulates past scan data and visualizes the current estimated state. The actual identification (narrowing down) of the defect location depends on the operator’s active scanning strategy, guided by this probability distribution \(P_n(\pmb{p})\). The update rule emphasizes regions with significant signal responses. The operator then concentrates the scanning process on these regions, thereby accumulating additional signal components. This iterative feedback mechanism ensures improved final positional accuracy.
The experimental method involves the comparison of the estimated detection positions obtained when scanning using the proposed system with those obtained when scanning while relying solely on the output waveform. In addition, to demonstrate the effectiveness of this system, we compare the estimated detection positions obtained from a single scanning pass. The inspection surface is presented in Fig. 15, and the experimental system is presented in Fig. 16.
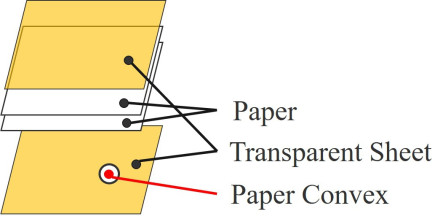
Fig. 15. Inspection surface.
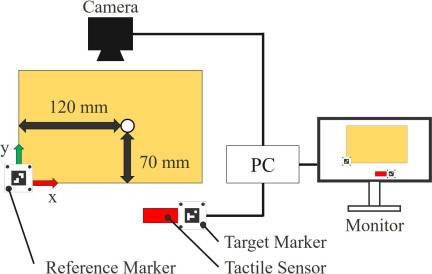
Fig. 16. Existence probability narrowing system.
Table 4. Experimental results of position estimation based on existence probability.
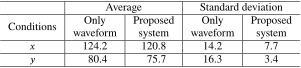
Table 5. Result from a single scan pass.
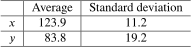
For the micro-surface convex feature, a paper with a thickness of 0.4 mm and an outer diameter of 4.5 mm was used and sandwiched between two transparent sheets, each with a thickness of 1.5 mm. Its position was defined at an \(x\)-coordinate of 120 mm and a \(y\)-coordinate of 70 mm from the origin of the reference marker. Two sheets of paper were inserted between the two transparent sheets to prevent the micro-protrusions from being visible to the naked eye. To verify the effectiveness of the proposed system, experiments were conducted according to the following procedure. First, within a single trial, sensor scanning was repeated a total of four times to progressively narrow down the estimated defect location. This location estimation process using four scans was treated as one set, and a total of four independent trials were performed. Table 4 presents the mean and standard deviation of the final detection results obtained in each of these four trials (i.e., the estimated location after completion of the fourth scan in each trial). Thus, the reported results correspond to the mean and standard deviation of the fourth scan. For the single-scan condition, 10 sets were performed, and the results are presented in Table 5.
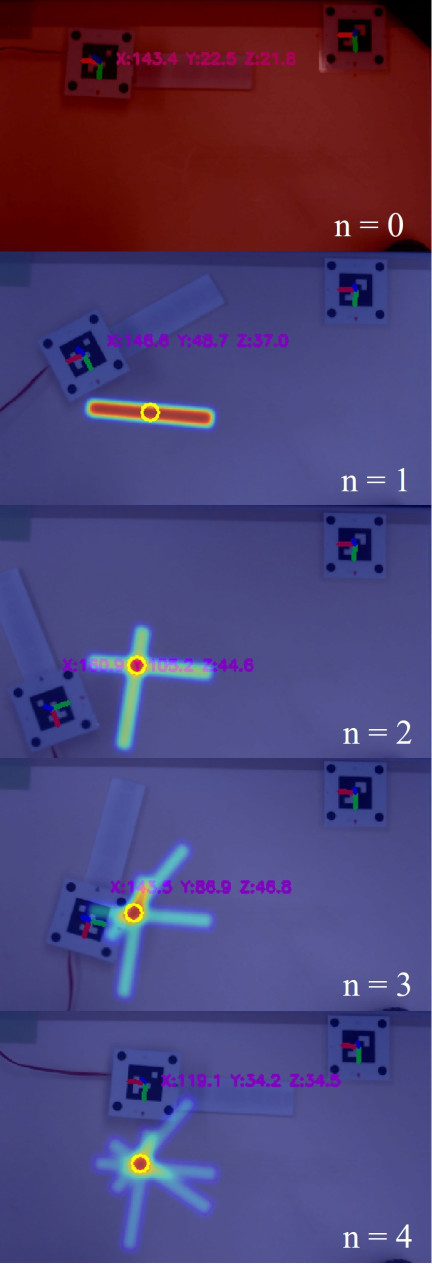
Fig. 17. Process of narrowing down the estimated position based on the existence probability.
Figure 17 illustrates photographs of probability changes during four scans using the proposed system. The probability of existence is represented by overlaying a color intensity map onto the image. The results suggest that, when scanning based solely on the output waveform, deviations from the true value were approximately 4.2 mm in the \(x\)-direction and 10.4 mm in the \(y\)-direction. When scanning using a single pass, the deviation from the true value was approximately 3.9 mm in the \(x\)-direction and 13.8 mm in the \(y\)-direction. In contrast, when scanning using the proposed system, the deviation from the true value was reduced to 0.8 mm in the \(x\)-direction and 5.7 mm in the \(y\)-direction. These results demonstrate that the proposed system enables more accurate estimation of the position of micro-scale surface distortions. The results also demonstrate that the proposed system reduces variability, as evidenced by a lower standard deviation.
4. Discussion
This section analyzes the factors contributing to the larger output of the proposed sensor compared to the conventional sensor, based on the results presented in Section 3.1. It also analyzes the factors contributing to improved accuracy when introducing probability-based filtering.
4.1. Factors Enabling the Proposed Sensor to Achieve Greater Output Compared to Conventional Sensors
One factor contributing to the increased output of the proposed sensor compared to the conventional sensor is attributed to improved stability during manual operation. From the result graphs shown in Figs. 8 and 9, the initial strain value is approximately 450 μ\(\epsilon\) for the proposed sensor, compared to approximately 200 μ\(\epsilon\) for the conventional sensor. This is considered to be the result of the strain value increasing because the sensor is being properly suppressed. Second, the pins may have also contributed to the amplification effect. While conventional sensors bond the strain gauge to the amplification structure using adhesive, the proposed sensor fixes the strain gauges with pins. This design enables the pins to deform along with the amplification structure during deformation, potentially producing greater deformation than conventional sensors. These findings indicate that the proposed sensor may have a higher output response than the conventional sensor.
4.2. Factors Contributing to Improved Accuracy When Introducing Probability-Based Filtering
One key factor contributing to the improved accuracy is the visual feedback provided regarding the estimated position. In this technique, the location of the surface distortion is obscured by the paper surface, making it impossible to visually identify it directly. However, when the sensor detects surface distortion, its estimated position is displayed in real time. This display likely serves as an effective indicator for determining the subsequent scanning direction.
Furthermore, the accumulation of multiple detection results progressively narrows the candidate range for the estimated position, thereby constraining the possible scanning directions. This is also considered to contribute significantly to the improved accuracy. In contrast, when scanning based solely on waveform information, although the detection timing can be identified, it is necessary to interpret the instantaneous waveform change and determine the exact position on the inspection plane where the detection occurred. This process is inherently ambiguous and fails to sufficiently constrain the estimated location range. Consequently, it likely results in deviations of the estimated mean position from the true value and increases the variability of the measured values.
Therefore, it can be concluded that the method of visualizing the estimated surface strain location and progressively narrowing the estimated range through multiple scans effectively enhances the overall positional accuracy.
5. Conclusion
This study proposes and demonstrates a tactile sensor incorporating a novel amplification mechanism, enabling the measurement of minute surface distortions. This sensor provides key advantages in terms of flexibility and simplified fabrication. Experimental evaluation confirmed that the proposed sensor achieves higher output performance compared to conventional single-strain-gauge configurations and existing sensors.
Furthermore, an attempt was made to enhance output through signal superposition techniques by examining a configuration using two strain gauges and combining their outputs. This approach resulted in the acquisition of clear, high-quality waveforms without being buried in noise.
Additionally, position estimation experiments using markers were conducted. The error between the estimated values and the true values was found to be approximately 5 mm, thereby confirming sufficient accuracy for reliable position estimation.
Finally, a position narrowing method based on the probability of a micro-protrusion’s existence was applied, and scanning based solely on waveform reference was compared with using the proposed system. The results revealed that the proposed system produced reduced estimation variability, thereby enabling more precise and reliable position estimation.
Future prospects include verifying whether variations among individual users affect the narrowing process based on the existence probability. As only one user participated in this study, the impact of user-dependent variability on the proposed method could not be fully evaluated. Therefore, assessing whether comparable accuracy can be achieved with a larger number of users remains an important future research task. Furthermore, while convex shape detection was performed manually in the present study, similar to the automation of welding and painting processes, it is anticipated that surface distortion inspection itself will be increasingly replaced by robotic systems in the future. Consequently, it is also necessary to further investigate and expand the applicability of the proposed method for robot-based surface strain inspection.
- [1] R. Kikuuwe, A. Sano, H. Mochiyama, and N. Takesue, “Enhancing haptic detection of surface undulation,” ACM Trans. on Applied Perceptions, Vol.2, No.1, pp. 46-67, 2005. https://doi.org/10.1145/1048687.1048691
- [2] Y. Tanaka, H. Sato, and H. Fujimoto, “Development of a finger-mounted tactile sensor for surface irregularity detection,” IEEE/RSJ Int. Conf. on Intelligent Robots and Systems, pp. 690-696, 2007. https://doi.org/10.1109/IROS.2007.4399396
- [3] T. Takei, M. Ando, and H. Mochiyama, “Wearable artificial skin layer for the reconstruction of touched geometry by morphological computation,” Adv. Robot., Vol.32, No.21, pp. 1122-1134, 2018. https://doi.org/10.1080/01691864.2018.1534610
- [4] A. Sano, H. Mochiyama, N. Takesue, R. Kikuuwe, and H. Fujimoto, “TouchLens: Touch enhancing tool,” Proc. IEEE Conf. Robot. Autom., pp. 71-72, 2004. https://doi.org/10.1109/TEXCRA.2004.1425003
- [5] M. Johnson and E. Adelson, “Retrographic sensing for the measurement of surface texture and shape,” Proc. 2009 IEEE Conf. Computer Vision and Pattern Recognition (CVPR 2009), pp. 1070-1077, 2009. https://doi.org/10.1109/CVPR.2009.5206534
- [6] R. Kikuuwe, A. Sano, H. Mochiyama, N. Takesue, and H. Fujimoto, “A tactile sensor capable of mechanical adaptation and its use as a surface deflection detector,” Proc. IEEE Sensors, pp. 256-259, 2004. https://doi.org/10.1109/ICSENS.2004.1426150
- [7] M. Ando, T. Takei, and H. Mochiyama, “Rubber artificial skin layer with flexible structure for shape estimation of micro-undulation surfaces,” ROBMECH J., Vol.7, Article No.11, 2020. https://doi.org/10.1186/s40648-020-00159-0
- [8] M. Ando, H. Mochiyama, T. Takei, and H. Fujimoto, “Effect of tactile contact lens on rubber artificial skin layer with a strain gauge,” 2016 IEEE/SICE Int. Symp. on System Integration (SII), Vol.7, No.11, pp. 397-402, 2016. https://doi.org/10.1109/SII.2016.7844031
- [9] M. Ando, R. Tokumine, T. Takei, and H. Mochiyama, “Tactile scanning for detecting micro bump by strain-sensitive artificial skin,” IEEE Robotics and Automation Letters, Vol.6, No.4, pp. 7541-7548, 2021. https://doi.org/10.1109/LRA.2021.3098473
- [10] D.-H. Kim, N. Lu, R. Ma, Y.-S. Kim, R.-H. Kim, S. Wang, J. Wu, S. Won, H. Tao, A. Islam, K. J. Yu, T.-I. Kim, R. Chowdhury, M. Ying, L. Xu, M. Li, H.-J. Chung, H. Keum, M. M. Cormick, P. Liu, Y.-W. Zhang, F. G. Omenetto, Y. Huang, T. Coleman, and J. A. Rogers, “Epidermal electronics,” Science, Vol.333, No.6044, pp. 838-843, 2011. https://doi.org/10.1126/science.1206157
- [a] M. Kaltenbrunner, T. Sekitani, J. Reeder, T. Yokota, K. Kuribara, T. Tokuhara, M. Drack, R. Schwödiauer, I. Graz, S. Bauer-Gogonea, S. Bauer, and T. Someya, “An ultra-lightweight design for imperceptible plastic electronics,” Nature, Vol.499, pp. 458-463, 2013. https://doi.org/10.1038/nature12314
- [b] S. Wang, J. Xu, W. Wang, G.-J. N. Wang, R. Rastak, F. Molina-Lopez, S. N. Jong Won Chung, V. R. Feig, J. Lopez, T. Lei, S.-K. Kwon, Y. Kim, A. M. Foudeh, A. Ehrlich, A. Gasperini, Y. Yun, B. Murmann, J. B.-H. Tok, and Z. Bao, “Skin electronics from scalable fabrication of an intrinsically stretchable transistor array,” Nature, Vol.555, pp. 83-88, 2018. https://doi.org/10.1038/nature25494
- [c] “Gelsight” https://www.gelsight.com/ [Accessed May 17, 2026]
This article is published under a Creative Commons Attribution-NoDerivatives 4.0 Internationa License.