
Paper:
Digital Transformation of Disaster Response in Wajima City Following the 2024 Noto Peninsula Earthquake: Implementation Process and Operational Conditions —A Comparative Case Analysis of Five Operations—
Yuki Orihashi*,†, Shingo Suzuki*, Hiroyuki Kuramoto*, Yoshihiro Ura**, and Go Urakawa***
*Research Division for Social Resilience, National Research Institute for Earth Science and Disaster Resilience (NIED)
3-1 Tennodai, Tsukuba, Ibaraki 305-0006, Japan
†Corresponding author
**City of Wajima
Wajima, Japan
***Graduate School of Disaster Resilience and Governance, University of Hyogo
Kobe, Japan

This study examines the implementation process and operational conditions determining the success or failure of the digital transformation of disaster response in Wajima City, Ishikawa Prefecture, following the 2024 Noto Peninsula Earthquake. The study is based on a single-case comparative analysis of five operations—post-earthquake building safety assessment, shelter management, temporary housing, facility management, and publicly funded demolition—using operational records, products, meeting materials, and development logs. These operations were compared using five dimensions: digitalization of information collection, accumulation of shareable data, situational awareness through visualization, connection to decision support, and cross-departmental coordination. Among the five operations, post-earthquake building safety assessment and temporary housing advanced most continuously, while shelter management and facility management tended to remain at the stage of visualization, and publicly funded demolition remained fragmented. The results reveal that the digital transformation of disaster response progressed step by step from data input to accumulation, visualization, and decision support, rather than emerging all at once. Self-contained operations tended to advance more smoothly, whereas cross-departmental operations required clearer coordination and decision-making mechanisms. Thus, success depended less on technology itself than on operational conditions, implying that effective implementation depends on the peacetime preparation of data items, identifiers, update responsibilities, and decision-making arrangements.
Reviewing disaster data on a tablet
1. Introduction
1.1. Background
Japan’s Basic Disaster Management Plan identifies several major pillars of emergency disaster response, including the collection and communication of information immediately after a disaster, acceptance of evacuees and provision of information, emergency recovery and prevention of secondary disasters, and promotion of post-disaster recovery. During a disaster, local governments are required to simultaneously perform multiple operations, including damage assessment, shelter management, lifeline restoration, housing provision, support for affected residents, debris removal, and demolition. During the 2024 Noto Peninsula Earthquake, widespread and severe damage occurred primarily in the Noto region of Ishikawa Prefecture. Local governments were compelled to address these diverse operations in parallel from the immediate aftermath of the disaster. In particular, as the damage extended over a wide area, a key challenge was to understand the progress and issues of each operation and continue the response while allocating limited human and material resources 1.
Under these circumstances, Wajima City, Ishikawa Prefecture, undertook initiatives aimed at the digital transformation (DX) of disaster response by developing input forms, web maps, dashboards, and related tools for multiple operations on the ArcGIS Online platform 2. These efforts were intended to support field information collection, visualization of conditions, information sharing within and across departments, progress monitoring, and decision support. However, these initiatives did not function uniformly. Some were used continuously in practice, whereas others achieved visualization but did not sufficiently connect to actual decision support or cross-departmental operations. This suggests that disaster response DX cannot be achieved simply by introducing digital tools; rather, its degree of advancement depends on the nature of its operation and implementation conditions.
1.2. Previous Studies
Similar to prior studies on practices in Wajima and the Noto region, Inoguchi et al. examined Wajima City’s response to the 2007 Noto Peninsula Earthquake, whereas Orihashi et al. analyzed the use of geographic information systems (GIS) in Wajima City during the 2024 Noto Peninsula Earthquake 2,3. These studies describe the actual use of GIS, but do not examine, from a comparative perspective, how far DX progressed across multiple operations.
In studies on disaster information-sharing platforms, the Shared Information Platform for Disaster Management and the Information Support Team have been discussed as mechanisms that support interorganizational information sharing and establishing a common operational picture (COP) 4,5,6,7,8,9. These studies demonstrate the significance of shared information platforms; however, they do not compare the implementation processes or stagnation causes across individual operations within local governments.
In studies on visualization and the COP, a shared situational overview has been regarded as the foundation for overcoming difficulties in coordination and information management 10,11,12,13. These studies demonstrate the role of visualization in situational awareness and decision-making. However, few studies have examined, through comparisons across operations, whether the information visualized is actually connected to decision support or cross-departmental coordination.
In studies on digital transformation in disaster management, the use of technology in disaster response has been framed not merely as the introduction of information technology, but as a redefinition of organizational identity and value propositions. This perspective has been organized into a conceptual framework through a review of previous studies 14. However, this line of research indicates that comparative analyses and empirical understanding of how such transformation affects multiple operational processes and the organization as a whole remain insufficient.
In studies on municipal DX and digital technology adoption by local governments, a Preferred Reporting Items for Systematic Reviews and Meta-Analyses review systematically organizes the adoption of digital technologies by local governments 15. This demonstrates that digitalization in local governments does not progress simply by introducing technology, but only when an appropriate balance is achieved among human resources, work procedures, institutional arrangements, and technical infrastructure. Although these studies understand municipal DX from the perspectives of organizational change and administrative reform, they do not sufficiently compare the differences in the degree of progress across operations under the high-pressure, multi-departmental conditions of disaster response.
Studies on information quality and collaboration have revealed that data quality is critical for decision-making during disasters and collaboration is a foundation for effective emergency management 16. These findings suggest that the success or failure of disaster response DX depends not only on the presence or absence of tools, but also on operational conditions, such as input workload, update practices, and interorganizational coordination.
Considered together, these studies suggest that the success or failure of disaster response DX depends not only on the availability of tools but also on operational conditions, such as the clarity of input responsibility, update workload, connections to decision-making processes, and the reusability of data. However, only a few studies have examined these issues by comparing multiple operations.
1.3. Research Gap and Research Questions
Previous studies have accumulated substantial knowledge on the development and implementation of individual tools, establishment of information-sharing platforms, effectiveness of visualization and COP, and municipal DX. However, few studies have compared multiple operations within a single local government using a common analytical framework to clarify how far DX progressed, where it stalled, and what factors determined its success or failure. Orihashi et al. 2 noted in their study on Wajima that what was implemented in each operation and how those processes should be assessed had “not been sufficiently examined.”
To address this gap, this study compares five operations in Wajima City, using a common framework comprising information collection, data accumulation, visualization, decision support, and cross-departmental coordination. It further attempts to explain the success or failure of DX not in terms of the mere presence or absence of tools, but in relation to operational conditions, such as the clarity of input responsibility, update workload, connections to meetings and decision-making processes, and data reusability.
Accordingly, this study addresses the following three research questions:
-
RQ1:
To what stage did disaster response DX progress across the five operations in Wajima City?
-
RQ2:
What operational conditions produced differences in the degree of progress?
-
RQ3:
Why did the DX advancement level differ between relatively self-contained and cross-departmental operations?
1.4. Contributions of This Study
Although previous studies have often discussed the effects of individual tools, development of information-sharing platforms, and effectiveness of visualization as separate topics, this study does not treat them as isolated elements, but as consecutive stages that constitute the progression of disaster response DX. By comparing multiple operations with different characteristics within a common analytical framework, this study seeks to clarify how far disaster response DX progressed and where it is likely to stall.
This study makes three contributions. First, it conceptualizes disaster response DX not in terms of the mere presence or absence of individual tools or infrastructure, but as an implementation process that extends from the digitalization of information collection to the accumulation of shareable data, visualization, and connection to decision support and operational coordination. This makes it possible to evaluate the disaster response DX not as a set of isolated successes or failures, but in terms of the stage reached in each operation.
Second, this study provides practical value for local governments by clarifying the types of operations that are more likely to advance in DX and those that tend to remain at the visualization stage, as well as by identifying the conditions that produce these differences. In particular, it demonstrates that relatively self-contained operations are more amenable to continuous design, from data input to practical use, whereas operations spanning multiple departments require careful design of update responsibility, scope of sharing, decision-making arenas, and coordination mechanisms. This offers practical implications not only for tool introduction during disasters, but also for what should be prepared in peacetime.
Third, this study has academic significance in that it connects adjacent strands of research, such as GIS applications, information-sharing platforms, COP studies, and municipal DX research, and conceptualizes disaster response DX as a staged implementation process that includes organizational operations. Its originality lies in shifting the focus away from visualization itself as the endpoint, and instead asking how visualization becomes connected to decision support and operational coordination.
2. Materials and Methods
2.1. Research Subject
This study focuses on the response to the 2024 Noto Peninsula Earthquake in Wajima City, Ishikawa Prefecture. In Wajima City, multiple disaster response operations were simultaneously conducted from the immediate aftermath of the disaster, including damage assessment, shelter management, housing provision, facility use coordination, and demolition and removal. During this process, input forms, web maps, dashboards, and related tools were developed for multiple operations as part of efforts toward the DX of disaster response. Fig. 1 presents the major products developed in the first year after the disaster and their timelines.
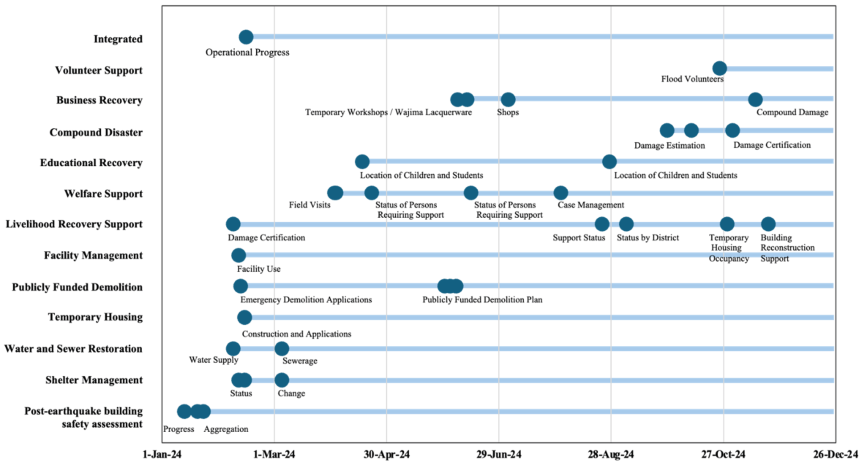
Fig. 1. Timeline of major products developed during the first year after the disaster.
Among the many products created in Wajima City, this study limits its analysis to five operations: post-earthquake building safety assessment, shelter management, temporary housing, publicly funded demolition, and facility/space resource management. These five were selected because they (1) include operations that were important from the initial response through the early recovery phase, (2) include both relatively self-contained and cross-departmental operations, and (3) provide comparable products and operational records. Here, “self-contained operations” refer to those in which data input, use, and decision-making are completed primarily within a single department, whereas “cross-departmental operations” refer to those that presuppose coordination and resource allocation across multiple departments.
These initiatives were not simply cases of creating tools for individual operations; rather, they were developed in accordance with the operational structure that supports disaster response. Fig. 2 illustrates this concept schematically. Disaster response proceeds through three layers: the field, where individual objects or cases are handled; departmental headquarters, where information is aggregated by function and plans are developed; and city headquarters, which coordinates multiple departments and allocates resources. At the field level, information on individual incidents is collected using form-based inputs. At the departmental headquarters, this information is aggregated and analyzed to understand the damage conditions and prepare draft action plans. At the city headquarters level, information collected from each department is visualized through dashboards and summary materials, and used for shared situational awareness and decision-making.
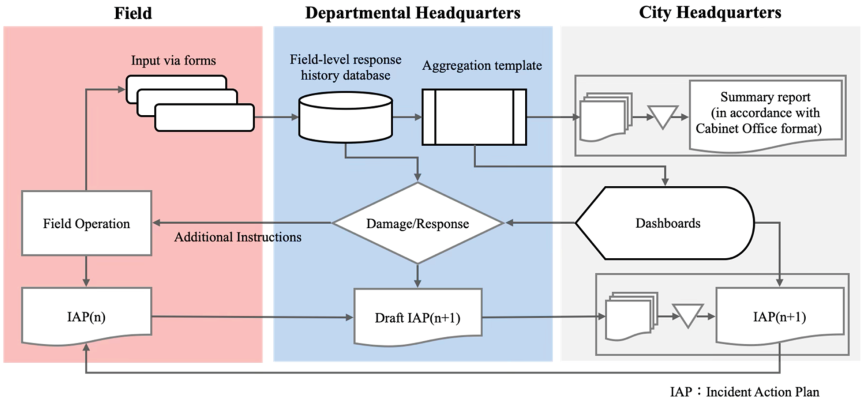
Fig. 2. Information processing at each disaster response layer within city hall.
Accordingly, the required forms of information differ across layers. The field requires forms that are easy to enter data into; departmental headquarters require databases and templates that support aggregation, analysis, and operational management; and city headquarters benefit from dashboards that allow both summarized overviews and access to detailed information. Operations such as shelter management, lifeline restoration, temporary housing, and livelihood recovery support are interrelated, and seamless support requires data sharing across departments. Thus, the large number of products created in this case reflects the fact that disaster response itself is a multilayered and interdependent set of operations, requiring information processing and visualization at each stage.
Thus, Wajima City represents a case in which DX practices targeting multiple operations were intensively implemented, while diverse disaster response functions proceeded simultaneously. Therefore, it is well-suited for examining the implementation process of disaster response DX. This single-case study is based on this series of practices.
| Operation | Main analytical materials | Type of material | Period covered | Main creators / updaters | Main points examined |
| Post-earthquake building safety assessment | Building safety assessment form / progress dashboard / summary dashboard | Input form / dashboards | January 10–21, 2024 (summary version after completion of the survey) | Responsible department / DX team | Data-entry actors, storage location, content of visualization, connection to revision of survey plans, limited secondary use in subsequent operations |
| Shelter management | Number of evacuees by shelter (disaster response headquarters meeting materials) / shelter status map / shelter status dashboard | Meeting materials / web map / dashboard | Around February 2024 | Responsible department / DX team | Conversion of meeting materials into GIS, update responsibility, workload of manual updating, connection to shelter consolidation/closure decisions, limits of cross-departmental linkage |
| Temporary housing | Candidate site application form / candidate site GIS / construction progress dashboard / application status dashboard | Input form / web map / dashboards | January–February 2024 | Responsible department / DX team | Demand estimation, matching with data from other operations, progress management, sharing with related organizations, limits of strict data linkage |
| Facility management | Public facility inventory \(+\) facility use data / facility use status map / searchable dashboard for available facilities / management and update application | Inventory / web map / dashboard / update application | From January 2024 onward | Responsible department / DX team | Visualization of spatial resources, update methods, scope of sharing, ambiguity of decision-making responsibility, operational constraints |
| Publicly funded demolition | Publicly funded demolition progress dashboard (prototype / department-use version) | Dashboard | 2024-September 2025 | Responsible department / external contractor / DX team | Digitalization of progress management, lack of shared information base, update methods after transfer to the responsible department, limited cross-departmental sharing |
2.2. Analysis Materials
To ensure analytical transparency and reproducibility, this study specifies the target periods, names of the main materials, their types, and the main analytical points examined. A detailed list of the target periods and analytical materials is presented in Table 1.
To examine the implementation process of disaster response DX in Wajima City, the study used as its primary analytical materials the input forms, web maps, dashboards, and tabulated data sheets created and operated for each target operation. These materials were central to clarifying how field information was entered, accumulated, visualized, and used in actual operations.
In addition, meeting materials, operational records, explanatory documents, and development logs were reviewed. Specifically, the materials used in disaster response headquarters meetings and within responsible departments, explanatory documents for each product, and records of updates made during development were cross-checked. This made it possible to confirm not only the existence of each product, but also its purpose and the context in which it was used.
2.3. Analytical Framework
This study used five analytical dimensions to compare the extent to which disaster response DX progressed across operations. The first is the digitalization of information collection. This refers to whether information that was previously handled through paper forms or verbal communication was converted into a format that could be entered digitally through forms, applications, or similar tools. The second issue is the accumulation of shareable data. This concerns whether the entered information was not merely retained by individuals or a limited number of staff members, but was stored and managed in a form that could be shared within the organization. The third is situational awareness through visualization. This refers to whether the accumulated data were expressed through maps, graphs, dashboards, or similar means, so that progress, spatial distribution, and regional differences could be grasped from an overview. The fourth is its connection to decision support. This concerns whether the visualized information was used not only for understanding the current situation, but also for decision-making such as revising plans, setting priorities, and allocating resources. The fifth is the degree of cross-departmental coordination. This refers to whether the data and visualizations developed for each operation were used not only within that operation itself, but also for reuse in other operations and for coordination across departments.
This framework was established to understand disaster response DX not simply in terms of whether digital tools were introduced but also as an implementation process that proceeds through input, accumulation, visualization, decision-making, and coordination. Thus, even if forms or dashboards existed in a given operation, DX was regarded as remaining at a limited stage if it was not connected to decision support or inter-operational coordination. Using these five dimensions, this study compares the progression stage reached in each operation on a common basis and examines the conditions that produced the differences among them.
| Evaluation dimension | High | Medium | Low | Key criteria for assessment |
| Digitalization of information collection | Major field information was continuously entered in digital form. | Some information was digitalized, but paper-based, verbal, or manual handling remained. | Information was handled primarily in non-digital form. | Existence of input forms, clarity of data-entry actors, degree of integration into field operations |
| Accumulation of shareable data | Data were continuously stored and managed in a form that could be shared within the organization. | Some data were shared, but the storage format or scope of sharing was limited. | Data remained under separate management, and the shared information base was weak. | Storage destination, scope of sharing, continuity of updating |
| Situational awareness through visualization | Conditions could be continuously grasped from an overview perspective through maps, graphs, dashboards, and similar tools. | Visualization was conducted, but only in a limited or intermittent manner. | Visualization was hardly conducted. | Existence of web maps and dashboards, frequency of updates, accessibility for viewing |
| Connection to decision support | Information was actually used for revising plans, setting priorities, allocating resources, and similar decisions. | Information was referred to as background or reference material, but its influence on decisions was limited. | Information was rarely connected to decision-making. | Reference in meetings, reflection in plan revision and resource allocation |
| Cross-departmental coordination | Data were continuously used for reuse in other operations and for cross-departmental coordination. | There was limited reuse or temporary cross-departmental use. | Use remained within the operation itself, with almost no cross-departmental use. | Presence of identifiers and location data, linkage with other operations, use in cross-departmental meetings |
The comparison was performed using the steps described below. First, for each operation, related products and operational records were chronologically organized. Next, rather than merely confirming the existence of tools or interfaces, attention was paid to the actual conditions of the operation, including the actor responsible for data entry, where the data were accumulated, the content of visualization, the meetings and decision-making processes in which the information was referenced or used, and whether the data were reused in other operations. Each operation was then compared across five dimensions: digitalization of information collection, accumulation of shareable data, situational awareness through visualization, connection to decision support, and degree of cross-departmental coordination. In addition, the degree of attainment for each dimension was classified into three levels (high, medium, and low), and the stagnation causes were examined across cases. The degree of attainment was assessed by cross-checking the products created for each operation, update records, meeting materials, and actual operational use based on the criteria listed in Table 2. The authors then rechecked the assessment results to confirm their consistency with the descriptions. Through this procedure, the study comparatively analyzes the differences in the progression of disaster-response DX in relation to operational characteristics and implementation conditions.
Attainment levels were assessed not based on the mere existence of products, but by determining whether data entry and updating were sustained; whether the information was referenced in meeting materials or operational records; whether it was concretely reflected in decisions such as plan revision, priority setting, and resource allocation; and whether it was reused in other operations or departments. For each dimension, “high” was assigned when sustained operation or actual use was confirmed; “medium” when operation or reference was partial or temporary; and “low” when operation or use could not be confirmed within the scope of the materials analyzed, or, if confirmed, was extremely limited. In particular, connection to decision support was assessed with an emphasis on concrete reflection in plan revisions, resource allocation, and similar decisions, whereas cross-departmental coordination was assessed with an emphasis on actual reuse by other operations or departments and use in coordination settings. Although the five dimensions represent stages in the progression of DX, attainment was assessed independently for each dimension because prototype visualization could sometimes be implemented even when a preceding stage was not fully established. Furthermore, “low” does not indicate that no use occurred at all; rather, it indicates that actual use could not be confirmed from the materials used in this study or, if confirmed, was extremely limited.
2.4. Authors’ Position and Potential Bias
A distinctive feature of this study is that all authors were involved in the design, implementation, or operational support of the disaster response DX initiatives examined. Accordingly, this study is not an observational study conducted by external third parties, but rather a reconstruction of practices based on collaborative implementation. This position offers the advantage of allowing the implementation process, operational constraints, and realities of interdepartmental coordination in each operation to be examined in detail. An important feature of this study is that it is able to describe, in close relation to the implementation process, the intentions underlying the design of each product and the stages at which operational difficulties emerged.
However, such a position also entails the possibility of bias toward the implementers’ perspective. It may place relatively greater emphasis on the intentions and efforts underlying the introduction of tools while making it difficult to fully capture aspects that were not utilized or evaluated from the users’ perspective. To address this issue, this study organized the target operations using a common five-dimensional framework—the digitalization of information collection, accumulation of shareable data, situational awareness through visualization, connection to decision support, and degree of cross-departmental coordination—and compared the cases based on multiple types of records, including meeting materials, development histories, update records, and operational results. In addition, to avoid emphasizing only successful implementation cases, the analysis included cases that did not lead to decision support and those that did not reach cross-departmental use.
Although this study inevitably includes an insider perspective derived from collaborative implementation, it explicitly recognizes the potential bias associated with that position and seeks to ensure analytical transparency by cross-checking multiple materials and including cases in which implementation was unsuccessful.
3. Results
This section presents the findings of each disaster response DX practice in Wajima City, based on the analytical framework presented in Section 2. Each operation is examined from five perspectives: (1) digitalization of information collection, (2) accumulation of shareable data, (3) situational awareness through visualization, (4) connection to decision support, and (5) degree of cross-departmental coordination. Using this analysis, this section presents the stage to which disaster response DX progressed in each operation.
3.1. Post-Earthquake Building Safety Assessment
The post-earthquake building safety assessment was an operation in which the full-scale DX advanced the earliest among the cases examined in this study. To improve the situation in which information on building damage had not yet been systematically organized, and to establish an information base that could contribute to both residents’ safety and subsequent operations, the survey form was digitized for mobile use, and the results were visualized. In the field, the survey results were entered using tablets and GIS, and information was accumulated as georeferenced data. This reduced the conventional workload of transcribing and aggregating paper survey sheets after collection and made it possible to understand the survey progress and spatial distribution of damage almost in real time.
Based on the accumulated data, progress and area-based summary dashboards were also developed. When the full extent of building damage across the city was unclear, the survey results were displayed in the disaster response headquarters office, making it possible to visualize both the proportion and spatial distribution of damaged buildings, and provide information to the responsible department and disaster response headquarters. This was particularly useful for external support personnel unfamiliar with the local area as it allowed them to confirm both place names and area-specific damage ratios, thereby supporting shared situational awareness.
In addition, although the safety assessment was initially planned only for the densely built-up Wajima district, the survey area was later expanded to cover the entire city. Consequently, the damage conditions in heavily affected areas, such as Machino and Urakami, could also be determined, and the information was used to revise survey plans for subsequent days and understand the overall damage situation in the city.
However, the secondary use of the results for housing damage certification surveys and publicly funded demolition remained limited. Although the potential for using post-earthquake building safety assessment results in subsequent operations was recognized, cross-departmental use remained limited because prior coordination and preparedness of receiving units were insufficient.
3.2. Shelter Management
In shelter management, an attempt was made to develop an information base to support decisions on shelter consolidation and closure under dispersed evacuation conditions, including secondary and tertiary evacuations to locations outside the city. Based on materials prepared for disaster response headquarters meetings and related sources, information such as shelter locations, number of evacuees, number of people unable to return home, and infrastructure recovery conditions was converted into GIS data and visualized as web maps and dashboards.
Consequently, a foundation was established to obtain an overview of the distribution of shelters and conditions of evacuees, suggesting the potential to support situational awareness under dispersed evacuation and inform consideration of shelter consolidation and closure. In addition, efforts were made to improve operational feasibility by assuming that on-site staff would be responsible for updating and by revising the input templates and attribute structures accordingly. Shelter management represents a case in which the accumulation of shareable data and situational awareness through visualization advanced to a certain extent.
However, sustained operational use remained limited. In addition to the fact that the information was highly granular and update burden was heavy, on-site staff had to prioritize day-to-day shelter operations, making it difficult to devote sufficient time to next-stage decisions, such as consolidation and closure. Moreover, because this operation presupposed connections with livelihood recovery support and temporary housing development, it was inherently difficult to complete it within a single department.
Accordingly, in this operation, the digitalization of information collection was only partially achieved, while the accumulation of shareable data and situational awareness through visualization progressed moderately; in contrast, connections to decision support and cross-departmental coordination remained limited.
3.3. Temporary Housing
In temporary housing operations, systems were developed to monitor and share information on applications, candidate construction sites, and construction progress to secure housing for affected residents as rapidly as possible. The application data and candidate site information were digitized and organized in an integrated manner on GIS. In addition, the overall situation could be understood through visualization of the application status and construction progress using dashboards and related tools.
A notable feature of this operation was that it attempted to connect data from other operations at an early stage. Specifically, the number of required housing units and selection of candidate construction sites were examined by referring to information from post-earthquake building safety assessments and housing damage certification surveys. In particular, during the estimation of demand by matching temporary housing application data with housing damage certification results, the two datasets were compared before the formal issuance of disaster victim certificates. This comparison confirmed that approximately 40% of the applicants had suffered damage classified as “less than half-collapse,” suggesting that they were unlikely to meet the eligibility requirements for temporary housing. These objective data were used as the basis for important policy decisions such as revising construction numbers downward and preventing oversupply.
Thus, temporary housing represents a case in which DX progressed beyond routine progress management within a single operation and reached a stage in which information from other operations was used for decision support. However, there were limits to strict data linkages at the individual level and full integration across departments. Accordingly, this operation advanced to a relatively high stage, but cross-departmental coordination remained limited.
3.4. Facility Management
In facility management, attempts were made to develop a basis for visualizing the use of spatial resources required for disaster response, such as rooms and open spaces, and for considering their allocation from the perspective of overall optimization. The public facility inventory and candidate sites for temporary housing were converted into GIS data and attributes such as usage status and purpose were added. Based on these data, web maps, dashboards, and update applications were developed. Consequently, a technical foundation was established to obtain an overview of the locations and utilization status of spatial resources. As it became possible to confirm the number of facilities, breakdown of usage conditions, and search for available facilities according to specific criteria, the stages of information collection, accumulation of shareable data, and visualization can be regarded as having progressed.
However, actual use remained limited. The reasons for this include the fact that the displayed information was too detailed to directly support rapid decision-making during the emergency phase, it did not sufficiently match on-site needs, and the actors and decision-making processes responsible for coordinating spatial resources across the entire municipal government were not clearly defined.
More specifically, within the city hall building, there were situations in which the establishment of consultation counters for affected residents competed with the need to secure liaison activity spaces for support organizations engaged in counterpart assistance. Similarly, regarding open spaces, coordination was required to secure logistics reception sites and candidate sites for temporary housing. However, at least within the scope of this study, it is difficult to say whether the visualized information was continuously referred to in these coordination settings and used for decision-making from the perspective of overall optimization. In particular, when securing open spaces, it was necessary not only to ensure sufficient site area, but also to coordinate the functional chain of space, including construction arrangements, lodging functions, and logistics routes. However, the visualized information could not be confirmed to have been sufficiently connected to such integrated judgments.
Although visualized information existed, it was not sufficiently linked to continuous decision support or resource allocation. In summary, in this operation, the digitalization of information collection, accumulation of shareable data, and situational awareness through visualization progressed only to a limited extent, whereas connections to decision support and cross-departmental coordination remained limited.
3.5. Publicly Funded Demolition
Publicly funded demolition was an important operation for removing damaged buildings and thereby creating preconditions for recovery and reconstruction; however, the progress of DX in this operation was more limited than in other cases. Although there was a strong need to digitalize applications and progress management, the development of a progress management database and shared information base was insufficient in the initial stage, and the operational process advanced ahead of the digital infrastructure.
More specifically, in the early stages of reception, two different schemes—emergency demolition and publicly funded demolition—coexisted, and multiple application channels, that is, in-person applications at the service counter and online applications, were used in parallel. In addition, the procedures for identifying building owners, demolition target buildings, and estimating the demolition volume were complex. Consequently, the development of a database foundation that could centrally accumulate application information and be used for progress management and cross-departmental sharing lagged.
During this process, a prototype dashboard was developed to visualize the number of applications, progress status, and the number of applications by district. However, progress management largely operated within the work processes of the external contractor commissioned by Wajima City and, at least within the range confirmed in this study, it was difficult to identify it as a mechanism that was continuously shared and operated by the municipal government. Later, when progress management for publicly funded demolitions was gradually transferred to the responsible department, a department-use dashboard was developed that enabled condition-based search, location checking on a map, statistical displays, and updates reflecting Excel data. However, this was also primarily intended for use within the responsible department, and within the scope of this study, it cannot be said to have been established as a municipality-wide shared information platform.
In addition, although there was the potential to use preceding data, such as post-earthquake building safety assessment results, to identify dangerous buildings and support emergency response, sufficient use was not achieved because the necessary linkage design and operational preparation had not been established in peacetime.
Consequently, although publicly funded demolition had a high need for digitalization, the digitalization of information collection remained partial, the accumulation of shareable data and connections to decision support were weak, and visualization was intermittent. Additionally, almost no cross-departmental use was confirmed within the scope of this study.
3.6. Summary of the Results
The above results reveal clear differences in the extent to which the disaster response DX progressed across the operations examined. Table 3 summarizes these findings. Post-earthquake building safety assessments and temporary housing were cases in which DX progressed relatively continuously from information collection to decision support. In contrast, visualization advanced to a certain extent in shelter and facility management, but remained weakly connected to actual decision support and sustained operation. Despite its high practical necessity, publicly funded demolition lagged in the development of its information base and did not progress sufficiently.
| Operation | Digitalization of information collection | Accumulation of shareable data | Situational awareness through visualization | Connection to decision support | Cross-departmental coordination | Overall findings |
| Post-earthquake building safety assessment | High | High | High | High | Medium | Input responsibility was clear, and DX progressed relatively continuously from information collection to decision support. Secondary use remained limited. |
| Shelter management | Medium | Medium | Medium | Low | Low | Visualization progressed, but the update burden and weak linkage to decision-making actors remained as challenges, and operational use was limited. |
| Temporary housing | High | High | High | High | Medium | In addition to application and progress management, data from other operations were also referenced, but integration remained limited. |
| Facility management | Medium | Medium | Medium | Low | Low | Visualization of spatial resources was achieved, but unclear coordination responsibility made it difficult to connect the system to decision support. |
| Publicly funded demolition | Medium | Low | Medium | Low | Low | Information collection was partially digitalized, but the shared information base and linkage design lagged behind, and overall progress remained limited. |
Operational records and related materials confirmed that post-earthquake building safety assessment, rated “high” for connection to decision support, was used to revise survey plans for subsequent days, while temporary housing, also rated “high,” was used to revise planned construction numbers downward and prevent oversupply. In contrast, shelter management, facility management, and publicly funded demolition were rated “low” because, although visualized information existed, the analytical materials did not confirm its concrete use in plan changes or resource allocation. For cross-departmental coordination, post-earthquake building safety assessment was rated “medium” because limited secondary use in housing damage certification surveys and publicly funded demolition was confirmed. Temporary housing was also rated “medium” because data from post-earthquake building safety assessments and housing damage certification surveys were referenced for demand estimation and related purposes. However, neither case achieved sustained cross-departmental use nor full integration.
4. Discussion: Disaster Response DX as an Implementation Process
4.1. Disaster Response DX Progresses in Stages
A comparison of the results across the operations examined in Section 3 suggests that disaster response DX in Wajima City did not emerge in a fully developed form all at once but rather progressed in stages. It followed a process in which field information was first digitalized, then accumulated as shareable data, made visible to support situational awareness, and subsequently connected to decision support and coordination with other operations.
This perspective differs from the understanding of DX as mere digitization. For example, the existence of input forms or web maps alone does not necessarily mean that DX has been realized as an operational improvement. In the present case, shelter and facility management reached the visualization stage, but the generated information was not sufficiently connected to continuing decision-making or resource allocation. In contrast, in post-earthquake building safety assessment, the mobile digitization of survey forms, accumulation of data, development of dashboards, and their use for progress management advanced in a relatively continuous manner.
These findings indicate that the essence of disaster response DX lies not simply in recording data, but also in creating conditions in which those data are used for subsequent decisions. In other words, DX should not be understood as a discrete point achievement but as a flow that links input, accumulation, visualization, and decision support. If the flow stops at any stage, the effects of DX remain limited.
4.2. DX Advances More Easily in Self-Contained Operations and Less Easily in Cross-Departmental Operations
When these differences in progression were examined by operation, a clear tendency was observed: DX advanced more easily in operations that were relatively self-contained within a single department, whereas it became more difficult in operations spanning multiple departments. Post-earthquake building safety assessment is a representative example of the former, as the responsibility for surveying, data entry, and use was relatively well aligned, making it easier to design the flow from information collection to visualization and progress management as an integrated sequence. In contrast, in shelter and facility management, the actors responsible for data input and visualization did not coincide with those responsible for making decisions based on that information. Consequently, although visualization was achieved, it was less likely to be connected to subsequent operations.
In particular, shelter consolidation and closure, and the allocation of spatial resources are not operations that can be completed within a single responsible department. Shelter management presupposes connections with other operations that function as the next stage of support such as lifeline restoration, temporary housing provision, and livelihood recovery support. Similarly, facility management involves the coordination between multiple supporting organizations and municipal departments. In such operations, visualization alone is insufficient; what is also required is an organizational framework that defines who makes decisions, in what setting, and based on what information.
Therefore, rather than simply stating that DX is more difficult in cross-departmental operations, it is more accurate to state that such operations require a design that includes coordinating actors and decision-making mechanisms in addition to data preparation.
4.3. Success and Failure Were Determined More by Operational Conditions than by Technology Itself
The differences observed across the operations appeared to be shaped less by the performance of the tools themselves than by the conditions of their operation. Various products built on ArcGIS Online were developed to some extent across many operations, and from a technical standpoint, an environment for data input, accumulation, and visualization had been established. Nevertheless, clear differences emerged in the actual use of these products.
The first factor underlying these differences was the clarity of input responsibility. In the post-earthquake building safety assessment, the survey teams themselves served as data entry actors, and data entry was embedded directly into field operations. In contrast, in shelter and facility management, the actor responsible for updates was not always clearly defined, making data entry and updating more likely to become an additional burden. Second, the fit between update workload and field practice was crucial. Irrespective of the details of the visualization, it is difficult to sustain operations if the effort required for updating is not compatible with the workload of the field staff. Third, connection to meetings and decision-making processes was essential. Even when dashboards existed, visualization tended to remain merely a reference resource unless there were clearly designated actors and settings in which the information could be used to revise plans or allocate resources. Fourth, the presence or absence of a reusable data structure was important. Unless data were organized in forms that included location information and identifiers, it was difficult for them to develop into resources for inter-operational linkage or cross-departmental coordination.
Considered together, these findings suggest that disaster-response DX should be understood less as a matter of technology introduction than as a matter of designing operational arrangements. What is required is not simply the introduction of tools, but the creation of conditions in which information can be entered, accumulated, shared, used for decisions, and, where necessary, connected to other operations.
In addition, these operational conditions may have varied across geographical settings within the city. Urban areas, coastal settlements, and mountain settlements may have differed in field accessibility, communication and data-entry environments, and the availability of personnel responsible for updates; road access and transportation constraints may also have affected the feasibility of data collection, updating, and the use of DX tools. In the post-earthquake building safety assessment, the survey area was expanded from the Wajima district to the entire city, enabling the identification of damage conditions in the Machino and Urakami districts. However, this study did not compare district-level differences in data collection and updates using common indicators. Therefore, the geographical conditions should be interpreted as contextual factors that may influence the establishment of the operational conditions identified in this study.
4.4. Implications for Peacetime Preparedness
A further important point revealed by this case is that many of these operational conditions are difficult to establish adequately through improvised efforts after a disaster has already occurred. Even in cases such as post-earthquake building safety assessment, which functioned relatively well, there were limits to the secondary use of the data for subsequent operations. Similarly, the data linkages required for publicly funded demolitions could not function promptly unless connection mechanisms were designed in advance during peacetime. These findings indicate that cross-operational use is difficult to achieve simply by adding individual tools or interfaces during disasters.
This suggests that disaster response DX should be understood not as a matter of hastily creating new tools after a disaster occurs, but as a matter of preparing in advance, during peacetime, what types of operational information should be maintained, in what formats, and how they should be connected. In particular, if cross-departmental use is anticipated, it is necessary to define the data items to be shared beforehand, identifiers required to connect data across operations, actors responsible for updates, scope of sharing, and meetings or decision-making processes in which such information should be referenced. If these conditions remain ambiguous, the visualization itself may be achieved; however, this is unlikely to lead to actual operation or decision support.
Accordingly, what is important in preparing for disaster response DX is not the mere addition of new screens or interfaces but the prior design of pathways through which information is entered, accumulated, shared, used for decision-making, and, where necessary, connected to other operations. In this sense, the success or failure of disaster-time DX depends not only on post-disaster improvisation, but also on how far data design, role allocation, operational rules, and connections to decision-making have been prepared in advance during peacetime.
4.5. Limitations of This Study
This study has several limitations. First, it is based on a single local government and disaster case study. Therefore, its purpose is not to provide statistical generalization, but rather to offer analytical insights into the conditions that shape the progression of disaster response DX through a detailed examination of its implementation process. This case-based approach is effective for understanding disaster response DX as a staged implementation process and examining the differences in the progression and causes of stagnation across individual operations. However, the processes and conditions identified in this study cannot necessarily be directly applied to other regions.
Second, because this study is a reconstruction of the practice based on collaborative implementation, aspects of the decision-making processes within each operation and user-side evaluation could not be fully traced. Therefore, future studies should further refine the conditions affecting the progression of disaster response DX by comparing cases from other local governments and by closely examining actual usage settings within individual departments.
In addition, this study focused on comparisons across operations and did not systematically analyze differences among the districts within Wajima City. Geographical conditions, including those of urban areas, coastal settlements, and mountain settlements, as well as road access and transportation constraints, may have affected the feasibility of data collection, updating, and use of DX tools; however, these effects were not directly examined. Accordingly, the assessment of each operation may not apply uniformly to all districts within the city, and geographical conditions should be considered when examining the transferability of the findings to other regions. Future studies should relate district-level access conditions to records of data entry and updating, patterns of DX-tool use, and the progress of recovery operations.
5. Conclusion
This study examined the practices implemented in Wajima City, Ishikawa Prefecture, during the 2024 Noto Peninsula Earthquake by comparing five operations—post-earthquake building safety assessment, shelter management, temporary housing, facility management, and publicly funded demolition—to clarify how disaster response DX progressed and what conditions determined its success or failure. The analysis organized each operation in terms of the digitalization of information collection, accumulation of shareable data, situational awareness through visualization, connection to decision support, and the degree of cross-departmental coordination.
The findings are threefold. First, disaster-response DX did not emerge all at once; rather, it progressed through the stages of information collection, data accumulation, visualization, and connection to decision support and cross-departmental coordination. Second, the progression of DX was shaped by the characteristics of each operation: relatively self-contained operations advanced more easily, whereas cross-departmental operations required clearly defined coordinating actors and decision-making settings. Third, the success or failure of disaster response DX depended less on the technology itself than on operational conditions.
These findings suggest that disaster response DX should be evaluated not by the mere presence or absence of digital tools, but by the extent to which it becomes connected to actual practice. In cross-departmental operations, in particular, it is important to define in advance the data items and identifiers to be shared, actors responsible for updates, scope of sharing, and arenas of decision-making. Particularly in operations involving future planning and resource allocation, visualization alone is insufficient; actors and settings that use such information for decision-making must also be institutionally established. In this sense, disaster response DX depends less on the post-disaster addition of new interfaces than on the prior design of pathways through which information flows.
The significance of this study lies in reinterpreting disaster response DX not as the success or failure of individual tools, but in terms of its implementation process and operational conditions. What is truly required in disaster response is not simply the collection of information, but the creation of conditions in which an organization can choose its next course of action based on that information. Therefore, to prepare for future large-scale disasters, DX should be understood not merely as the introduction of technology, but as the peacetime design of data structures and organizational operations.
Acknowledgments
The authors would like to thank the departments and staff of Wajima City, as well as all practitioners and collaborators who supported the implementation of the disaster response DX initiatives analyzed in this study.
- [1] Cabinet Office, “Overview of the 2024 Noto Peninsula Earthquake and the status of local government support,” 2024 (in Japanese). https://www.bousai.go.jp/updates/r60101notojishin/pdf/kensho_team2_shiryo01.pdf [Accessed March 29, 2026]
- [2] Y. Orihashi, S. Suzuki, H. Kuramoto, Y. Ura, and G. Urakawa, “The actual state of data utilization in disaster response in municipalities: Collaborative practice in Wajima City, following the 2024 Noto Peninsula Earthquake,” J. Jpn. Soc. Nat. Disaster Sci., Vol.43, No.3, pp. 619-630, 2024 (in Japanese).
- [3] M. Inoguchi, H. Hayashi, N. Yoshitomi, G. Urakawa, and K. Fujiharu, “Coaching effective operation procedures using GEOINT Database for local disaster responders based on short-term education model,” J. Soc. Saf. Sci., Vol.9, pp. 177-187, 2007 (in Japanese).
- [4] H. Taguchi, M. Hanashima, Y. Mizui, R. Sato, and Y. Usuda, “Information support activities in the Osaka prefecture on the earthquake in Osaka-Fu Hokubu – The first-time dispatch by Information Support Team (ISUT) –,” Report on Major Disasters, Vol.54, pp. 7-15, 2020 (in Japanese).
- [5] R. Sato, K. Yoshimori, S. Yusa, and Y. Usuda, “ISUT’s information support activities in the heavy rain since July 1, 2021,” J. Disaster Res., Vol.19, No.5, pp. 726-732, 2024. https://doi.org/10.20965/jdr.2024.p0726
- [6] Y. Usuda, M. Hanashima, R. Sato, and H. Sano, “Effects and issues of information sharing system for disaster response,” J. Disaster Res., Vol.12, No.5, pp. 1002-1014, 2017. https://doi.org/10.20965/jdr.2017.p1002
- [7] M. Hanashima, R. Sato, and Y. Usuda, “The standardized disaster-information products for disaster management: Concept and formulation,” J. Disaster Res., Vol.12, No.5, pp. 1015-1027, 2017. https://doi.org/10.20965/jdr.2017.p1015
- [8] Y. Usuda, T. Matsui, H. Deguchi, T. Hori, and S. Suzuki, “The shared information platform for disaster management – The research and development regarding technologies for utilization of disaster information –,” J. Disaster Res., Vol.14, No.2, pp. 279-291, 2019. https://doi.org/10.20965/jdr.2019.p0279
- [9] M. Hanashima and Y. Usuda, “Disaster information sharing technology among heterogeneous information systems through SIP4D-ZIP framework,” J. Disaster Res., Vol.18, No.7, pp. 763-769, 2023. https://doi.org/10.20965/jdr.2023.p0763
- [10] J. Wolbers and K. Boersma, “The common operational picture as collective sensemaking,” J. Contingencies Crisis Manag., Vol.21, Issue 4, pp. 186-199, 2013. https://doi.org/10.1111/1468-5973.12027
- [11] K. Kurata, N. Arai, Y. Chiba, T. Uezono, and N. Fukuwa, “The development and practice of a local information sharing system that can be utilized in normal and disaster,” J. Disaster Inf. Stud., Vol.15, No.2, pp. 187-195, 2017 (in Japanese). https://doi.org/10.24709/jasdis.15.2_187
- [12] R. Hamamoto and G. Urakawa, “Development of cloud based GIS to provide information of estimated damaged buildings at early stage in disaster response process,” J. Soc. Saf. Sci., Vol.34, pp. 85-93, 2019 (in Japanese). https://doi.org/10.11314/jisss.34.85
- [13] G. Urakawa, H. Hayashi, and K. Omura, “Development of support tool for creating map to share situational awareness at EOC,” J. Soc. Saf. Sci., Vol.14, pp. 99-109, 2011 (in Japanese). https://doi.org/10.11314/jisss.14.99
- [14] D. Fischer-Preßler, D. Bonaretti, and D. Bunker, “Digital transformation in disaster management: A literature review,” J. Strateg. Inf. Syst., Vol.33, Issue 4, Article No.101865, 2024. https://doi.org/10.1016/j.jsis.2024.101865
- [15] A. David, T. Yigitcanlar, R. Y. M. Li, J. M. Corchado, P. H. Cheong, K. Mossberger, and R. Mehmood, “Understanding local government digital technology adoption strategies: A PRISMA review,” Sustainability, Vol.15, Issue 12, Article No.9645, 2023. https://doi.org/10.3390/su15129645
- [16] V. Jayawardene, T. J. Huggins, R. Prasanna, and B. Fakhruddin, “The role of data and information quality during disaster response decision-making,” Prog. Disaster Sci., Vol.12, Article No.100202, 2021. https://doi.org/10.1016/j.pdisas.2021.100202
This article is published under a Creative Commons Attribution-NoDerivatives 4.0 Internationa License.