Paper:
Detecting Flood Hotspots Associated with Sediment Dynamics in Meandering Rivers Using Basin-Scale Rainfall and Sediment Runoff Modeling
Glaiza J. Visitacion*1
 , Menglu Qin*2,†
, Dhoz E. Arizobal*3
, Rubenito M. Lampayan*3
, Joan Cecilia C. Casila*3
, Patricia Ann J. Sanchez*3
, Roger A. Luyun, Jr.*3, and Miho Ohara*4
, Menglu Qin*2,†
, Dhoz E. Arizobal*3
, Rubenito M. Lampayan*3
, Joan Cecilia C. Casila*3
, Patricia Ann J. Sanchez*3
, Roger A. Luyun, Jr.*3, and Miho Ohara*4
*1Central Bicol State University of Agriculture
San Jose, Pili, Camarines Sur 4418, Philippines
*2International Centre for Water Hazard and Risk Management (ICHARM), Public Works Research Institute
Tsukuba, Japan
†Corresponding author
*3University of the Philippines Los Baños, College
Laguna, Philippines
*4Center for Integrated Disaster Information Research, Interfaculty Initiative in Information Studies, Institute of Industrial Science, The University of Tokyo
Tokyo, Japan

Understanding hydro-sediment dynamics is critical to developing effective flood mitigation strategies in river basins with high sediment loads. This study aimed to assess the rainfall-runoff and sediment transport processes in the Santa Maria Watershed, Laguna, to identify flood hotspots. We employed the Rainfall–Sediment Runoff (RSR) model, which integrates a distributed rainfall–runoff model with a unit channel-based sediment transport model. The model was configured using watershed geomorphological data and validated using field-observed water levels and suspended sediment concentrations from September to December 2024. The simulation identified pronounced bed aggradation at two major meander bends in the plain area, highlighting these as potential high-risk sections for future flooding along the main river. Furthermore, the model identified the primary flood hotspots in agricultural lowlands away from the main river, caused by overflow from abandoned channels and a major tributary confluence. These results demonstrate that the RSR model is an effective tool for identifying flood hotspots linked to both sediment-driven geomorphological changes and complex topographic features. This is crucial for devising targeted mitigation strategies for vulnerable communities.
1. Introduction
Sediment transport in river basins is a complex hydrological and morphological process influenced by natural factors such as climatic patterns and geological conditions, as well as by human-induced environmental changes 1. Similarly, rainfall-runoff processes that cause soil erosion are influenced by several factors, including rainfall characteristics, vegetation types, and land preparation techniques 2. During rainfall, part of the precipitation is intercepted and evaporates before reaching the surface or infiltrates the soil, whereas the remaining portion becomes runoff, flowing over the soil surface toward the nearest water body. As water moves across the ground surface, it accumulates sediment and delivers it to streams or rivers.
Excessive sediment in channels is a major concern in both river and flood risk management because it directly impacts the storage capacity and lifespan of reservoirs, canals, drainage channels, harbors, and other downstream structures and river works 3. The combined effects of excessive sediment production, rapid sediment transport, and sediment deposition have become critical issues requiring appropriate management strategies 4.
Excessive sediment loading from erosion in upper watersheds reduces the water retention capacity of basins, which increases flood risks in floodplain areas, as observed in Laguna de Bay and its watersheds 5. According to the assessment of the lake’s water retention service, part of the ecosystem accounts developed by the Laguna Lake Development Authority, following the UN guidelines for Experimental Ecosystem Accounting and supported by the World Bank-led Wealth Accounting and the Valuation of Ecosystem Services program, flood damage in the areas around the lake occurred at water levels of 12.5 m and higher. The impact of Typhoon Ketsana (Ondoy) in 2009 highlighted this vulnerability, as water levels rose to 13.8 m, causing losses estimated at PHP 6 billion (roughly US$ 124 million). Among the areas most affected by this extreme flooding event was the Santa Maria Watershed, a sub-watershed in the eastern section of Laguna de Bay. With flood levels reaching the downstream levee and meandering sections of the Santa Maria River, 20,223 individuals and 4,876 families were affected 6.
To mitigate flood risks, the proposed solutions include prohibiting new settlements in the most flood-prone regions of the lake, particularly below the 12.5-meter elevation, and ideally below 13.5 m, as well as reducing sedimentation in the watershed 5. Sediment loading in lakes, which directly contributes to reduced water retention capacity, is linked to sediment transport processes in rivers connected to the lake. This study aimed to investigate the relationship between flooding in the floodplain areas of the lake and sediment transport processes occurring through the levee and meandering sections of the river, specifically in the case of the Santa Maria River, the second largest tributary of the lake.
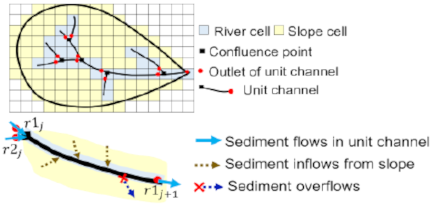
Fig. 1. The structure of the Rainfall-Sediment-Runoff (RSR) model (source: Qin et al. 7).
2. Methodologies
2.1. Structure of Rainfall and Sediment Runoff Analysis
The rainfall and sediment runoff analysis was conducted using the Rainfall–Sediment Runoff (RSR) model proposed by Qin et al. 7. The RSR model 4 integrates a distributed rainfall–runoff model 8 with a unit channel sediment–runoff model 9, as illustrated in Fig. 1. The model framework consists of grid cells representing mountains, hillslopes, and floodplain areas to simulate rainfall–runoff processes and sediment production, together with unit channels defined as the river reaches between two consecutive confluence points. Each unit channel had an upstream inlet cell that aggregated multiple inflows and a downstream outlet cell for a single outflow. In addition, the sediment generated by hillslope erosion was evaluated using the hillslope erosion model proposed by Qin et al. 10, as shown in Fig. 2.
Hillslope erosion considers the erosion/deposition and transportation of suspended sediment due to surface flow forming at the slope areas of the study area and delivery into the unit channel as lateral inflows with the water. Within each unit channel, changes in bed elevation were calculated by evaluating the sediment budget. If the net balance of the inflows and outflows is negative, bed degradation occurs, whereas a positive balance results in aggradation.
2.2. Governing Equations for Rainfall–Runoff and Sediment Production and Transport Processes in the River Basin
Rainfall-runoff analysis followed the method proposed by Sayama et al. 8. For the surface flow on slopes and river flow in the channel, the momentum equations were approximated using the diffusion wave approach in two dimensions and one dimension, respectively. Darcy’s law calculates the lateral subsurface flow in mountainous areas, whereas the vertical infiltration in plains is calculated using the Green–Ampt equation.
Sediment transport within a river network considers both bedload and suspended sediment components. The sediment supply and loss for each unit channel were evaluated through interactions between river flow and surface flow from adjacent slopes. When surface inflow occurs, sediment is supplied to the unit channel based on the sediment concentration in the inflowing water. Conversely, when overflow occurs, the sediment is transported to the slope area by overflow water, which has the same suspended sediment concentration as the river flow, resulting in sediment loss from the unit channel.
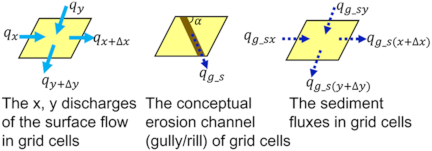
Fig. 2. Hillslope erosion model (source: Qin et al. 10).
The mass conservation equation of the riverbed sediment is as follows:
A simplified convection equation was used to calculate the concentration of suspended sediment within the unit channel.
The hillslope erosion process is evaluated by assuming that it will occur on the conceptual sediment path due to the surface flow in each grid cell. The flow discharge in the sediment path is calculated from the surface flow in the occupied grid cell according to Eq. \(\eqref{eq:3}\), based on its angle with the \(x\)-axis and its width.
The sediment transport process in the slope area is evaluated by the following convection equation. The sediment path descends in the same direction as the occupied grid cell and connects to the lowest elevation grid cell of its surrounding grid cells; that is the network of sediment paths is formed according to the topographic conditions of the slope area and is set as the initial condition for the calculation.
The rate of bedload sediment transport is evaluated using the following equation developed by Egashira et al. 11:
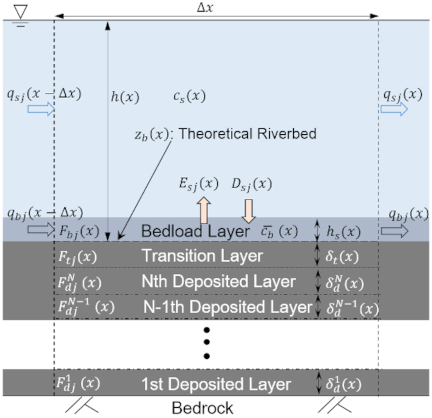
Fig. 3. Sediment flows and riverbed structure (source: Qin et al. 7).
The model quantifies the erosion rate of the suspended sediment, drawing upon the concept of entrainment velocity within the context of a density-stratified flow, using the following equation introduced by Harada et al. 12.
The deposition rate of suspended sediment is evaluated using the following equation.
Vertical sorting of sediment sizes in the riverbed was performed using the multilayer model developed by Takebayashi 15 and modified by Qin et al. 7, as illustrated in Fig. 3. This model employs mass-conservation equations and a sorting algorithm to analyze the sorting process within a multilayer framework.
Mass conservation equation of size class-\(j\) sediment in the bedload layer.
Mass conservation equation of size class-\(j\) sediment in the transition layer.
The sorting algorithm of the sorting process in the multilayer model.
3. Study Area and Calculation Conditions
3.1. Study Area
The Santa Maria Watershed is located between 14.339°N and 14.576°N and 121.346°E and 121.481°E. It encompasses the municipalities of Jala-Jala, Pililia, and Tanay in Rizal Province; Mabitac, Pakil, Pangil, and Santa Maria in Laguna; and Real in Quezon. The majority of the watershed area is located within the municipality of Santa Maria, accounting for 49.75% of the total area, followed by Mabitac at 25.95%.
This watershed is a catchment in the Philippines that is particularly vulnerable to flooding and rain-induced landslides. It has an average annual flow of approximately 12.7 m\(^3\)/s 16, making it the second-largest freshwater contributor to Laguna Lake, with a total catchment area of 205 km\(^2\).
3.2. Field Observations
For model calibration and validation, field measurements of the water level and sampling of soil and water were performed at the sampling sites shown in Fig. 4.
Water surface elevations were recorded from a bridge in Barangay Bayanihan, Mabitac, Laguna (14°25.486\('\)N, 121°25.701\('\)E). The bridge has an established ground control point (GCP), and the distance from the bridge to the water surface was used to determine the water level. Water level measurements and water sampling were conducted hourly during rainfall events from 7:00 to 18:00 on October 6, 11:00 on October 13 to 19:00 on October 14, 12:00 on October 21 to 5:00 on October 22, 9:00 to 17:00 on November 11; 12:00 on December 1 to 17:00 on December 2, 00:00 on December 10 to 23:00 on December 11, and 8:00 on December 26 to 7:00 on December 27, 2024.
Water samples were collected immediately after each water-level measurement. These samples were analyzed within 24 hours at an Analytical Services Laboratory to determine total suspended solids (TSS) concentrations.
Sediments in the catchment area were characterized through field sampling and image-based analysis of the downstream, midstream, and upstream portions of the Santa Maria River. Soil samples were obtained from the main sources of sediment supply in the channel, specifically the riverbed, riverbank, hillslope, and landslide sites located in the upstream section of the river. The midstream sampling site is located in Barangay Adia, Santa Maria, Laguna (14.4248°N, 121.4358°E), while the upstream sampling site is near the RMC Agro Venture in Barangay Bagumbayan, Santa Maria (14.5176°N, 121.4422°E). The results of sediment characterization, including sieve and hydrometer tests and image-based analysis, were used to determine the grain size distributions (GSDs) of sediments from different sources along the channel.
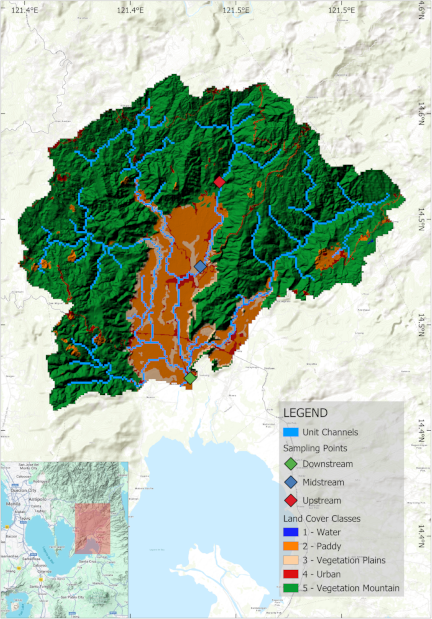
Fig. 4. Location map with the reclassified land cover of the Santa Maria Watershed.
3.3. Calculation Conditions
A digital terrain model (DTM) derived from interferometric synthetic aperture radar and a land-cover map from 2020, produced using Sentinel-2 satellite imagery with ground validation provided by National Mapping and Resource Information Authority (NAMRIA), were used in this study. To optimize computational efficiency, the digital elevation model (DEM) generated from the DTM was upscaled to a resolution of 90 m \(\times\) 90 m, and the land cover was reclassified into five categories, as shown in Fig. 4. The land cover classifications included (1) inland waters, (2) areas for annual crop production or paddy, (3) plain vegetation, (4) built-up or urban areas, and (5) mountain vegetation. Lands with natural vegetation (3) and (5) were reclassified into two categories depending on whether the elevation was lower or higher than 20 m.
Table 1. Land cover reclassification.

Table 2. Hydrological parameters.

Table 1 presents the relationship between the reclassified land cover and the original classifications, whereas Table 2 displays the corresponding hydrological parameters that were calibrated and applied to the rainfall-runoff analysis conducted in this study.
Owing to the lack of weather stations within the catchment area, rainfall data were obtained using a proxy download program connected to the Global Satellite Mapping of Precipitation (GSMaP) provided by the Japan Aerospace Exploration Agency. An hourly rainfall dataset from the GSMaP was downloaded, covering rainfall events from November to December 2022 and from September to December 2024, including the periods affected by typhoons. Hourly rainfall data from November to December 2022 were used for model calibration, as shown in Fig. 5.
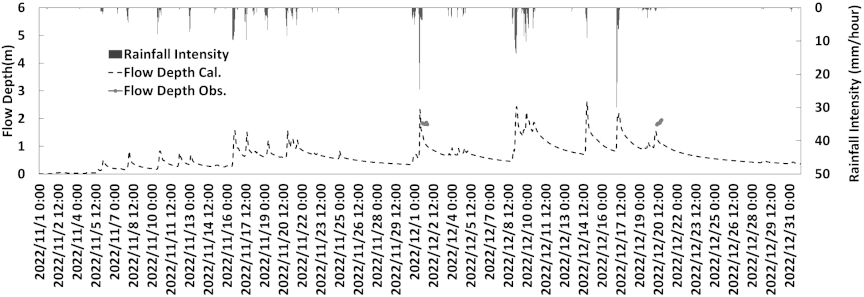
Fig. 5. Calibration results for water depths of the Santa Maria River at the bridge in Mabitac.
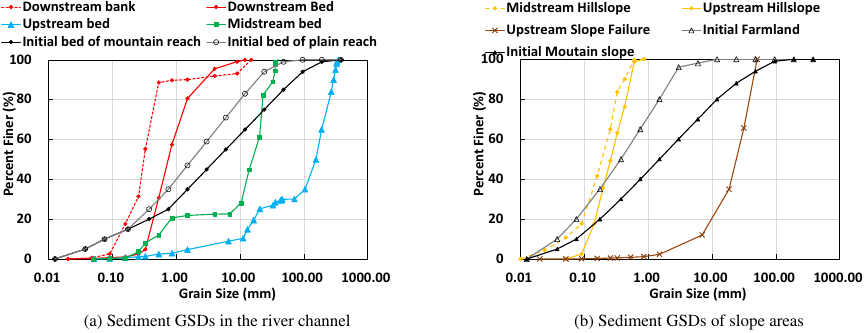
Fig. 6. Observed and initial grain size distributions of the sediment in the river channel and slope areas.
The geometry of the river channel was established using the regime laws to determine its width and depth. However, to align with field observations, the channel capacity and slope of the riverbed were manually adjusted. Three cross-sectional profiles taken downstream, midstream, and upstream were utilized to refine the parameters set by the regime laws. The river slope was derived from longitudinal profiles obtained from Google Earth Pro, categorizing the river into various sections: levee, lower meandering, upper meandering, and upstream segments moving downstream to upstream. In addition, a DEM was manually modified to ensure accurate representation of the riverbed slope for each section.
The initial GSDs of the riverbed sediment and slope soil were determined from field measurements to characterize sediment properties across the entire catchment. The initial GSDs applied in the model and the results of the field surveys are presented in Fig. 6.
4. Results and Discussion
4.1. Validation of the Results of Rainfall and Sediment Runoff Simulation
Figure 7 presents time series plots of the simulated discharge and a comparison between the simulated and observed flow depth results for the study period from September to the end of December 2024. A four-month analysis of rainfall and sediment runoff was conducted. Most of the calculated water depths showed good agreement with the observations; however, some underestimations were considered because of the underestimation of the rainfall intensity from the GSMaP dataset.
Notable events, including those on October 13–14, October 21–22, December 1–2, and December 10–11, showed good agreement between the simulations and observations. The peak rainfall during Typhoon Kristine (Tropical Storm Trami) at 17:00 October 22 reached 22 mm/h, leading to a discharge peak of 169 m\(^3\)/s at 00:00 October 23, indicating a seven-hour lag.
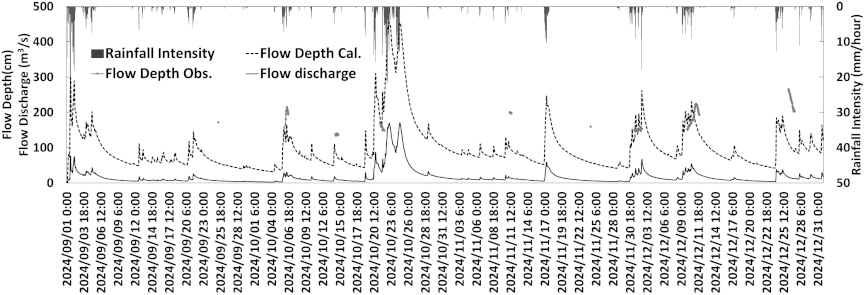
Fig. 7. Comparison of simulated flow depth and observed flow depths at the bridge in Mabitac.
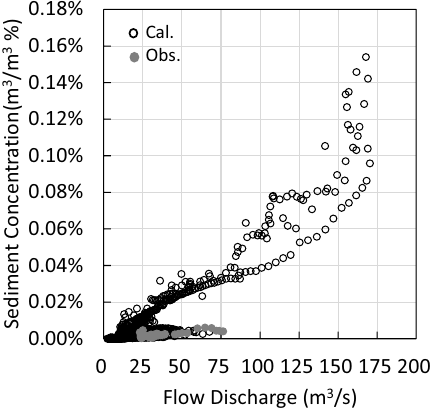
Fig. 8. Comparison of simulated SSC-flow discharge relationship with the observations at the bridge in Mabitac.
Figure 8 illustrates the relationship between suspended sediment concentration (SSC) and flow discharge at the bridge in Mabitac. The simulation results closely match the observations. For small-to-moderate flood events, both simulated and observed data indicated a linear correlation between flow discharge and SSC. However, in the case of large flood events, this relationship becomes nonlinear, indicating that a simple correlation equation fails to accurately describe sediment flow dynamics. Notably, no observational data were acquired during high-flow discharge periods (particularly \({>}150\) m\(^3\)/s) to validate the high SSC predicted by the simulation. Despite the lack of validation data, we conclude that the results are reasonable because the highest volumetric sediment concentration predicted by the model is lower than 0.16%. This is an acceptable magnitude for floodwater sediment concentration. Although the absolute accuracy remains unverified owing to a data gap, the model appropriately reproduced the trend and behavior of the water and sediment flows in the study river. Additionally, given the highly non-equilibrium nature of the suspended load, future efforts to enhance the prediction accuracy in the studied river basin should carefully investigate the channel conditions (width, depth, and sediment texture) in the main tributaries and incorporate these conditions into the model.
These results emphasize the need to adopt physically based mechanism models, such as the RSR model, to quantitatively assess sediment runoff effectively during intense flooding scenarios. This approach not only enhances the understanding of sediment transport but also aids in the development of more reliable predictive frameworks for watershed management.
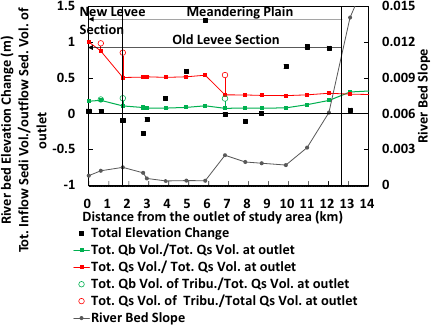
Fig. 9. The channel conditions and behavior of sediment flows associated with bed variation in the plain area of the Santa Maria Watershed (the location of the section is shown in Fig. 10 indicated by a black arrow).
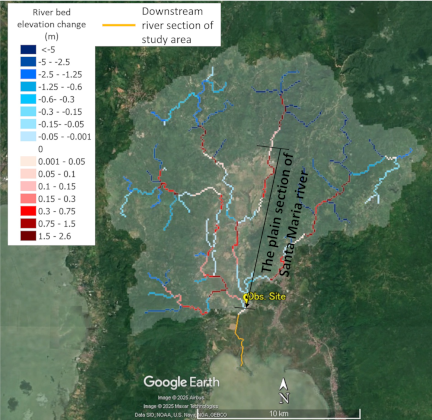
Fig. 10. The riverbed elevation changes at the end of the simulation.
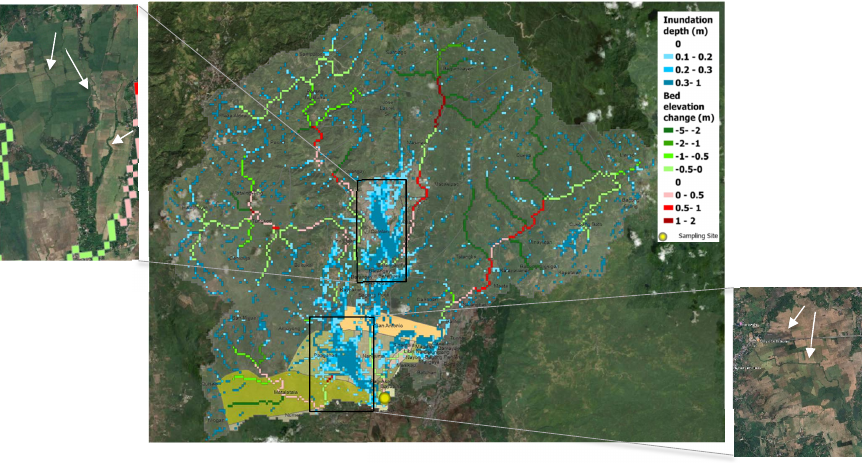
Fig. 11. Simulated inundation depth and riverbed elevation change at the peak discharge time 00:00 on October 23, 2024, of Typhoon Kristine in Mabitac, Laguna. (White arrows denote abundant channels of the original meandering river system, which are now used as irrigation channels in the present landscape.)
4.2. The Behavior of Sediment Transport and Bed Elevation Changes in the Meandering Plain
Owing to limited observational data, Fig. 9 is used to qualitatively investigate the sediment transport behavior in the plain section of the main river (indicated by the black arrow in Fig. 10). Fig. 9 presents the longitudinal changes in the total transported volumes of bedload and suspended sediment normalized by the total suspended sediment volume at the outlet of the study catchment area.
The results indicate that the Santa Maria River is primarily characterized by suspended sediment transport in its plain section because the suspended sediment volume significantly exceeds the bedload. Furthermore, suspended sediment increased continuously in the downstream direction, with substantial increases after the tributary confluences (tributary sediment inflows are marked by circles at confluence points in Fig. 9). Conversely, sections exhibiting high bed aggradation—specifically, 5–6 km and 10–12 km upstream of the outlet—showed a decreasing trend in bedload transport volume. As shown in Fig. 10, pronounced bed aggradation occurs at two major meander bends in the plain area: one near the beginning of the plain reach and another following the first confluence point. These results suggest that most sediment originating from mountainous areas enters the plains as a suspended load, travels through the plain reach, and eventually reaches the lake. However, in some large meandering sections, bedload deposition may substantially reduce channel capacity.
Regarding the magnitude of the bed aggradation, the results likely presented an overestimation owing to the initial model settings. The initial riverbed sediment depth was uniformly set at 5 m for all unit channels. The simulation results (Fig. 10) show that some upstream end channels eroded the entire 5 m depth, which is likely excessive. Consequently, the simulated sediment transport from the mountainous area to the plain may exceed reality, leading to an overestimation of aggradation caused by the deposition of relatively coarse sediment transported as bedload in the plain area. Although the appropriate initialization of riverbed sediment depths remains a topic for further discussion, these simulation results remain valuable for risk assessment. Given the historical records of landslides in the Santa Maria River basin, extreme events have the potential to deliver massive amounts of sediment from the mountain slope into the overeroded upstream unit channels simulated in this study. Such events would trigger a severe reduction in channel capacity in the sections predicted in this study, and subsequent flood damage in the plain area.
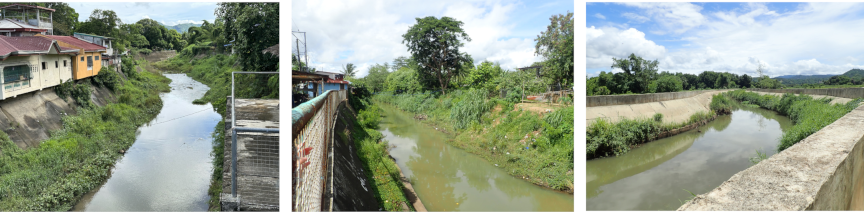
Fig. 12. River channel conditions in the floodplain section of Santa Maria River (left: old concrete-lined section in upper floodplain; center: straightened mid-reach; and right: newly constructed levee in downstream meandering section).
4.3. The Characteristics of Flood Hotspot Distribution
The simulated inundation event on October 23 revealed significant flooding throughout most lowland areas of the basin. Reports from Barangay officials in Bayanihan, located in the municipality of Mabitac—where the sampling site is situated—indicate that peak flow inundation depths in the region reached between 0.6 m and 1 m. These findings aligned with the simulation results, which showed that the surface inundation depths ranged from 0.5 m to 0.8 m. During this period, the local government unit (LGU) of Mabitac, Laguna, issued advisories based on the Red Warning Level declared by the PAGASA, indicating heavy rainfall. The LGU confirmed flooding in the municipality, particularly impacting the barangays of Pagasa, Bayanihan, Lambac, Sinagtala, Libis ng Nayon, San Antonio, Nanguma, as well as parts of Matalatala, Numero, and Paagahan.
As shown in Fig. 11, these areas primarily consist of lowland rice fields and the town center, which are typically susceptible to flooding during storm events. In the upper reaches of the basin, above the first confluence point of the main channel, most of the inundated areas are rice fields characterized by meandering plains.
Figure 11 highlights two major inundated areas: one located in the farmlands upstream of the first confluence point, and the other surrounding the confluence of the two tributaries flowing through the western part of the catchment. The simulation results indicated that the upstream farmland area was inundated owing to overflow from accumulated water in the abandoned channels of the meandering river system, which are currently used as irrigation canals or ponds. In contrast, the inundation around the western confluence area was caused by overflow from both rivers and abandoned channels.
The characteristics of these inundation hotspots show that higher inundation depths tend to occur away from the main river channels, concentrating on agricultural lowland areas. This finding suggests that the flood-prone zones in the Santa Maria River basin are primarily farmlands.
Conversely, the meandering plain reach of the mainstream Santa Maria River has been fully channelized and protected by high levees, as shown in Fig. 12. Although the simulation results revealed significant sediment deposition at the two large meander bends, no overflow from the main river channel occurred during the simulated flood events. Nonetheless, these zones of pronounced sediment aggradation should be considered potentially high-risk areas for future flooding along the main river.
5. Conclusion
This study successfully analyzed the rainfall-runoff and sediment transport dynamics of the Santa Maria Watershed to identify flood hotspots using the RSR model. The simulation duration was from September to December 2024 and included Typhoon Kristine. The model was validated using water level and sediment concentration data obtained from minor floods that occurred during that period.
This analysis yields critical findings for flood risk management in this basin. A significant result was the identification of pronounced bed aggradation at the two major meander bends within the plain section of the river. Although the high levees in this reach did not overflow during the simulated period, the sediment deposition actively reduced channel conveyance capacity and represented an emerging high-risk section for future flooding along the main river. Concurrently, the simulation identified the primary current flood hotspots as located in the agricultural lowlands away from the main leveed channel. This inundation was caused by complex local topography, specifically overflow from abandoned river channels and a major western tributary confluence.
The key implication of this study is that flood mitigation in the Santa Maria Watershed must address this dual risk: immediate, topographically driven flooding in farmlands and emerging, sediment-driven risk in the main channel’s meanders. A mitigation strategy focused solely on main channel levees would fail to protect the most vulnerable lowland areas.
Acknowledgments
This research was supported by “The Project for Development of a Hybrid Water-Related Disaster Risk Assessment Technology for Sustainable Local Economic Development Policy under Climate Change in the Philippines” (HyDEPP), under the Science and Technology Research Partnership for Sustainable Development (SATREPS) between Japan and the Philippines, funded by the Japan International Cooperation Agency (JICA) and the Japan Science and Technology Agency (JST). This study was also supported by Engineering Research for Development and Technology (ERDT) under the Department of Science and Technology, Science Education Institute (DOST-SEI).
- [1] P. Tian et al., “Sediment yields variation and response to the controlling factors in the Wei River basin, China,” Catena, Vol.213, Article No.106181, 2022. https://doi.org/10.1016/j.catena.2022.106181
- [2] Y. Yu, W. Wei, L. Chen, T. Feng, and S. Daryanto, “Quantifying the effects of precipitation, vegetation, and land preparation techniques on runoff and soil erosion in a Loess watershed of China,” Science of the Total Environment, Vol.652, pp. 755-764, 2019. https://doi.org/10.1016/j.scitotenv.2018.10.255
- [3] L. Samiyev, D. Allayorov, D. Atakulov, and F. Babajanov, “The influence of sedimentation reservoir on hydraulic parameters of irrigation channels,” IOP Conf. Series: Materials Science and Engineering, Vol.883, Article No.012031, 2020. https://doi.org/10.1088/1757-899X/883/1/012031
- [4] M. Qin, D. Harada, and S. Egashira, “Modeling of sediment transport processes in drainage basins,” Proc. of the 39th IAHR World Congress, pp. 718-727, 2022. https://doi.org/10.3850/IAHR-39WC2521711920221422
- [5] Wealth Accounting and the Valuation of Ecosystem Services (WAVES), “Increasing flood risk at Laguna de Bay need to be urgently addressed,” WAVES Philippines Policy Brief, 2017.
- [6] Government of the Philippines, “Philippines: Thousands still affected as Laguna braces for long road to recovery,” ReliefWeb, 2009. https://reliefweb.int/report/philippines/philippines-thousands-still-affected-laguna-braces-long-road-recovery [Accessed March 24, 2026]
- [7] M. Qin, D. Harada, and S. Egashira, “Influences of hillslope erosion on basin-scale sediment transport processes,” Proc. of the 40th IAHR World Congress, pp. 2832-2841, 2023. https://doi.org/10.3850/978-90-833476-1-5_iahr40wc-p1223-cd
- [8] T. Sayama, G. Ozawa, T. Kawakami, S. Nabesaka, and K. Fukami, “Rainfall–runoff–inundation analysis of the 2010 Pakistan flood in the Kabul River basin,” Hydrological Sciences J., Vol.57, No.2, pp. 298-312, 2012. https://doi.org/10.1080/02626667.2011.644245
- [9] S. Egashira, T. Itoh, K. Horie, and N. Nishimoto, “A method to predict sediment transport process in drainage basin with dams,” River, Coastal and Estuarine Morphodynamics: RCEM 2007, Vol.2, pp. 1193-1201, 2007.
- [10] M. Qin, D. Harada, and S. Egashira, “Prediction of sediment transport process in river basin focusing on the effect of hillslope erosion,” Japanese J. of JSCE, Vol.80, No.16, Article No.23-16088, 2024 (in Japanese). https://doi.org/10.2208/jscejj.23-16088
- [11] S. Egashira, K. Miyamoto, and T. Itoh, “Constitutive equations of debris flow and their applicability,” Debris-Flow Hazards Mitigation: Mechanics, Prediction, and Assessment (Proc. of the 1st Int. Conf.), pp. 340-349, 1997. https://doi.org/10.13140/2.1.4623.7122
- [12] D. Harada, S. Egashira, T. S. Ahmed, and H. Ito, “Entrainment of bed sediment composed of very fine material,” Earth Surface Processes and Landforms, Vol.47, No.13, pp. 3051-3061, 2022. https://doi.org/10.1002/esp.5442
- [13] S. Egashira and K. Ashida, “Studies on the structures of density stratified flows,” Bulletin of the Disaster Prevention Research Institute, Vol.29, No.4, pp. 165-198, 1980.
- [14] W. W. Rubey, “Settling velocities of gravels, sand and silt particles,” American J. of Science, Vol.s5-25, No.148, pp. 325-338, 1933. https://doi.org/10.2475/ajs.s5-25.148.325
- [15] H. Takebayashi, “River configuration in middle-lower reach of river basin,” J. of Japan Society of Fluid Mechanics, Vol.24, No.1, pp. 27-36, 2005 (in Japanese). https://doi.org/10.11426/nagare1982.24.27
- [16] Laguna Lake Development Authority, “Volume 9, Sta. Maria Sub-basin,” Laguna Lake Development Authority, “Hydrologic Atlas of the 24 Sub-Basins of Laguna de Bay,” 2012. https://llda.gov.ph/wp-content/uploads/2019/09/Vol_09.Sta-Maria-SB.pdf [Accessed October 18, 2023]
This article is published under a Creative Commons Attribution-NoDerivatives 4.0 Internationa License.