Paper:
Advancing Flood and Sediment Inflow Monitoring in Laguna Lake Through Basin-Scale Rainfall–Sediment Runoff Modeling
Dhoz E. Arizobal*1
 , Menglu Qin*2,†
, Glaiza J. Visitacion*3
, Rubenito M. Lampayan*1
, Ronaldo B. Saludes*1
, Miho Ohara*4, and Roger A. Luyun, Jr.*1
, Menglu Qin*2,†
, Glaiza J. Visitacion*3
, Rubenito M. Lampayan*1
, Ronaldo B. Saludes*1
, Miho Ohara*4, and Roger A. Luyun, Jr.*1
*1Institute of Agricultural and Biosystems Engineering, University of the Philippines Los Banos
Batong Malake, Los Baños, Laguna 4031, Philippines
*2International Centre for Water Hazard and Risk Management (ICHARM), Public Works Research Institute
Tsukuba, Japan
†Corresponding author
*3College of Engineering and Food Science, Central Bicol State University for Agriculture
Pili, Philippines
*4Center for Integrated Disaster Information Research, Interfaculty Initiative in Information Studies, Institute of Industrial Science, The University of Tokyo
Tokyo, Japan

The escalating turbidity in the eastern basin of Laguna Lake poses a critical challenge driven by excessive sediment inflow. This study addresses the issue by utilizing a basin-scale rainfall and sediment runoff model to enhance flood and sediment monitoring in the lake. It focused on one of the significant sediment contributors on the eastern basin of Laguna Lake, the Pagsanjan River basin, specifically the Balanac River. The model utilized satellite rainfall data, land cover, and topography. A key refinement involved incorporating distinct grain size distributions for the plain and mountain areas derived from field and laboratory analyses to accurately capture varied sediment transport behaviors. The model’s findings reveal a predominant suspended sediment load in the plain area of the Balanac River. Crucially, the study demonstrates that a significant portion of these sediments bypass in-river deposition and are transported directly into Laguna Lake, a process exacerbated during extreme rainfall events. Furthermore, anthropogenic modifications such as increased channel capacity, channel straightening, and concrete channel lining have significantly altered river channel conditions. These changes enhance shear stress during flood events, suppress suspended sediment deposition in the plain reach, thereby accelerating sediment delivery to Laguna Lake. This integrated modeling approach offers a valuable tool for understanding and predicting flood and sediment dynamics, providing crucial insights for water resource management, sediment control strategies, and informed decision-making to safeguard the health and functionality of Laguna Lake and similar vital water bodies.
1. Introduction
For decades, Laguna Lake has supplied and sustained the livelihoods of more than 50 million people within its periphery. It is used for fisheries, flood control, reservoirs, hydropower, agriculture and irrigation, industrial cooling, domestic water supply, and as a sink for solid and liquid waste 1. However, the lake is at risk of losing capacity owing to increased sediment loading from its 22 tributaries. Siltation is a critical concern that affects the conditions of Laguna Lake. Over the past four decades, the average depth of the lake decreased from 10 m to 3 m 2. With the increasing influx of sediments, pollutants, and waste, Laguna Lake is at risk of volume loss, particularly in its eastern sector, which is farthest from the lake’s western outlet at the Pasig River. In 2016, the Laguna Lake Development Authority identified sediment accumulation as the primary factor contributing to the lake’s deterioration. Laguna Lake plays a crucial role in sustaining communities along its periphery by providing vital resources and serving as an essential component of local civilization 3.
The Pagsanjan River contributes approximately 35% of the total inflow to Laguna Lake. Given this significant contribution, the river is expected to be the focus of extensive hydrological and sediment monitoring efforts. Hazard Mapping of the Philippines using the LiDAR (Phil-LiDAR) program 4 included the Pagsanjan River system as one of the mapped locations; however, the simulations conducted were limited to flood modeling using HEC-HMS and HEC-RAS. A previous SedNet modeling study estimated that the Balanac River contributes about 70% (161.2 kt/year) of the total sediment load, considerably exceeding the 23% (53.6 kt/year) attributed to the Bumbungan River 5. However, this assessment focused solely on the suspended sediment loads. To date, no studies have comprehensively examined basin-scale sediment transport processes within the Pagsanjan River system.
The lack of such integrated studies limits the ability to identify the underlying causes of the increased sediment inflow to Laguna Lake, thereby hindering the development of effective mitigation strategies and reliable future sediment load projections.
This gap highlights the uncertainty surrounding the development and implementation of effective mitigation measures. The objective of this study is to address this gap by revealing the characteristics and transport processes of sediment flow toward Laguna Lake through basin-scale analysis. In addition, this study acts as a framework for monitoring sediment inflow that can be applied to other river systems surrounding Laguna Lake.
Site inspections and preliminary analyses indicate that the Balanac River system lacks adequate flow and sediment monitoring infrastructure, making it a priority location for the implementation of a rainfall–sediment runoff modeling approach.
2. Study Area
Pagsanjan is derived from the word “pinágsangahán,” meaning “branching” or “junction,” and was shortened to “pagsanjan” by the Spaniards. The Balanac River is one of the main tributaries of the Pagsanjan River and receives water from the area west of Pagsanjan and Mount Banahaw, which contributes most of the sediment production in the river basin. The catchment area encompasses the southwestern portion of the Pagsanjan River basin. Approximately 10 km upstream of the outlet to Laguna Lake, the confluence of the Balanac and Bumbungan Rivers forms the Pagsanjan River, which drains into Laguna Lake 6. This study focused solely on the Balanac River and its upstream tributaries. This is because the availability of observational data within the Bumbungan River is limited compared with that of Balanac, as no water level or discharge measurements exist either within the river itself or downstream of the confluence. More importantly, the upstream portion of the Bumbungan River has been modified by the construction of a reservoir that diverts water into another basin. As a result, the discharge of the Bumbungan River is relatively small compared with that of the Balanac River. Consequently, the primary sediment load of the Pagsanjan River system is derived from hillslope, bank, and gully erosion 4. The watershed area is illustrated in Fig. 1. The sub-basin has an area of approximately 186 km\(^{2}\), with a max elevation of 2,132.21 m. Three sampling locations along the river with varying elevations were selected for data collection. The first site is the Balanac Bridge (14.2718°N, 121.4557°E), which is equipped with a ground control point (GCP) that serves as a reference point for monitoring water levels. The second sampling point, located upstream of the bridge, is the Pagsanjan River Campsite (14.2267°N, 121.4608°E). The third upstream site is the Agarao Bridge in Magdalena (14.1955°N, 121.4440°E).
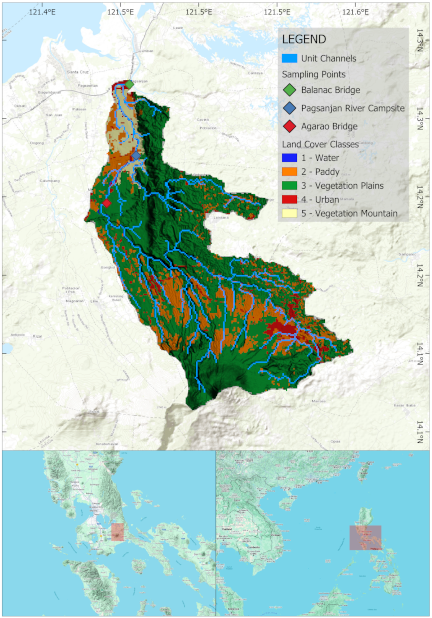
Fig. 1. Watershed and land cover area.
Table 1. Land cover reclassification.

Table 2. Hydrological parameters.

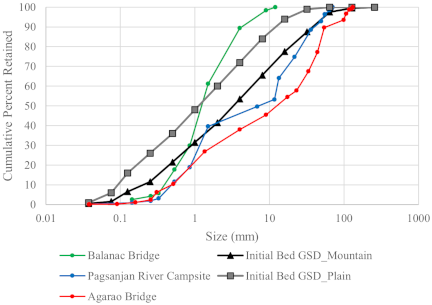
Fig. 2. Observed and initial grain size distribution of riverbed sediment.
3. Computation Conditions
Land cover data from the National Mapping and Resource Information Authority (NAMRIA) was reclassified into five categories. The land cover map was incorporated into the catchment area map, as shown in Fig. 1. The resulting five land-cover classes consolidated the multiple categories found in the original dataset. Table 1 shows the land cover reclassification, and the corresponding hydrological parameters calibrated and applied for the rainfall–runoff analysis in this study are listed in Table 2.
The 5 m-resolution digital terrain model derived from interferometric synthetic aperture radar and upscaled to a 90 m resolution was used to construct the catchment model of the study area. River width and depth in the model were calibrated using the regime law for natural bank sections. Moving downstream, the Balanac River shows clear evidence of channel modifications and levee construction, particularly near the Balanac Bridge and extending toward Laguna Lake. Cross-sectional measurements indicated that the river geometry differed significantly from the dimensions predicted by the regime-based formulations. To account for these discrepancies, manual adjustments were carefully applied to the downstream levee sections to ensure that the model accurately represented the observed changes in the river cross section. The observed grain-size distribution (GSD) of the riverbed sediment, together with the initial GSDs of the riverbed sediment in the mountainous and plain regions used in the model, are shown in Fig. 2.
Rainfall data for the model were obtained from Global Satellite Mapping of Precipitation, a product of the Japan Aerospace Exploration Agency. Hourly rainfall data from November to December 2022 were used for the simulations.
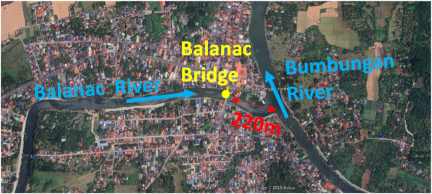
Fig. 3. Location of Balanac Bridge.
4. Methodologies
4.1. Observations for Rainfall and Sediment Runoff Modeling
Field measurements were conducted to provide data for model calibration and validation; the locations of the sites are shown in Fig. 1.
At the Balanac Bridge site (Fig. 3), hourly observations of the water level and suspended sediment concentration were conducted during flood events from 16:00 on December 1 to 01:00 on December 2, 2022, and from 10:00 to 19:00 on December 20, 2022.
Water-level measurements were obtained from the center of the Balanac Bridge, where a GCP was used to standardize the elevation reference. The measurements were taken using a tape from the bridge deck to the water surface.
The water samples were collected, placed in chilled containers, and transported to the laboratory for analysis of TSS. To minimize sample degradation, samples were sent to the laboratory within 24–36 h.
GSD measurements of the riverbed sediment were conducted at three sites located from upstream to downstream, as shown in Fig. 1. For sediment particles larger than 12 mm, image-based analysis was performed using Basegrain software 7, whereas for particles smaller than 12 mm, conventional sieve analysis was applied. The final GSD curves obtained by combining the results of both methods are presented in Fig. 2.
4.2. Modeling of Basin-Scale Rainfall Runoff and Sediment Transport Processes
The Rainfall and Sediment Runoff Model proposed by Qin et al. 8 was applied to the basin-scale rainfall and sediment runoff analysis. The model combines a distributed rainfall-runoff model 9 with a unit channel-based sediment transport model 10. An individual unit channel is defined as a line element with one upstream inlet cell receiving multiple inflows and one downstream outlet cell representing a single outflow 11.
Figure 4 shows a schematic diagram of the Rainfall and Sediment Runoff model. Rainfall runoff analysis was conducted on a grid-cell system, and the surface flow on the slope cell and flow in the river cells were computed using two-dimensional and one-dimensional wave approximations, respectively 12.
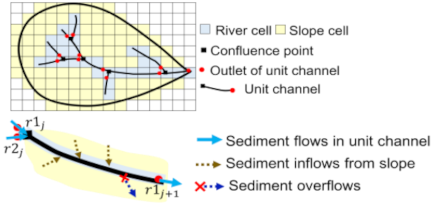
Fig. 4. Rainfall and Sediment Runoff Model structure (source: Qin et al. 8).
The model simulates the lateral subsurface, vertical infiltration, and surface flow to better represent rainfall runoff processes 13,14. The lateral subsurface flow, which is typically more important in mountainous regions, is treated in terms of the discharge-hydraulic gradient relationship, considering both saturated and surface flows 15.
The Green–Ampt infiltration model was used to estimate the vertical infiltration in the plain area.
The flow and sediment transport analyses throughout the basin of the unit channel system were simplified by calculating the differences in the water and sediment flow rates between the inlet and outlet of each unit channel at each time step. The mass-conservation equations for the flow and riverbed sediment used in this study are as follows:
A simplified convection equation was used to calculate the concentration of suspended sediments in a unit channel 16.
The bedload sediment transport rate was estimated using the following equation, proposed by Egashira et al. 17.
An equation for suspended sediment erosion rate was developed using the concept of entrainment velocity in a density-stratified flow proposed by Harada et al. 18.
The deposition rate of suspended sediment is evaluated using Eq. \(\eqref{eq:eq10}\),
The multilayer model proposed by Takebayashi 21 and later modified by Qin et al. 8, illustrated in Fig. 5, was implemented to calculate the vertical sorting process of the sediment size within the riverbed.
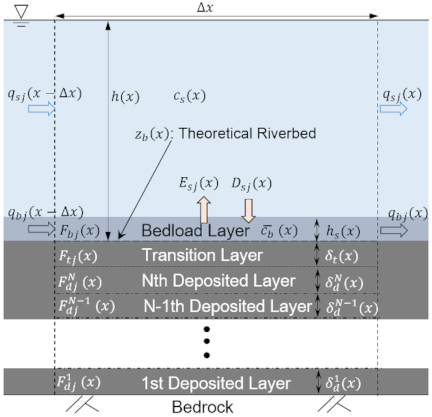
Fig. 5. Multilayer model diagram (source: Qin et al. 8).
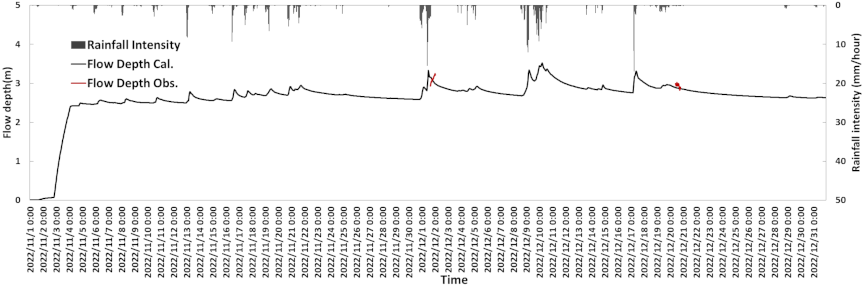
Fig. 6. Calibration result of the water depth at the Balanac River Bridge.
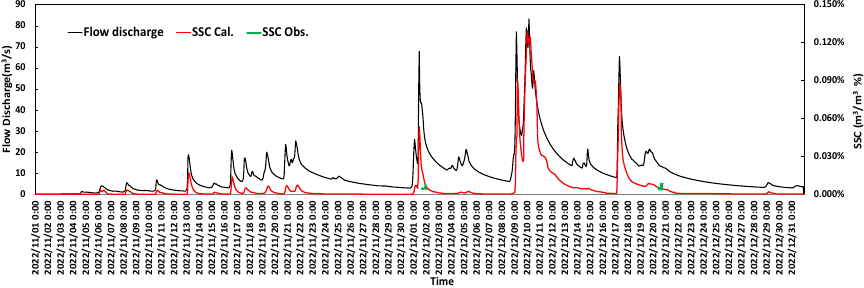
Fig. 7. Flow discharge and comparison of suspended sediment concentration between observation and calculation at the Balanac Bridge.
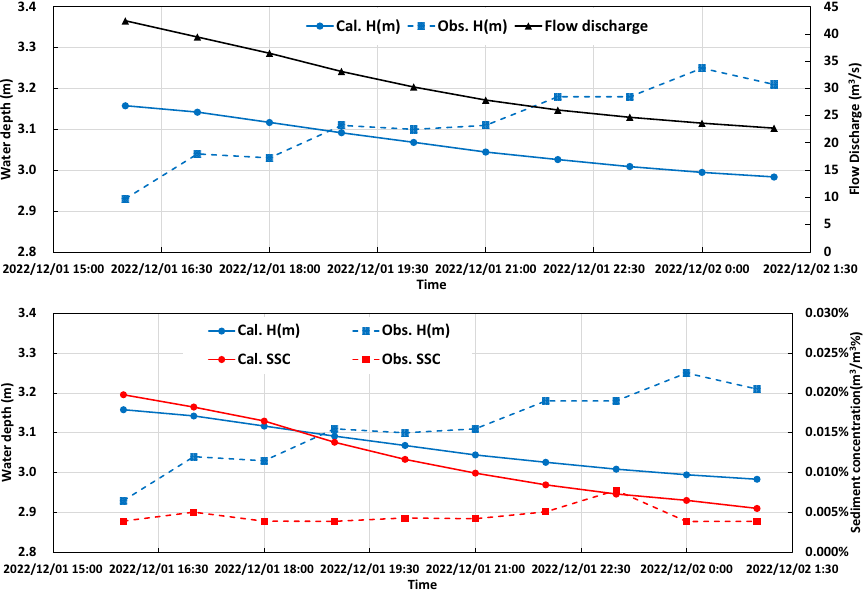
Fig. 8. Backwater effect at the Balanac Bridge (upper: temporal change of flow discharge and water levels; lower: difference of temporal changes of water level and SSC between observation and calculation).
Mass conservation equation of size class-\(j\) sediment in the bedload layer.
Mass conservation equation of size class-\(j\) sediment in the transition layer.
The sorting algorithm of the sorting process in the multilayer model.
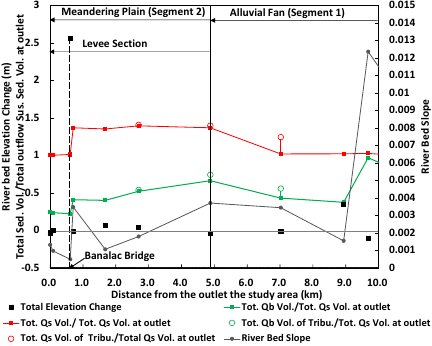
Fig. 9. Sediment flows and bed variation behaviors in the plain area of the Balanac River.
5. Results and Discussion
5.1. Comparison of Sediment Concentration Between Observation and Simulation
The calibration of the water depth and the comparison between the observed and simulated suspended sediment concentrations (SSC) at the Balanac Bridge are shown in Figs. 6 and 7, respectively. The calculated water depth and SSC showed good agreement with the second observation period conducted from 10:00 to 19:00 on December 20, 2022. However, the results from the first observation period, conducted from 16:00 on December 1 to 1:00 on December 2, 2022, showed a large discrepancy in the temporal variation of water depth. In Fig. 6, the calculated water depth is closely linked to rainfall intensity, increasing as rainfall intensifies and peaking when rainfall reaches its maximum. In contrast, the observed water depth continued to increase even as rainfall intensity decreased. Moreover, the upper panel of Fig. 8 illustrates this behavior in more detail: the water depth continues to increase despite a decrease in flow discharge, indicating the influence of the backwater effect downstream. As shown in Fig. 3, the Balanac Bridge is located approximately 200 m upstream of the confluence of the Balanac and Bumbungan Rivers. Therefore, the increase in the observed water depth may be attributed to an increase in the water level of the Bumbungan River, which was not included in the current simulation. Consequently, as shown in the lower panel of Fig. 8, the model’s overestimation of SSC during the first observation period can primarily be explained by the inaccurate simulation of river flow at the Balanac Bridge owing to the exclusion of the Bumbungan River catchment. During flood events, where rainfall is relatively concentrated in the Bumbungan River catchment, the water level at the confluence may be controlled by the Bumbungan River, enhancing the backwater effect at the Balanac Bridge. This resulted in a higher water depth and lower flow velocity than the simulated values, which in turn suppressed sediment erosion, leading to a lower observed SSC compared to the simulation.
Therefore, future field measurements at the Balanac Bridge should include simultaneous monitoring of flow velocity and water level at the confluence point. For further development of the monitoring system to evaluate flood and sediment inflows into Laguna Lake, the model used in this study remains valuable; however, it will require additional water level observations near the mouth of the Pagsanjan River to be incorporated as a downstream boundary condition for the model. This will allow the model to account for the backwater effect caused by fluctuations in the water level of Laguna Lake.
5.2. The Behavior of Sediment Transport and Bed Variation in the Plain Area of the Balanac River
The simulation results revealed the sediment transport dynamics and riverbed variation in the plain reach of the Balanac River, as shown in Fig. 9. Excluding two locations where significant riverbed slope drops occurred—one at the transition from the mountainous area to the alluvial fan plain approximately 9 km upstream from the outlet of the study area and the other at the Balanac Bridge cross-section—most of the plain reach exhibited very limited bed variation, generally within a few centimeters. Once the river enters the plain area, sediment transport is rapidly dominated by suspended sediment flow, and the amount of suspended sediment increases downstream, with particularly pronounced increases at large tributary confluences. Conversely, the deposition sections corresponded to the sections of decline in bedload transport rates.
These results suggest that most of the sediment supplied from the mountainous area enters the plain area, is transported as suspended sediment, and continues downstream, ultimately reaching Laguna Lake. While a portion of the bedload is deposited and retained within the river channel, most of the fine sediment is transported as suspended sediment that passes through the plain reach and contributes directly to the sediment inflow into the lake.
As shown in Fig. 10, the construction of high-elevation levees downstream altered the river channel conditions. These levees, designed to prevent river overflow, have increased channel capacity by deepening the channel, resulting in higher shear stress during peak discharge of the floods. Additionally, the straightening of meandering sections and use of concrete channel linings have steepened channel slopes and reduced roughness, further enhancing shear stress during floods. These changes may have suppressed suspended sediment deposition in the plain area, thereby contributing to the increased sediment transport into Laguna Lake.
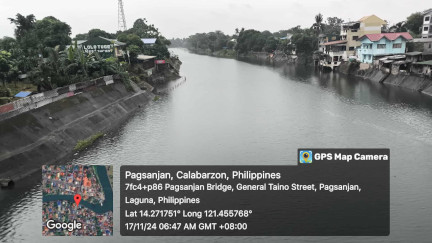
Fig. 10. Levee photo.
6. Conclusion
This study introduced a basin-scale rainfall-sediment runoff model designed to enhance flood and sediment inflow monitoring in Laguna Lake. Recognizing the necessity for a comprehensive simulation of river sediment inflows, it focused on the Pagsanjan River basin as a pilot case with the potential for application across other Laguna Lake tributaries.
The basin-scale model facilitated the simulation of sediment transport dynamics from mountainous regions to the plains. Addressing the challenge of data scarcity prevalent in the Philippine River basins and watersheds, the proposed model offers a valuable tool for understanding both flood and sediment flows, leveraging limited datasets and available institutional support.
The model highlighted a correlation between extreme weather events and increased sediment loading directly into Laguna Lake. Furthermore, river improvement activities have altered the downstream sediment dynamics. While levee construction aims to prevent river overflow during peak flows, the resulting high levees increase the channel capacity and depth. The straightening of the meander sections and the concrete channel lining further increased shear stress during floods. These anthropogenic river channel changes may have suppressed suspended sediment deposition in the plain area, thereby accelerating sediment transport into Laguna Lake.
Acknowledgments
This work was done within the framework of “The Project for development of a Hybrid Water-Related Disaster Risk Assessment Technology for Sustainable Local Economic Development Policy under Climate Change in the Philippines (HyDEPP),” under the Science and Technology Research Partnership for Sustainable Development (SATREPS) between Japan and the Philippines, funded by the Japan International Cooperation Agency (JICA) and the Japan Science and Technology Agency (JST). This work was also supported by the Engineering Research for Development and Technology (ERDT) under the Department of Science and Technology – Science Education Institute (DOST-SEI).
- [1] M. Ligaray et al., “Modeling the fate and transport of malathion in the Pagsanjan-Lumban basin, Philippines,” Water, Vol.9, No.7, Article No.451, 2017. https://doi.org/10.3390/w9070451
- [2] Laguna Lake Development Authority (LLDA), “Laguna de Bay basin master plan: 2016 and beyond, towards climate resilience and sustainable development,” 2016.
- [3] P. B. Sanchez, D. P. Oliver, H. C. Castillo, and R. S. Kookana, “Nutrient and sediment concentrations in the Pagsanjan–Lumban catchment of Laguna de Bay, Philippines,” Agricultural Water Management, Vol.106, pp. 17-26. 2012. https://doi.org/10.1016/j.agwat.2011.07.011
- [4] E. C. Paringit and E. R. Abucay (Eds.), “LiDAR surveys and flood mapping report of Pagsanjan River,” E. C. Paringit (Ed.), “Flood Hazard Mapping of the Philippines Using LIDAR, Quezon City,” University of the Philippines Training Center on Geodesy and Photogrammetry, 2017.
- [5] E. C. Hernandez, A. Henderson, and D. P. Oliver, “Effects of changing land use in the Pagsanjan–Lumban catchment on suspended sediment loads to Laguna de Bay, Philippines,” Agricultural Water Management, Vol.106, pp. 8-16. 2012. https://doi.org/10.1016/j.agwat.2011.08.012
- [6] P. B. Sanchez, D. P. Oliver, H. C. Castillo, and R. S. Kookana, “Nutrient and sediment concentrations in the Pagsanjan–Lumban catchment of Laguna de Bay, Philippines,” Agricultural Water Management, Vol.106, pp. 17-26. 2012. https://doi.org/10.1016/j.agwat.2011.07.011
- [7] M. Detert and V. Weitbrecht, “Automatic object detection to analyze the geometry of gravel grains – A free stand-alone tool,” River Flow 2012 (Proc. of the 6th Int. Conf. on Fluvial Hydraulics), pp. 595-600, 2012.
- [8] M. Qin, D. Harada, and S. Egashira, “Influences of hillslope erosion on basin-scale sediment transport processes,” Proc. of the 40th IAHR World Congress, pp. 2832-2841, 2023. https://doi.org/10.3850/978-90-833476-1-5_iahr40wc-p1223-cd
- [9] T. Sayama, Y. Tatebe, and S. Tanaka, “An emergency response-type rainfall-runoff-inundation simulation for the 2011 Thailand floods,” J. of Flood Risk Management, Vol.10, No.1, pp. 65-78, 2017. https://doi.org/10.1111/jfr3.12147
- [10] S. Egashira, T. Itoh, K. Horie, and N. Nishimoto, “A method to predict sediment transport process in drainage basin with dams,” River, Coastal and Estuarine Morphodynamics: RCEM 2007, Vol.2, pp. 1193-1201, 2007.
- [11] M. Qin, D. Harada, and S. Egashira, “Modeling of sediment transport processes in drainage basins,” Proc. of the 39th IAHR World Congress, pp. 718-727, 2022. https://doi.org/10.3850/IAHR-39WC2521711920221422
- [12] T. Sayama, G. Ozawa, T. Kawakami, S. Nabesaka, and K. Fukami, “Rainfall–runoff–inundation analysis of the 2010 Pakistan flood in the Kabul River basin,” Hydrological Sciences J., Vol.57, No.2, pp. 298-312, 2012. https://doi.org/10.1080/02626667.2011.644245
- [13] H. Shahid, M. Toyoda, and S. Kato, “Impact assessment of changing landcover on flood risk in the Indus River basin using the rainfall–runoff–inundation (RRI),” Sustainability, Vol.14, No.12, Article No.7021, 2022. https://doi.org/10.3390/su14127021
- [14] T. T. Nguyen, M. Nakatsugawa, T. J. Yamada, and T. Hoshino, “Flood inundation assessment in the low-lying river basin considering extreme rainfall impacts and topographic vulnerability,” Water, Vol.13, No.7, Article No.896, 2021. https://doi.org/10.3390/w13070896
- [15] Y. I. Sihombing, A. Rizaldi, M. Farid, N. F. Januriyadi, and I. R. Moe, “Jakarta’s 2020 new year flood assessment with a rainfall–runoff–inundation (RRI) model,” Environmental Sciences Proc., Vol.25, No.1, Article No.100, 2023. https://doi.org/https://doi.org/10.3390/ECWS-7-14317
- [16] K. D. Nastiti, Y. Kim, K. Jung, and H. An, “The application of rainfall-runoff-inundation (RRI) model for inundation case in upper Citarum watershed, West Java-Indonesia,” Procedia Engineering, Vol.125, pp. 166-172, 2015. https://doi.org/10.1016/j.proeng.2015.11.024
- [17] S. Egashira, K. Miyamoto, and T. Itoh, “Constitutive equations of debris flow and their applicability,” Debris-Flow Hazards Mitigation: Mechanics, Prediction, and Assessment (Proc. of the 1st Int. Conf.), pp. 340-349, 1997. https://doi.org/10.13140/2.1.4623.7122
- [18] D. Harada, S. Egashira, T. S. Ahmed, and H. Ito, “Entrainment of bed sediment composed of very fine material,” Earth Surface Processes and Landforms, Vol.47, No.13, pp. 3051-3061, 2022. https://doi.org/10.1002/esp.5442
- [19] S. Egashira and K. Ashida, “Studies on the structures of density stratified flows,” Bulletin of the Disaster Prevention Research Institute, Vol.29, No.4, pp. 165-198, 1980.
- [20] W. W. Rubey, “Settling velocities of gravels, sand and silt particles,” American J. of Science, Vol.s5-25, No.148, pp. 325-338, 1933. https://doi.org/10.2475/ajs.s5-25.148.325
- [21] H. Takebayashi, “River configuration in middle-lower reach of river basin,” J. of Japan Society of Fluid Mechanics, Vol.24, No.1, pp. 27-36, 2005 (in Japanese). https://doi.org/10.11426/nagare1982.24.27
This article is published under a Creative Commons Attribution-NoDerivatives 4.0 Internationa License.