Survey Report:
Application of Satellite Data and Google Earth Engine for Flood Assessment in the HyDEPP Project
Kentaro Aida*1,*2,†
 , Miho Ohara*3, Naoko Nagumo*1, and Patricia Ann Jaranilla-Sanchez*4
*1International Centre for Water Hazard and Risk Management (ICHARM), Public Works Research Institute (PWRI)
1-6 Minamihara, Tsukuba, Ibaraki 305-8516, Japan
*2Earth Observation Research Center (EORC), Japan Aerospace Exploration Agency (JAXA)
Tsukuba, Japan
*3Institute of Industrial Science, The University of Tokyo
Tokyo, Japan
*4School of Environmental Science and Management, University of the Philippines Los Baños
Los Baños, Philippines
†Corresponding author

This study examines the effectiveness of freely available satellite data and the Google Earth Engine (GEE) platform for early flood detection and information sharing, within the constraints of the COVID-19 pandemic, which restricted field surveys. The case study focuses on Typhoon Ulysses in the Philippines in November 2020, covering three basins: the Cagayan, Pampanga, and the Pasig–Marikina–Laguna (PML) basins. Flooded areas were extracted from Sentinel-2 using the modified normalized difference water index (threshold =0.15) and Sentinel-1 synthetic aperture radar (SAR) using a VH (vertical transmit polarization and horizontal receive polarization) backscatter decrease of 5 dB. These were overlaid with WorldPop 100 m population data to estimate the “potentially affected population,” which was then compared with evacuee counts reported by the National Disaster Risk Reduction and Management Council. Satellite observations taken on the day after landfall enabled the detection of wide-area floods. The estimated affected populations differed from the actual evacuees (e.g., ∼10 times in Cagayan and around 70% in PML). The detection rate of evacuation occurrence was generally high (up to 100% with Sentinel-2), suggesting its value as an early warning indicator. Limitations were identified in detecting urban/under-canopy flooding, as well as uncertainty in population distribution estimates. The GEE-based web application integrated rainfall, track, and inundation data, facilitating rapid information sharing among international teams and demonstrating potential for monitoring during the recovery phase. Future improvements in population data accuracy and automated processing are expected to enhance support for administrative decision-making.
Flood map displayed in the GEE app
1. Introduction
Flood disasters affect more people and pose greater obstacles to sustainable development than any other environmental hazard 1,2. Recent studies have quantified this effect. According to a previous study 3, the global population exposed to observed flooding increased by 58–86 million between 2000 and 2015, and projections indicate that climate change will further increase the proportion of people affected by floods by 2030.
This study was conducted as part of the project “Development of a Hybrid Water-Related Disaster Risk Assessment Technology for Sustainable Local Economic Development Policy under Climate Change (HyDEPP)” under the Science and Technology Research Partnership for Sustainable Development (SATREPS), in collaboration with Philippine research members since 2020. The project aims to advance disaster assessment research and contribute to the fields of hydrology, agriculture, and water management under changing climate conditions. This study evaluated the effectiveness of satellite observations and cloud-based analysis platforms during the COVID-19 pandemic, when on-site surveys were restricted. Typhoons frequently hit the Philippines, resulting in repeated large-scale flooding. At the start of the project, disaster information was compiled by municipalities and published daily by the National Disaster Risk Reduction and Management Council (NDRRMC). However, tabulated summaries did not facilitate an easy understanding of spatial or temporal variations.
Satellite observations are beneficial for assessing disasters over wide areas. European Space Agency’s Sentinel and National Aeronautics and Space Administration’s Landsat series provide free, high-frequency data. This study utilized these datasets to extract inundation areas and estimate potentially affected populations, comparing the results with actual evacuee numbers to assess the effectiveness and challenges of satellite-based approaches. We also report on the use of Google Earth Engine (GEE) 4 for visualizing and sharing disaster information among international collaborators. Although similar efforts have been reported 3,5,6,7,8, applications have expanded in recent years.
Our activities in 2020 represent an early case study, demonstrating the usefulness of combining satellite data and GEE for rapid disaster response and information sharing within an international project.
2. Background and Objectives
2.1. Objectives of the Study
A part of the HyDEPP-SATREPS project objectives is to assess flood risk in the context of future climate change. This paper aims to examine the use of freely available satellite data and the GEE platform for early flood detection and information sharing under the constraints imposed by the COVID-19 pandemic, which restricted field surveys. During the project period, we attempted to visualize flood damage caused by typhoons by constructing a web platform to share municipal disaster data and flood information.
We focused on the daily municipal evacuee counts as reliable reference data. Flooded areas extracted from the satellite images were combined with population distribution data to estimate the “potentially affected population.” Previous studies 9,10 similarly used inundation extent data from satellite images in conjunction with population data to estimate affected populations but did not compare these estimates with actual evacuee counts. This study analyzes the relationship with actual evacuee numbers and examines the challenges of using satellite observations for early disaster impact assessment.
2.2. Utilization of Satellite Data
In typhoon disasters, local governments report damage information, which the NDRRMC compiles into daily reports 11. During Typhoon Ulysses (international name: Vamco) in November 2020, the number of evacuees recorded by the NDRRMC increased daily and peaked several days after the disaster occurred. This time lag can be attributed not only to delays in people entering evacuation centers but also to delays in reporting and communication within local areas. Such delays may hinder timely disaster response, highlighting the potential utility of satellite-based indirect assessments as supplementary or alternative measures. With the recent entry of private companies, high-resolution optical and synthetic aperture radar (SAR) satellite images have become increasingly accessible. Therefore, it is beneficial to verify the advantages and challenges of using satellite data through case studies.
2.3. Google Earth Engine
We used GEE to share the overall flood situation caused by Typhoon Ulysses. GEE is a geospatial analysis platform provided by Google that includes remote sensing datasets, freely available for non-commercial use. Various satellite and geographic information system datasets are pre-stored on the server, and algorithms created in the browser-based code editor are executed server-side, generating visualized outputs in real time. Moreover, the developed algorithms can be published as web applications, allowing any user to run the same analysis and confirm the results.
A big advantage of GEE is its ability to rapidly establish globally accessible systems for data aggregation and sharing, regardless of location or resource availability. Information can be shared interactively with high flexibility. In this study, the use of GEE had the following implications for disaster response:
-
1)
Provided an overview of the affected distribution even when the full extent of damage was unclear, supporting members less familiar with satellite data analysis and enabling the identification of areas with high support needs.
-
2)
Facilitated discussions on disaster response and recovery under COVID-19 restrictions, where researchers could not meet in person.
-
3)
Enabled damage distribution assessment by overlaying inundation maps with land-use data, thereby providing more actionable information for response and recovery.
-
4)
Allowed expansion of layers, supporting not only immediate disaster response but also monitoring of recovery and reconstruction progress.
3. Study Area and Data
3.1. Target Typhoon and Damage Situation
The target disaster is Typhoon Ulysses, which occurred in November 2020. Ulysses formed as a tropical depression east of Mindanao Island on November 8, intensified into a typhoon on November 9, and crossed Luzon Island from east to west between the night of November 11 and the morning of November 12. Its minimum central pressure was 955 hPa, with a maximum wind speed of 43 m/s. In some locations, the 24-hour accumulated rainfall exceeded 300 mm, causing extensive flooding. According to the final 29th report of NDRRMC 11, 5.18 million people (1.26 million families) were affected, with 101 deaths, 85 injuries, and 10 missing. Agricultural damage amounted to 7.3 billion pesos (USD 150 million), infrastructure damage to 12.9 billion pesos (USD 260 million), and approximately 210,000 houses were reported damaged.
3.2. Target Basins
This study focused on three basins: the Cagayan River Basin (27,000 km\(^2\)), discharging into the Philippine Sea at the northern tip of Luzon; the Pampanga River Basin (11,000 km\(^2\)), discharging into Manila Bay; and the Pasig–Marikina–Laguna (PML) Basin (4,000 km\(^2\), including Laguna Lake), comprising 21 tributaries flowing into Laguna Lake and the Pasig and Marikina Rivers, which connect to Manila Bay (Fig. 1).
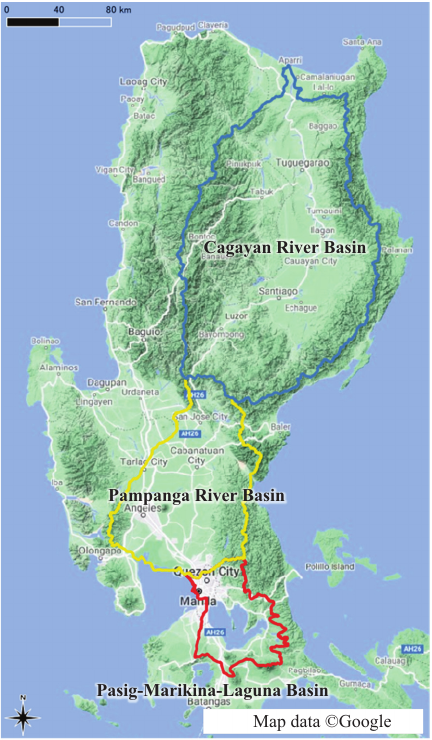
Fig. 1. Location of the three river basins on Luzon Island, Republic of the Philippines, examined in this study. Adapted from 12.
3.3. Typhoon Track Data
Typhoon track and gale area data were obtained from the RSMC Best Track Data 13 and Digital Typhoon archive 14.
3.4. Precipitation Data
Precipitation conditions were visualized using Japan Aerospace Exploration Agency’s Global Satellite Mapping of Precipitation (GSMaP) 15, which integrates multiple satellite observations to provide global rainfall data on a 0.1° grid at hourly intervals. Near-real-time data (GSMaP_NRT, \(\sim\)4-hour latency) and standard products (GSMaP_MVK, \(\sim\)3-day latency) are archived in GEE. We used these to calculate and visualize accumulated rainfall during the typhoon passage.
Table 1. Trends in the number of evacuees as reported by the NDRRMC. Bold numbers in the table indicate the maximum values. Adapted from 12.

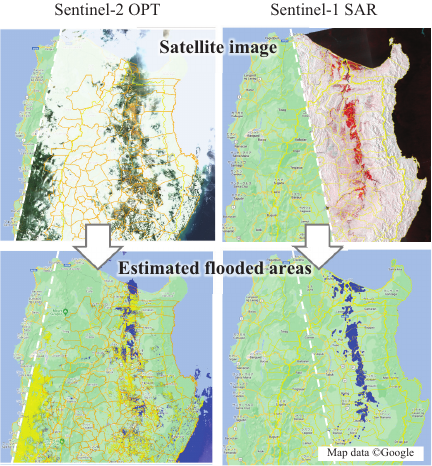
Fig. 2. Flooded area estimation results using Sentinel-2 optical images (left column) and Sentinel-1 SAR satellite images (right column) in the Cagayan River basin. The top row shows unprocessed satellite images, and the blue areas in the bottom row indicate the estimated flooded areas. Adapted from 12.
3.5. Disaster and Evacuee Information
NDRRMC reports commenced on November 11, 2020, at 08:00 (Report No.1) and continued until January 13, 2021 (Report No.29). Table 1 lists the evacuee counts. In the PML basin, 5,879 evacuees were reported in No.2 (Nov. 12, 5:00 PM), which increased to 27,886 in No.3 (Nov. 13, 8:00 AM). In contrast, no evacuees were recorded in Cagayan and Pampanga until No.4 (Nov. 14, 5:00 PM). Peak values were observed several days later: Cagayan 37,992 (Nov. 17, No.7), Pampanga 162,253 (Nov. 18, No.8), and PML 113,753 (Nov. 23, No.13).
3.6. Satellite Data
We used ESA’s Sentinel-2 optical imagery (S2-OPT, 10 m) and Sentinel-1 SAR (S1-SAR) 16. S2-OPT captured broad coverage of all three basins after 10:00 AM on November 13, revealing inundation in the cloud gaps (Fig. 2, left). S1-SAR observed most of the Cagayan middle–lower basin at approximately 6:00 PM on November 13. Pampanga and PML were imaged before 6:00 AM on November 17 (five days after landfall), and on November 18, both S2-OPT (after 10:00 AM) and S1-SAR (after 6:00 PM) were available. These datasets are archived in GEE and are typically updated within 24 hours of acquisition.
4. Methods
In GEE, Sentinel-2 (S2-OPT) data are provided as atmospherically corrected surface reflectance, whereas Sentinel-1 (S1-SAR) data are available as backscatter coefficients in dB. In this study, flood areas were estimated from available images using a threshold based on our past analysis and comparison with the S2-OPT visible images. The estimates were then overlaid with population distribution data to calculate the number of potentially affected people for each municipal district and then aggregated at the watershed level.
4.1. Sentinel-2 Optical Data and Flood Extraction
Sentinel-2 provides multispectral bands ranging from the visible to the shortwave infrared. Inundation can be delineated at 10 m resolution when cloud-free data are available. We applied the modified normalized difference water index 17 to post-flood images, classifying pixels with values greater than 0.15 as flooded. Although frequent cloud cover during typhoon season reduces usability, in this case, inundation was confirmed in all three basins on November 13 (Fig. 2, left).
4.2. Sentinel-1 SAR Data and Flood Extraction
SAR penetrates clouds and operates both day and night. Water surfaces appear dark owing to specular reflection, making flood detection straightforward 18. We compared pre- and post-typhoon imagery, classifying pixels with VH backscatter decreases \(\ge\)5 dB as inundated (value \(=1\); else \(=0\)). Slopes greater than 5° (digital elevation model-based) were masked, and a \(5\times 5\) median filter was applied to reduce speckle. After averaging \(5\times 5\) windows, areas greater than 0.1 were extracted as inundation (Fig. 2, right).
4.3. Estimating Potentially Affected Population
The flooded areas were overlaid with WorldPop 100 m population data 19. The “potentially affected population” was defined as the number of people within flooded zones aggregated at the municipality level. For consistency, inundation rasters (10 m resolution) were resampled to a 100 m grid, and counts were summed within administrative polygons.
5. Development of GEE Applications
Each dataset required customized processing algorithms coded in GEE. We developed our own applications by adapting examples shared by Google and other users. The shared information included the following:
-
1)
Municipal disaster and evacuee data from NDRRMC, visualized by polygon shading.
- 2)
-
3)
Rainfall distribution using GSMaP accumulated precipitation.
-
4)
S2-OPT imagery (Red-Green-Blue (RGB) composite image, water extraction, and turbidity indices).
-
5)
S1-SAR imagery showing pre-/post-flood RGB composites.
Initially, separate apps were created for Typhoon Ulysses (November 2020). Following the integration of Typhoon Odette (December 2021), rainfall and historical typhoon data were added to enable users to list and select pre- and post-event satellite images.
6. Results and Discussion
Tables 2 and 3 present the results of estimating the potentially affected population based on satellite data, which are referenced in a prior report 21.
Table 2. Estimated number of potentially affected population based on satellite data (observed on November 13). The values in parentheses indicate the number of municipalities where flooding areas were identified in each satellite image, allowing for the estimation of potential victims. Adapted from 12.

6.1. Municipal Inundation Detection
On November 13, inundation was identified municipality by municipality (Fig. 2, Table 2). In Cagayan, cloud cover limited S2-OPT detection to 11 of 95 municipalities (12%); however, S1-SAR detected flooding in 56 municipalities (\(\sim\)60%) later that day. Pampanga and PML had fewer clouds, with S2-OPT detecting 68 (\(\sim\)90%) and 46 (\(\sim\)90%) municipalities, respectively. The optical and SAR data complemented each other effectively, enabling rapid post-typhoon assessments.
Table 3. Results of consistency verification between the presence or absence of potentially affected population identified by satellite on November 13 and cases with at least one actual evacuee. The numbers in the table represent the count of municipalities confirmed by satellite data (in roman), the number of correct answers (in bold), and the correct answer rate (in parentheses). Adapted from 12.

6.2. Estimation of Potentially Affected Population
The estimated population on November 13 was Cagayan (\(\sim\)390,000), Pampanga (\(\sim\)270,000), and PML (\(\sim\)80,000) (Table 2). Compared to peak NDRRMC evacuees, these values were approximately 10 times higher in Cagayan, 1.7 times higher in Pampanga, and 0.7 times lower in PML. Discrepancies arise because the estimates reflect only direct flooding, while evacuation decisions depend on other hazards. Furthermore, dense urban and under-canopy flooding is poorly detected by S2/S1 methods, and WorldPop distributions sometimes allocate population to fields, wetlands, or floodplains. The wide-area integration of such errors likely explains the large discrepancy in Cagayan. In PML, estimates lower than the recorded evacuee numbers may represent more realistic conditions.
6.3. Detection of Evacuation Occurrence
We examined whether the satellite-derived inundation data could detect municipalities with at least one evacuee (Table 3). The correct answer rates were high: S2-OPT achieved 100% (Cagayan), 95% (Pampanga), and 80% (PML). The lowest accuracy was observed in the S1-SAR case for Cagayan (74%), which was likely due to errors in the population dataset. Nevertheless, both optical and SAR imagery effectively identified the municipalities in which evacuations occurred.
6.4. GEE Analysis and Applications
Examples of the GEE app are shown in Figs. 3–5.
6.4.1. Information Sharing Benefits
GEE, being freely available, is valuable for small communities and international collaboration. It supports multiple devices, server-side processing, and interactive visualization. Algorithms can be reused and updated across similar cases.
6.4.2. Benefits for Satellite Image Analysis
Traditional workflows require downloading raw data, preprocessing, and conducting local analysis, all of which demand expertise, hardware, and significant costs. GEE eliminates these barriers, providing sufficient capabilities for many applications. However, as a Google service, future changes in terms of use should be acknowledged.
6.4.3. Future Directions
GEE’s strength lies in customizable, area-specific applications, not just in browsing data. Its compatibility with global datasets and programmable spatial/temporal processing supports deployment as web applications. An ecosystem may emerge in which experts develop algorithms and users select regions and periods for immediate application.
6.4.4. Post-Disaster Applications
Satellite data provide objective records of past and present conditions, supporting emergency decisions. In recovery, Build-Back-Better principles emphasize sharing past damage to build a common understanding. Monitoring recovery via GEE apps allows communities to assess changes and make equitable comparisons with others.
Despite the limited accuracy of the tools used, this methodology can provide a useful general overview of the situation in these unmonitored areas, thereby offering relevant stakeholders sufficient information for planning in the affected areas.
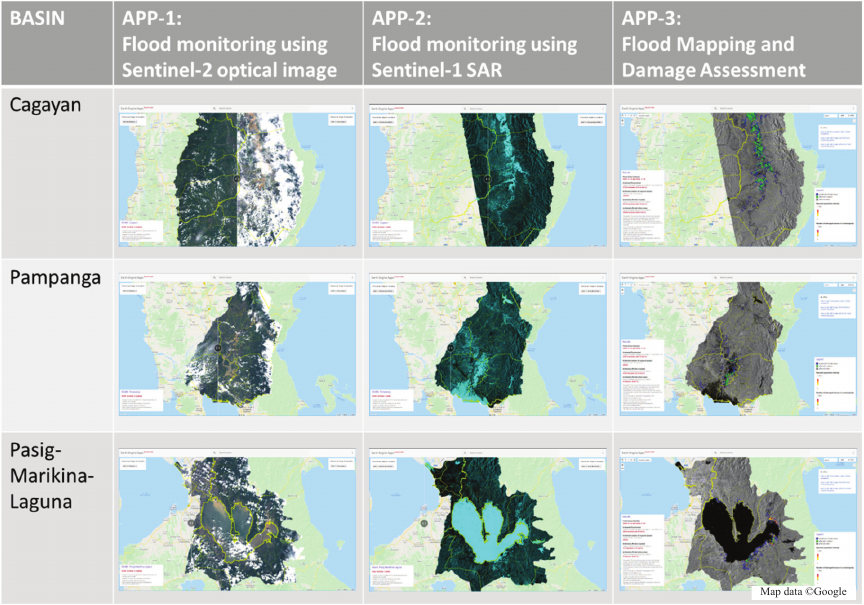
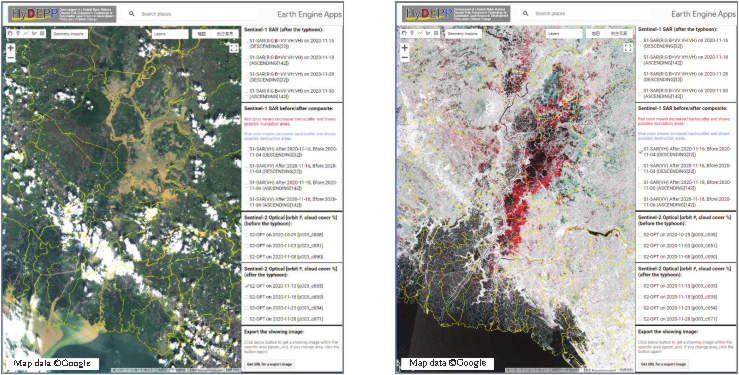
Fig. 3. Screenshots of three types of GEE applications created for each watershed. The left panel shows an app that displays pre- and post-disaster S2-OPT images; the center panel highlights potential flooded areas using S1-SAR data, with regions of low backscatter coefficients shown in light blue to emphasize potential inundation zones; the right panel displays the distribution of affected farmland and population based on estimated flooded areas from S1-SAR data, along with their aggregated values 22.
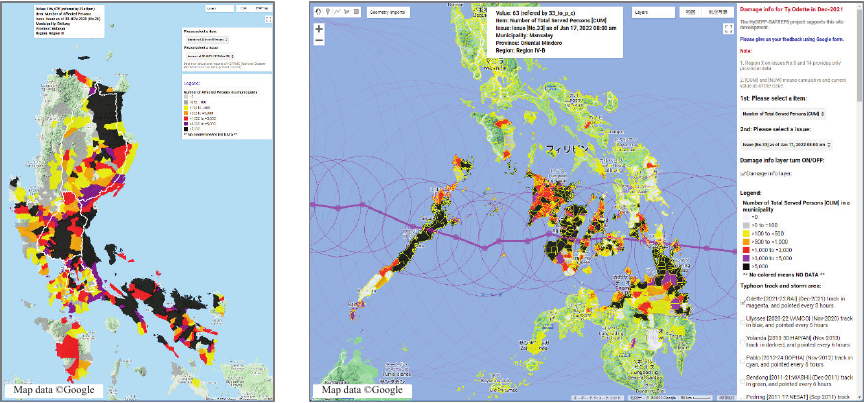
Fig. 4. Screenshots of the NDRRMC disaster information displayed on the GEE app (left: Typhoon Ulysses, right: Typhoon Odette in December 2021). The pink line in the right image illustrates the typhoon’s track and the area of strong winds.
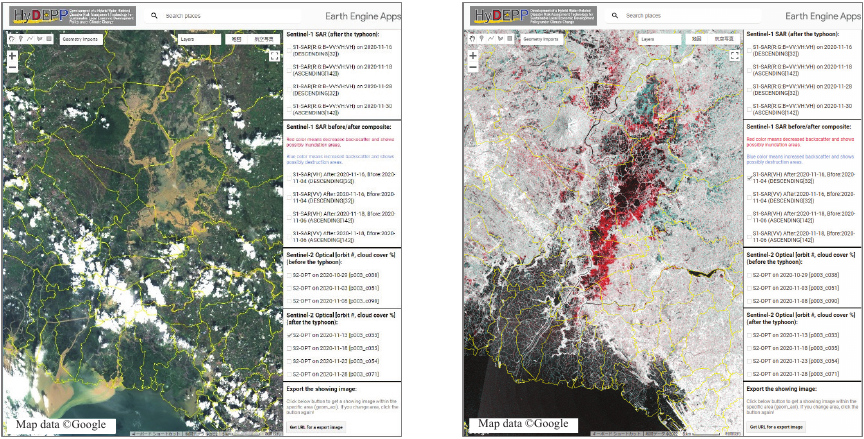
Fig. 5. Screenshots showing the flood situation in the downstream area of the Pampanga River in Luzon Island caused by Typhoon Ulysses in November 2020, using satellite imagery in the GEE app. The left image is a Sentinel-2 optical image (November 13, 2020). The right image is a Sentinel-1 SAR image, which is a composite of two images before and after the flood in RGB. The black areas indicate water surfaces before the flood, and the red areas likely represent newly flooded regions resulting from the flood.
7. Conclusions and Future Perspectives
Based on the Typhoon Ulysses case study, this study confirmed two main findings:
-
1)
Potentially affected population estimates derived from satellite-observed inundation and population data diverge significantly from actual evacuee numbers, making direct prediction of evacuees difficult.
-
2)
However, the presence/absence of evacuees could be reasonably inferred from whether S1-SAR or S2-OPT detected inundation.
-
3)
Freely available satellite data and the GEE platform can serve as effective tools for flood detection and information sharing when direct monitoring is not feasible, such as during the COVID-19 pandemic.
As SAR is unaffected by cloud cover, it offers clear advantages for flood detection. However, extraction accuracy depends on the specific methods and thresholds applied, and errors in the population data can substantially affect the results. Further studies should examine cases using higher-accuracy demographic datasets.
Regarding timeliness, Sentinel-1/2 data are available within hours; however, acquisition and processing still require consideration. With the increasing deployment of private satellite constellations and web-based automation, near-real-time monitoring could become feasible for administrative purposes.
Our findings, based on Typhoon Ulysses in the Philippines, demonstrated the utility of satellite–GEE integration within a research project context. We highlighted GEE’s potential not only for immediate relief decision-making but also for recovery-phase applications. Although subject to possible changes by Google as a private provider, GEE currently offers significant value. Continued service provision and future-oriented enhancements are anticipated.
Acknowledgments
The first author, Kentaro Aida, conducted this research while affiliated with the International Centre for Water Hazard and Risk Management (ICHARM), Tsukuba, Japan. This study was conducted with the support of the Science and Technology Research Partnership for Sustainable Development (SATREPS) program, a collaborative project between the Japan Science and Technology Agency (JST, JPMJSA1909) and Japan International Cooperation Agency (JICA).
- [1] S. Hallegatte et al., “Unbreakable: Building the resilience of the poor in the face of natural disasters, Ch. 3,” World Bank, pp. 63–77, 2016.
- [2] CRED and UNDRR, “Human cost of disasters – An overview of the last 20 years: 2000–2019,” 2020. https://reliefweb.int/report/world/human-cost-disasters-overview-last-20-years-2000-2019 [Accessed Septembner 30, 2025]
- [3] B. Tellman et al., “Satellite imaging reveals increased proportion of population exposed to floods,” Nature, Vol.596, pp. 80–86, 2021. https://doi.org/10.1038/s41586-021-03695-w
- [4] N. Gorelick et al., “Google Earth Engine: Planetary-scale geospatial analysis for everyone,” Remote Sens. Environ., Vol.202, pp. 18–27, 2017. https://doi.org/10.1016/j.rse.2017.06.031
- [5] E. Hamidi et al., “Fast flood extent monitoring with SAR change detection using Google Earth Engine,” IEEE Trans. Geosci. Remote Sens., Vol.61, Article No.4201419, 2023. https://doi.org/10.1109/TGRS.2023.3240097
- [6] M. Ashhar et al., “Flood inundation mapping of a river stretch using machine learning algorithms in the Google Earth Engine environment,” J. Flood Risk Manag., Vol.18, No.2, Article No.e70062, 2025. https://doi.org/10.1111/jfr3.70062
- [7] G. Singh and K. S. Rawat, “Mapping flooded areas utilizing Google Earth Engine and open SAR data: A comprehensive approach for disaster response,” Discov. Geosci., Vol.2, No.1, Article No.5, 2024. https://doi.org/10.1007/s44288-024-00006-4
- [8] R. Johary et al., “Detection of large-scale floods using Google Earth Engine and Google Colab,” Remote Sens., Vol.15, No.22, Article No.5368, 2023. https://doi.org/10.3390/rs15225368
- [9] C. Li et al., “Increased flooded area and exposure in the White Volta River basin in Western Africa identified from multi-source remote sensing data,” Sci. Rep., Vol.12, No.1, Article No.1, 2022. https://doi.org/10.1038/s41598-022-07720-4
- [10] A. Smith et al., “New estimates of flood exposure in developing countries using high-resolution population data,” Nat. Commun., Vol.10, No.1, Article No.1, 2019. https://doi.org/10.1038/s41467-019-09282-y
- [11] NDRRMC, “Situational report re preparedness measures and effects for Typhoon ‘ULYSSES’,” https://ndrrmc.gov.ph/index.php/disaster-reports/20-incidents-monitored/4138-situational-report-re-preparedness-measures-and-effects-for-severe-tropical-storm-ulysses-i-n-vamco.html [Accessed May 31, 2022]
- [12] Japan Meteorol. Agency, “RSMC Tokyo – Typhoon Center, Best Track Data,” https://www.jma.go.jp/jma/jma-eng/jma-center/rsmc-hp-pub-eg/trackarchives.html [Accessed Feb. 2, 2026]
- [13] Japan Meteorol. Agency, “RSMC Best Track Data,” https://www.jma.go.jp/jma/jma-eng/jma-center/rsmc-hp-pub-eg/besttrack.html [Accessed February 2, 2026]
- [14] NII, “Digital Typhoon: Typhoon images and information,” http://agora.ex.nii.ac.jp/digital-typhoon/index.html.en [Accessed September 30, 2025]
- [15] T. Kubota et al., “Global Satellite Mapping of Precipitation (GSMaP) products in the GPM era,” in *Satellite Precipitation Measurement*, V. Levizzani et al., Eds., pp. 355–373, Springer, 2020. https://doi.org/10.1007/978-3-030-24568-9_20
- [16] ESA, “Copernicus Sentinel data,” 2015.
- [17] H. Xu, “Modification of normalised difference water index (NDWI) to enhance open water features in remotely sensed imagery,” Int. J. Remote Sens., Vol.27, No.14, pp. 3025–3033, 2006. https://doi.org/10.1080/01431160600589179
- [18] S. Long et al., “Flood extent mapping for Namibia using change detection and thresholding with SAR,” Environ. Res. Lett., Vol.9, No.3, Article No.035002, 2014. https://doi.org/10.1088/1748-9326/9/3/035002
- [19] Google Developers, “WorldPop global project population data: Earth Engine data catalog,” https://developers.google.com/earth-engine/datasets/catalog/WorldPop_GP_100m_pop_age_sex_cons_unadj [Accessed September 30, 2025]
- [20] NII, “Digital Typhoon: Typhoon images and information,” https://agora.ex.nii.ac.jp/digital-typhoon/index.html.en [Accessed February 2, 2026]
- [21] K. Aida et al., “Evaluations of satellite data analyses for the 2020 Typhoon Ulysses disaster in the Philippines,” J. JSCE Soc. Civ. Eng. Ser. B1 (Hydraul. Eng.), Vol.78, No.2, pp. I_985–I_990, 2022. https://doi.org/10.2208/jscejhe.78.2_I_985
- [22] UN-SPIDER, “Flood mapping and damage assessment using Sentinel-1 SAR data in Google Earth Engine,” https://un-spider.org/advisory-support/recommended-practices/recommended-practice-google-earth-engine-flood-mapping [Accessed tember 30, 2025]
This article is published under a Creative Commons Attribution-NoDerivatives 4.0 Internationa License.