Paper:
A Climate–Hydro–Crop Modeling Framework for Assessing Climate Change Impacts on Hydrometeorology and Rain-Fed Paddy Yield in the Pampanga River Basin, Philippines
Mohamed Rasmy*,†, Koki Homma**
 , Tomoki Ushiyama*
, Ralph Allen Acierto*
, Miho Ohara*, Yoshito Kikumori*, and Toshio Koike*
, Tomoki Ushiyama*
, Ralph Allen Acierto*
, Miho Ohara*, Yoshito Kikumori*, and Toshio Koike*
*International Centre for Water Hazard and Risk Management (ICHARM), Public Works Research Institute (PWRI)
1-6 Minamihara, Tsukuba, Ibaraki 305-8516, Japan
†Corresponding author
**Graduate School of Agricultural Science, Tohoku University
Sendai, Japan

Climate change poses a significant threat to water and food security, necessitating an urgent need to quantify the evolving climate-related risks within the water-food nexus. Despite extensive research on climate change impacts on hydrometeorology, the climate–hydro–crop nexus remains underexplored. This study integrated downscaled and bias-corrected MRI-AGCM-3.2S climate outputs, a seamless hydrological model, and a rain-fed paddy model to simulate the climate change impacts on hydrological extremes, water availability, and rain-fed rice yield in the Pampanga River basin under the RCP8.5 scenario. The results showed a marginal increase in annual rainfall, accompanied by greater temporal and spatial variability. Extreme rainfall and associated flood events were projected to be more frequent and intensified. Despite the increase in basin-averaged annual rainfall, the annual discharge at San Isidro was projected to decrease due to weakening post-monsoon rainfall. The projected basin-averaged rain-fed rice yield showed a modest decrease at the basin scale, with larger losses in the eastern region due to water stress and in low-lying areas due to flooding compared to the past climate. These findings highlight the growing hydrological and agricultural risks posed by climate change in the basin and thus require regional climate-adaptive and climate-resilient strategies to safeguard water-food security. Future research will include intensive data collection, a comprehensive sensitivity assessment, and the integration of irrigation practices and the water storage function.
1. Introduction
Food production largely depends on water availability, as agriculture accounts for a significant portion of global water withdrawals; however, it is often devastated by hydrometeorological extremes. Climate change aggravates this pressure owing to rising temperatures, altered precipitation patterns, and more intense hydrometeorological extremes, such as droughts and floods 1. These climatic changes endanger water and food security and impede sustainable global development. Developing appropriate disaster risk reduction policies relies on the reliable quantification of climate change impacts not only on water availability and water-related disasters but also on food production. Although extensive studies have examined the impacts of climate change on hydrometeorology, the climate–hydro–crop nexus remains largely unexplored under changing climatic conditions. In this context, using the latest scientific and technological advancements, such as general circulation model (GCM) outputs and downscaling techniques, seamless hydrological modeling, and crop modeling, provides a unique opportunity to simultaneously quantify the impacts of climate change on catchment-scale water availability, water-related disasters, and food production.
GCMs, which are fundamental tools for projecting future climate change, have seen continuous improvements in various aspects; however, present GCM outputs cannot be utilized directly in basin-scale hydro-crop models owing to model-related uncertainties, coarse resolutions, and unrealistic representations of mesoscale information 2. Specifically, GCM rainfall data contain dry biases over regions with active convection (e.g., East Asia) 3. However, studies have shown that high-resolution GCMs (i.e., \(\sim\)60 km or less) have improved simulations of intense rainfall during the East Asian summer rainy season 4. Conversely, atmospheric GCMs (AGCMs) and atmosphere-ocean GCMs outputs (\(\sim\)20–60 km) are still too coarse for basin-scale climate change impact assessment studies. Thus, regional climate models (RCMs) are used to simulate finer-scale processes that are consistent with the larger-scale phenomena prescribed by GCMs and AGCMs 5. Although RCMs can improve atmospheric quantities, including extreme rainfall, errors attributed to the parent GCMs and parameterizations are not necessarily reduced by increasing resolution, resulting in uncertainties in climate change impact assessments 6,7. A common approach to correcting rainfall biases is to apply statistical bias correction methods to derive transfer functions from observed data and past GCM outputs. These functions are then applied to future projections under the assumption of stationarity. Therefore, using statistically bias-corrected, high-resolution RCM rainfall outputs for climate change impact studies is preferable given their superior performance in simulating rainfall amounts and distributions.
Furthermore, distributed hydrological models are essential tools for simulating various watershed hydrological processes and projecting watershed behaviors under future climatic conditions derived from GCMs, thus providing policymakers with evidence-based information on future water resources and water-related disasters 8,9,10. In a warming climate, both floods and droughts are likely to intensify, potentially overlapping with opposing hydrological extremes in the same year. Rather than being managed as separate hazards, drought and floods must be managed in an integrated manner. To seamlessly simulate floods and droughts, the hydrological model must be physically based and capable of addressing parameters related to floods (e.g., peak flood discharge and inundation), droughts (e.g., soil moisture, evapotranspiration, and low-flow discharges), and crop growth (e.g., soil moisture and temperature), all of which are influenced by varying surface energy, temperature, and sequences of extreme dry and wet periods. Rasmy et al. developed the Water and Energy Budget-Based Rainfall-Runoff-Inundation (WEB-RRI) model, which considers water- and energy-related processes, land–vegetation–atmosphere interactions, and soil moisture dynamics. The model also incorporates 1D and 2D water flows to enhance the simulation of interception, evapotranspiration, infiltration, runoff, and inundation processes 11. It is one of the most appropriate models for reliably simulating basin hydrological responses to variability in water cycles and climate change.
Furthermore, paddy rice is a staple food worldwide, and its cultivation accounts for a significant share of food production in Asia. Several crop simulation models have been developed, including ORYZA 12, the Decision Support System for Agro-technology Transfer 13, and the Simulation Model for Rice-Weather Relationships (SIMRIW) 14,15, to assess rice growth and yield estimation. In this study, we adopted the SIMRIW rain-fed model 16, a simplified process-based model for simulating the growth and yield of irrigated rice. The model simulates three major processes: plant ontogenetic development, leaf area expansion, and dry matter accumulation 17. Ohnishi et al. modified SIMRIW to create a nitrogen (N)-driven model that incorporated rice plant responses to N uptake and fertilizer application 17. Homma and Horie then expanded this model to simulate rice growth under rainfed conditions by incorporating water stress and nitrogen supply modules 16. The model has been validated in many regions, including Japan, the USA, Thailand, Indonesia, and Lao PDR 15,16,17,18,19.
This study presents a climate–hydro–crop modeling framework to investigate the impacts of climate change on catchment-scale hydrometeorological characteristics and paddy yields. This framework integrates high-resolution (\(\sim\)5 km) downscaled climate projections from the MRI-AGCM-3.2S model under the RCP8.5 scenario, a statistical bias-correction method based on long-term in-situ observations, the WEB-RRI hydrological model, and the SIMRIW paddy model for application in the Pampanga River basin, Philippines. Section 2 describes the study area. Section 3 outlines the methodology used in this study, including MRI-AGCM downscaling, statistical bias correction, and models for assessing future climates. Section 4 presents the results obtained from this research. Finally, Section 5 provides concluding remarks.
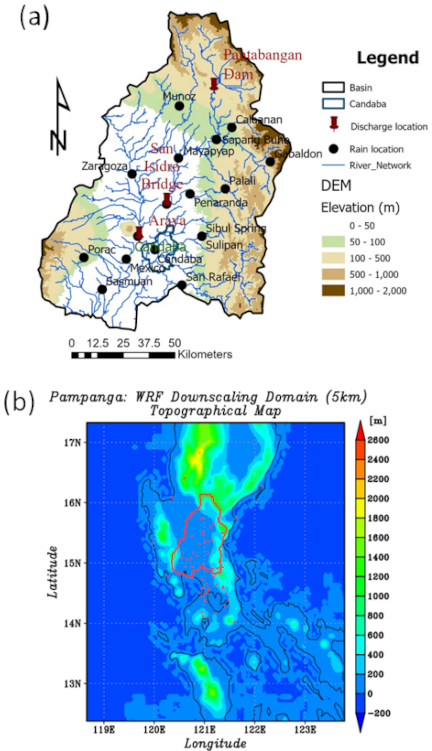
Fig. 1. Locations of the study area and gauges: (a) a map of the Pampanga River basin showing the locations of the rainfall and river discharge gauges, and (b) the WRF-downscaling domain showing the locations of the rain gauges used for bias correction.
2. Study Area
The Pampanga River basin (Fig. 1) is located in Central Luzon in the Philippines and covers an area of 10,434 km\(^2\). The basin experiences an average annual rainfall of 2,155 mm. On average, the basin experiences at least one flood event per year, which severely damages agriculture, housing, and infrastructure 20.
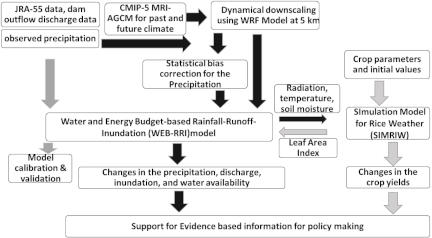
Fig. 2. Research framework for assessing the impact of climate change on water resources and crop yields in the Pampanga River basin.
3. Methods and Models
Figure 2 outlines the research framework used to assess the impacts of climate change on the basin. This involved dynamic downscaling of the MRI-AGCM from a horizontal resolution of 20 km to 15 km and then 5 km, statistical bias correction of the resulting rainfall data using long-term daily rainfall observations from several gauging stations, and application of the WEB-RRI and SIMRIW models to evaluate changes in water resources, water-related disasters, and paddy yield in future climates. The following subsections briefly describe the major components and procedures shown in Fig. 2.
3.1. Models
3.1.1. MRI-AGCM3.2H and Dynamical Downscaling
This study used climate outputs from the MRI-AGCM3.2S climate model (with a spatial resolution of \(\sim\)20 km), which improved various physics and parameterizations. Compared with other GCMs from the Coupled Model Intercomparison Project Phase 5 (CMIP5), it has a high resolution. The model has demonstrated superior performance in simulating heavy monthly rainfall in the tropical Western Pacific, the progression of the East Asian summer monsoon, and Pacific blocking 21. Because the MRI-AGCM is an AGCM, sea surface temperatures were obtained from monthly mean observations for the present climate, and future changes were derived from CMIP5.
The Weather Research and Forecasting (WRF) model was used as an RCM 22, and the boundary conditions for dynamic downscaling were obtained from the MRI-AGCM 3.2H model for climate projections of the present (1979–2003) and future (2075–2099) RCP2.6 and RCP8.5 scenarios. Two-way nested 15 km and 5 km grid interval frames were adopted. The model parameterizations used were the Kain-Fritsch scheme for convective parameterization, WRF single-moment three-class cloud microphysics scheme, Mellor–Yamada–Nakanishi–Niino (MYNN) surface layer scheme 23, unified Noah land surface model 24, and MYNN level 2.5 boundary layer scheme 23.
3.1.2. Statistical Bias Correction of Downscaled Rainfall Data
In practice, several statistical techniques have been employed to correct bias in GCMs’ past and future projections. This study adopted the combined scaling and quantile mapping method proposed by Inomata et al. 25 to correct downscaled daily rainfall data with a horizontal resolution of 5 km. This method adjusts the intensity of the GCM’s daily rainfall samples to accurately depict seasonal patterns and extreme values by deriving transfer functions from observed data and past GCM outputs and then applying them to future projections under the assumption of stationarity. This overcomes the tendency of standard scaling methods to over- or underestimate future extreme daily rainfall events.
3.1.3. WEB-RRI Model
The WEB-RRI model was developed by integrating previous studies on the Water and Energy Budget Distributed Hydrological Model and the Rainfall-Runoff-Inundation (RRI) model, with the aim of developing a seamless model applicable to integrated water resources management and water-related disaster management 8,9. This model considers the dominant hydrological processes in a catchment area in a fully distributed manner 8. The hydro-SiB2 land surface model was coupled with the 2D flow equations of the RRI model to incorporate the water and energy budget processes, land-vegetation-atmosphere interactions, multilayer soil moisture dynamics, and 2D lateral water flow. This improves the simulation of interception, evaporation, transpiration, infiltration, groundwater flow, surface runoff, and inundation. Because of its implicit treatment of basin-scale processes, the model is well-suited for long-term climate change simulations, enabling a more accurate reproduction of hydrological responses to past climates, future projections, and hydrological extremes.
3.1.4. SIMRIW Model
This study adopted the SIMRIW rain-fed model, which considers N uptake and water stress 16,26. The analysis considered single cropping only during the rainy season under purely rain-fed conditions (i.e., no irrigation), assuming that seasonal rainfall supplies most of the crop’s water requirements. The integration of field-scale irrigation processes into catchment-scale (\(\sim\)500 m) hydrological models poses significant conceptual and data-related challenges. Consequently, this study assumed that all cultivated areas operate under rain-fed cropping systems during the rainy season. This simplification enables a clearer evaluation of future water stress under changing climate conditions, independent of the additional complexity introduced by irrigation management dynamics. In addition, we implemented a formula to consider the impact of flood depth and duration on rice damage and yield estimation. Although many factors affect rice production, this study only considered meteorological factors, such as rainfall, temperature, radiation, and soil moisture. CO\(_{2}\) concentration, fertilizer, cultivation area, and rice cultivars were set to the same values for past and future climates.
In the WEB-RRI model, the RRI uses an adaptive time step (from a few minutes to a few seconds), whereas SIB2 and the paddy model operate at an hourly time step. The WEB-RRI model provided the following variables for each paddy grid: radiation, temperature, root-zone soil moisture, and inundation water depth. These variables were used to simulate water stress, plant growth, damage due to water stress and flooding, and net yield. In the SIMRIW model, paddy growth is described using a developmental index (DVI), which is predefined as 0 for seeding emergence, 1 for heading, and 2 for maturity.
The \(\mathit{DVI}\) was calculated as the integration of the daily developmental rate (\(\mathit{DVR}\)):
Nitrogen uptake (\(\mathit{Nup}\)), leaf area index (\(\mathit{LAI}\)), and dry matter (\(\mathit{DM}\)) were calculated as follows:
Yield [g/m\(^2\)] was estimated as follows:
Reduction by flood damages (\(\mathit{fdr}[0,1]\)) was defined and its accumulated effect (\(\mathit{acfd}[0,1]\)) was set to affect the abovementioned processes when the water depth (\(\mathit{wd}\)) exceeds half the plant height (\(\mathit{pht}/2.0\)) and 0.3 m. The parameters were obtained from Shrestha et al. 20, and the accumulated effects were adjusted from daily to hourly by dividing the values by 24.
3.2. Data and Model Setup
3.2.1. Topographic Data, Soil Type, Land Use, Vegetation, and Paddy Data
Topographic data (digital elevation models, flow directions, and flow accumulation) were obtained from the U.S. Geological Survey’s (USGS) Hydrological Data and Maps Based on Shuttle Elevation Derivatives at Multiple Scales.(1) The data were collected using NASA’s Shuttle Radar Topography Mission (SRTM), which operates in space at a resolution of three arc seconds. This study used 15-arc-second (\(\sim\)450 m) hydrologically conditioned data, which were improved products of the original SRTM data obtained by applying void-filling, filtering, stream burning, and upscaling methods. The reclassified land-use data for the SiB2 model were obtained from the USGS global datasets at a spatial resolution of 1 km. Soil-type distribution data and related soil-water parameters, including three-layer saturated hydraulic conductivity values (i.e., surface soil, root zone, and groundwater zone), soil porosity, residual soil moisture content, and Van Genuchten parameters, were obtained from the Food and Agriculture Organization at a spatial resolution of 9 km.(2) The SiB2 model also requires LAI and fraction of photosynthetically active radiation (FPAR) data to incorporate vegetation phenology into the estimation of surface energy, water, and carbon budgets. LAI and FPAR data were obtained from the moderate resolution imaging spectroradiometer (MODIS) on the Terra satellite, which provides global products (MOD15A2) for eight-day composites at a horizontal resolution of 1 km. These data were downloaded from the NASA Earth Observation Data and Information System,(3) projected from the sinusoidal grid tiling system onto the geographical coordinate system, and resampled to the model grid. The paddy area data used to simulate the SIMRIW model were obtained from the Global Land Cover by National Mapping Organizations (GLCNMO) database. GLCNMO-v3 provides geospatial information in a raster format that classifies the land cover status of the entire world into 20 categories. This data was prepared using MODIS data and remote sensing technology, and covers the entire globe in 500 m (15 second) grids.
3.2.2. In-Situ Rainfall and Discharge Data
Hourly rainfall data were collected from 17 stations inside and outside the basin from 2009 to 2023 from the Philippine Atmospheric, Geophysical, and Astronomical Services Administration (PAGASA). Fig. 1(a) shows the locations of daily rain gauges and their spatial distribution. To calibrate and validate the model-simulated streamflow, this research used discharge data collected at the San Isidro station during 2022 and 2023 (Fig. 1(a)).
3.2.3. Japanese Reanalysis Data
In addition to rainfall, other meteorological forcing inputs for the WEB-RRI model (such as air temperature, short-wave downward radiation, long-wave radiation, specific humidity, wind speed, and surface pressure) were obtained from the Japanese 55-year Reanalysis data prepared by the Japan Meteorological Agency (JMA). It is a high-quality, homogeneous climate dataset covering the last half-century of the entire globe 27. The data is available at three-hour temporal resolution and 0.125° spatial resolution for air temperature, specific humidity, wind speed, and surface pressure, and at three-hour temporal resolution and 0.56° spatial resolution for downward short-wave and long-wave radiations. These data were obtained from the JMA and interpolated to the model’s grid and temporal resolution (\(\sim\)500 m and 1 hour, respectively).
3.3. Model Performance Evaluation Indices
3.3.1. Rainfall and Discharge Evaluation Indices
Mean bias error (MBE), relative MBE (RMBE), root mean square error (RMSE), relative RMSE (RRMSE), and Nash–Sutcliffe efficiency coefficient (Nash) were used to evaluate model performance on deterministic and ensemble mean estimations.
MBE was defined as
RMBE was defined as
RMSE was defined as
RRMSE was defined as
Nash was defined as
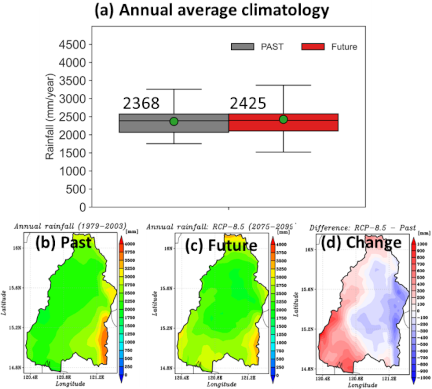
Fig. 3. Comparison of annual rainfall climatology between the historical and the RCP8.5 scenarios: (a) box and whisker plot for basin-averaged climatology, (b) spatial distribution of past climatology, (c) spatial distribution of future climatology, and (d) changes in future compared to past climatology. The green circle represents the mean values.
4. Results and Discussion
4.1. Assessment of Future Changes in Meteorological Parameters
4.1.1. Annual Climatology of Rainfall
Figure 3(a) compares the basin-averaged annual rainfall climatology between the historical and the RCP8.5 scenarios. The annual rainfall climatology displayed a marginal increase in mean values (from 2,368 mm/year to 2,425 mm/year, an increase of 2.5%) between the two climatic periods.
In the past, rainfall ranged from \(\sim\)1,500 to 3,000 mm/year, whereas it is projected to vary more widely, from about 1,300 to 3,200 mm/year. Thus, the future climate was found to have greater variability in annual rainfall than the past climate. Fig. 3(b) shows the spatial distribution of annual rainfall over the basin, indicating notable changes under the RCP8.5 scenario. During the historical period, annual rainfall mostly ranged between 1,500 and 3,500 mm, with higher intensities observed in the eastern part of the region (Fig. 3(a)). However, under the RCP8.5 scenario, changes were observed in both the magnitude and spatial distribution of rainfall, with some areas experiencing reduced rainfall and others showing increases (Fig. 3(d)). In particular, rainfall will increase in the western and southern areas and decrease in the central and eastern zones. These projected shifts in rainfall patterns have severe implications for water availability and agricultural productivity in the basin.
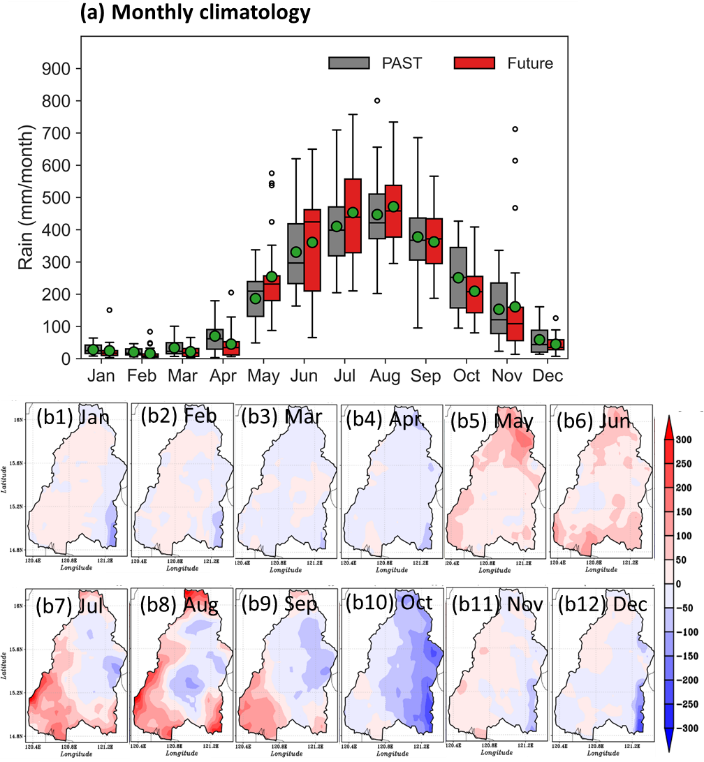
Fig. 4. Comparison of the monthly rainfall variation for past and future climate: (a) box-whisker plots for basin-averaged climatology—the green circle represents the mean and the open circle represents the outliers; (b1)–(b12) represent the spatial distribution of rainfall anomalies for each month.
Table 1. Past and changes in projected mean monthly rainfall.

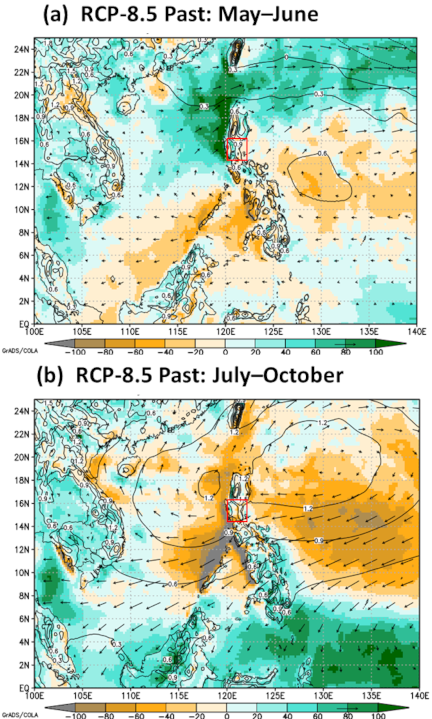
Fig. 5. Comparison of the rainfall (shaded) and wind field (arrows) anomalies over the Philippines (a) for the May–June period and (b) for the July–October period.
4.1.2. Monthly Climatology of Rainfall
Generally, rainfall in the basin is driven primarily by the southwest monsoon during the wet season (May–November), with tropical cyclones intensifying the rainfall between July and October. The dry season (December–April) experienced significantly less rainfall. Fig. 4(a) illustrates the monthly variation in rainfall for both the past and projected future, and Table 1 summarizes the anticipated changes in the future climate. As the figures show, there were distinct changes between the historical and projected future periods when the two climates were compared. Rainfall during the dry season (December–April) showed a slight decrease in mean values and spatial patterns (\(\sim\)28% of the total dry season rainfall) under the future climate scenario, particularly in the eastern region.
Conversely, considerable spatial variability was observed in the projected rainfall during the wet season. Basin-averaged rainfall during the first part of the main monsoon season (May–August) was characterized by higher mean values and increased variability, indicating more monsoon precipitation events in the future climate. In contrast, rainfall during the second part of the monsoon season (September–November) exhibited a particularly pronounced decrease in the projected climate compared to the past.
Figures 4(b1)–(b12) show the spatial variation in rainfall anomalies between the past and future climates for each month, complementing the temporal analysis by mapping spatial differences in rainfall across the basin. As shown in the figure, although the basin-average rainfall increased and decreased in some months, there was considerable spatial variability in the projected changes. Notably, there was a widespread increase in rainfall in the southern and western parts of the basin from June to September, whereas rainfall showed a significant decrease, particularly in the northeastern and eastern regions, from July to October. Overall, these results underscore the critical need to prepare for changes in rainfall patterns, which may have far-reaching implications for regional water resource management, agriculture, and disaster preparedness.
Wind field and rainfall anomalies were analyzed to understand the mechanism behind the increase in rainfall during May and June and its subsequent decrease during July and October, particularly over the eastern part of the basin (Fig. 5). From May to June, rainfall anomalies were predominantly positive over the basin, accompanied by strong southwesterly wind anomalies. This indicated a vigorous monsoon onset in the future, as shown in Fig. 5(a). In contrast, the July–October period (Fig. 5(b)) exhibited weaker monsoon conditions, with wind anomalies shifting in the opposite direction and the associated rainfall anomalies becoming negative. These results reveal that the monsoon will be stronger than normal during its onset season (May–June) but will weaken from July onwards, possibly due to the influence of large-scale climate drivers, which requires further investigation.
4.1.3. Extreme Rainfall
To investigate the effects of global warming on extreme rainfall events, the four-day accumulated rainfall was computed using a moving window over the entire historical (25 years) and future (25 years) simulation periods, since four-day rainfall can reasonably represent heavy rainfall events in the basin. Consequently, this comparison does not represent an exact match of individual rainfall events, but rather an evaluation of the statistical characteristics and extreme behavior of four-day rainfall across two distinct climate periods.
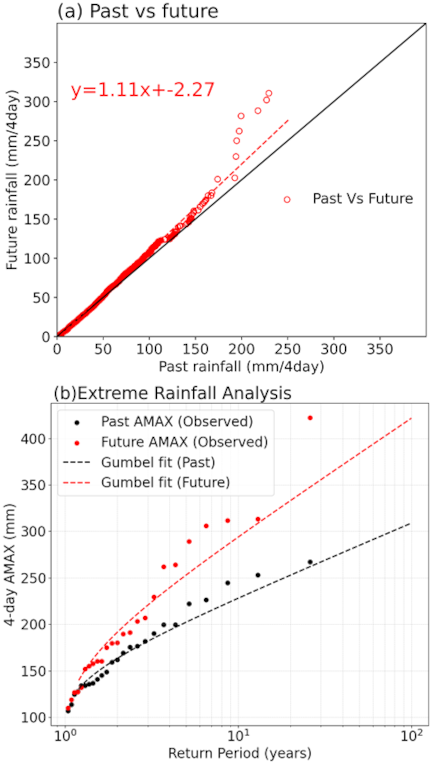
Fig. 6. Comparison of the four-day rainfall (event-rainfall) for past and future climate: (a) innovative trend analysis and red dashed line represents the best-fit linear regression line; (b) return period analysis.
Figure 6(a) shows the innovative trend analysis plot. This graphical method was used to identify trends in two time series of data (i.e., past and future climates) by arranging them in ascending order and plotting them on a \(1:1\) Cartesian graph to identify increasing or decreasing trends. The plot reveals an obvious upward trend in future rainfall, particularly above 150 mm over four days, compared with past values. This suggests that heavy rainfall events may become more intense in future climate scenarios. The regression line with a slope of 1.11 suggests that future rainfall is projected to be approximately 11% greater than past rainfall for the same events. However, this divergence became more noticeable at higher rainfall intensities, indicating a potential increase in the frequency and intensity of future heavy rainfall events. This analysis reveals a key implication of climate change: although the total rainfall is expected to increase by only 2.5%, extreme events, including design rainfall, are likely to become both more intense (by \(\sim\)30%) and more frequent (Fig. 6(b)). Such changes can significantly impact flood risk management, infrastructure design, agriculture, and water resource planning.
4.2. Model Development, Calibration, and Validation
Rainfall and discharge data from the San Isidro gauging station (Fig. 1(a)) from 2009 to 2023 were analyzed and were found not to represent the basin’s responses to rainfall. The gauging station was under reconstruction from 2020 to 2021. The only reliable discharge data available for this study were from 2022 to 2023. Additionally, rain-fed crop yield data for the Pampanga Province were limited and only available from 2017 to 2019 for this study.
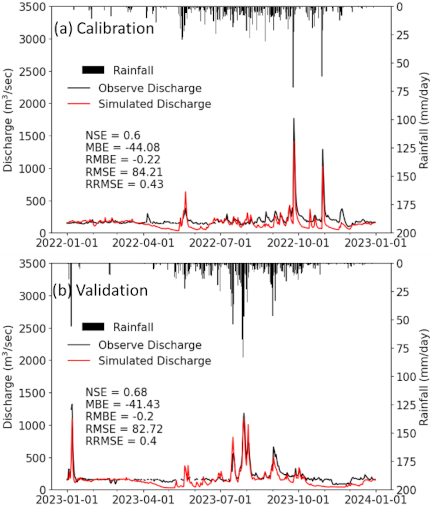
Fig. 7. Comparison of observed and simulated discharge at the San Isidro gauging station: (a) model calibration for 2022 and (b) model validation for 2023.
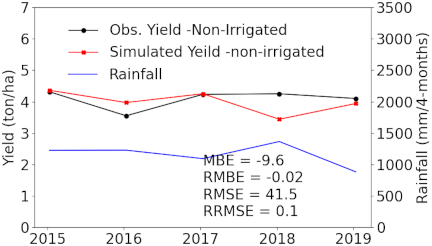
Fig. 8. Comparison between reported and simulated yields of non-irrigated paddy from 2015 to 2019.
4.2.1. Calibration and Validation of the WEB-RRI and SIMRIW Models
The WEB-RRI and SIMRIW models were simulated for the period from 2017 to 2023. Discharge data from 2022 were used to calibrate the WEB-RRI model, and data from 2023 were used for validation. Pantabangan Dam outflow records were used as the boundary conditions at the outlet of the dam. Fig. 7(a) compares the observed and WEB-RRI model-simulated discharges from January 1 to December 31, 2022, including the recorded flood event for model calibration. In late September, the Philippines, including the Pampanga Basin, was impacted by the intense and destructive super typhoon Noru (also known as Karding), which caused widespread damage.
As shown in the figure, the WEB-RRI model produced good results during the calibration period (\(\textrm{Nash} = 0.6\), \(\textrm{RMBE} = -0.22\), \(\textrm{RRMSE} = 0.43\)), reproducing the basin’s hydrological responses given the limited available data and uncertainty in the discharge and height relationship. The simulated river flow closely matches the observed river discharge data. In particular, the base flow during the dry period (January–May) was well calibrated. Although the peak flows during the typhoon period were well-calibrated in the model, they were underestimated. This could be due to uncertainties in heavy rainfall observations and measurement techniques. Furthermore, Typhoon Doksuri (also known as Egay), which was weaker than Typhoon Karding, impacted the basin in 2023. As shown in Fig. 7(b), the observed river discharges were lower than those in 2022, and the model-simulated low and peak river discharges during the validation period matched well with the observed discharges (\(\textrm{Nash} = 0.68\), \(\textrm{RMBE} = 0.2\), and \(\textrm{RRMSE} = 0.4\)).
Figure 8 compares the recorded and simulated rice yields under non-irrigated conditions in Pampanga Province between 2015 and 2019. Observed yields remained relatively stable at approximately 4.1–4.3 tons per hectare [t/ha], and the SIMRIW simulations captured the yield estimation relatively well compared to the observations, particularly in 2015, 2017, and 2019 (\(\textrm{RMBE} = -0.02\) and \(\textrm{RRMSE} = 0.1\)). Although the observed records were limited to a period of five years, these simulations offer valuable insights into yield variability and demonstrate the potential of the SIMRIW rain-fed model for evaluating rice productivity in the context of climate change.
4.3. Assessment of Future Changes in the Hydrological Parameters
Calibrated and validated WEB-RRI and SIMRIW models were used to simulate the basin’s hydrological and crop responses to the simulated past and projected future climatic conditions obtained from the MRI3.2-S climate model’s dynamically downscaled outputs. The rainfall data used for the hydrological modeling were bias-corrected products based on ground rain gauges. Other forcing data, such as temperature and radiation, were used without bias correction for both past and future climates because of the unavailability of ground-based data for the basin. As the Pantabangan Dam discharge is unknown, future river flow was considered to be in a natural state by setting a no-boundary condition at the dam location for all WEB-RRI simulations (i.e., for past and future climates). The WEB-RRI model outputs for past (1979–2003) and future (2075–2099) climates under scenario RCP8.5 were obtained at the selected discharge locations. Projected changes due to global warming were investigated.
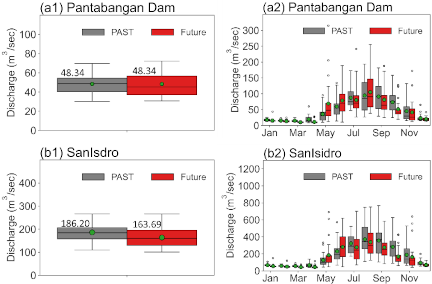
Fig. 9. Box-whisker plots for the comparison of the basin-averaged past and future projected discharges at (a) Pantabangan and (b) San Isidro.
Table 2. The rates of change in projected mean monthly discharge [%].

4.3.1. Changes in Projected Annual and Monthly Climatological Discharges
Figure 9 compares the basin-averaged past and future projected discharges, while Table 2 shows the rates of change in projected mean monthly discharge at the two hydrologically significant sites of Pantabangan and San Isidro. Figs. 9(a1) and (b1) show that the discharge data for Pantabangan Dam and San Isidro reveal contrasting trends when comparing past and projected future annual climatological discharges. At the Pantabangan Dam, the median discharge remains unchanged at approximately 48.34 m\(^3\)/s. However, future projections indicate slightly greater variability. In contrast, San Isidro shows a noticeable decline in median discharge, from 186.20 to 163.69 m\(^3\)/s (\(\sim\)12%), with future projections generally indicating lower flows. Monthly climatological discharges at the Pantabangan and San Isidro dams show that discharge will increase in May and June, with a more pronounced increase, as the upper whiskers and outliers extend higher in the future projections (Figs. 9(a1) and (a2)). The remaining months (September–April) will see a decline in discharge. Furthermore, the monthly variation trends in both locations emphasize the seasonal nature of discharge, with dry months (January–April and November–December) consistently showing lower flows in the future climate than in the past. The greater decline in flow at San Isidro than at Pantabangan is due to the reduced rainfall in the eastern region, as shown in Fig. 3(d).
4.3.2. Changes in the Projected Extreme Discharges and Inundation Depth
To investigate the impact of global warming on the characteristics of river discharge at the Pantabangan Dam and San Isidro gauging stations, continuous daily discharge time series were analyzed for both historical and future simulation periods, which were similar to the periods of simulated rainfall. The full daily discharge datasets from each period were analyzed independently and compared using innovative trend analysis and flow duration curves (FDCs). Fig. 10 shows the results of the trend and FDC analyses of historical and projected future streamflow at Pantabangan and San Isidro. As shown in Figs. 10(a1) and (b1), there were clear upward shifts in the future daily extreme discharges compared with the historical simulations. This suggests that, on average, future flows are projected to exceed historical flows. The corresponding flow duration curves (Figs. 10(a2) and (b2)) reinforce this observation, showing that future flows consistently exceed historical flows (black line), particularly at low exceedance probabilities of about 20% at Pantabangan and 10% at San Isidro. This indicates an increased likelihood of extreme discharge events under future climate scenarios. At the same time, the flow duration curves also indicate that daily discharge rates will decline in the future. The decreasing trend is visible above 20% and 10% exceedance probabilities at the Pantabangan Dam and the San Isidro discharge locations, respectively. However, unlike at Pantabangan, a greater rate of decline is visible at the San Isidro location in Fig. 10(b2), where the future curve consistently lies below the historical curve when the exceedance probability is above 10%. These contrasting trends highlight the need for localized water resource management strategies that address both increasing flow extremes and potential reductions in low-flow conditions.
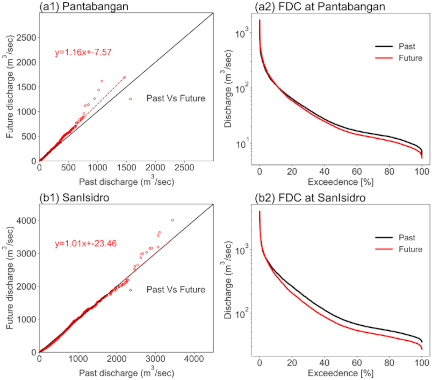
Fig. 10. Innovative trend analysis and FDC for daily averaged past and future climate (a1, a2) at the Pantabangan Dam location and (b1, b2) at the San Isidro gauging location.
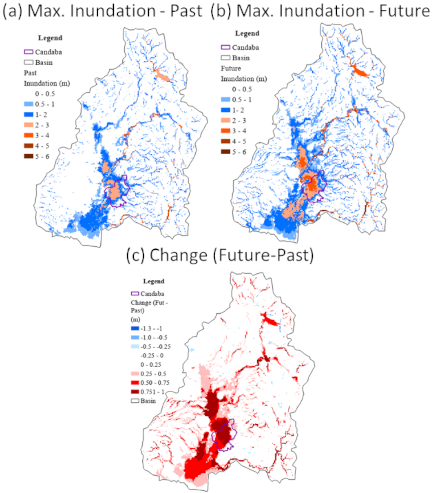
Fig. 11. Comparison of all-time maximum flood inundation depths: (a) past climate, (b) future climate, and (c) change (future-past).
To investigate the severity of flooding conditions in the basin under future climate scenarios, the maximum inundation depth at each grid cell (the maximum depth that occurred independently in each cell during the entire simulation period) was estimated from the WEB-RRI simulated results for both past and the RCP8.5 future climate scenarios, as shown in Figs. 11(a)–(c). The figures reveal changes in the inundation regime under a future climate scenario, indicating that the flood inundation area and flood risk are likely to increase in the basin under the RCP8.5 climate. Past inundation patterns (Fig. 11(a)) showed that low-lying regions, especially around the Candaba area, have experienced significant flooding, with depths of 2–3 m. However, the flood inundation depth in the same area is expected to increase (approximately 3–4 m) in the future. Fig. 11(c) clearly shows that large areas experienced increased inundation depths, with some areas exceeding 0.75 m compared to the past climate.
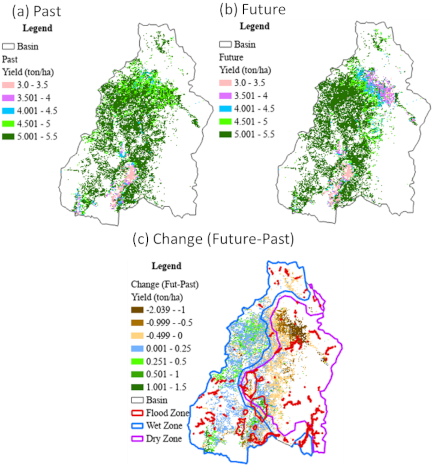
Fig. 12. Comparison of the annual average rain-fed paddy yield [t/ha] between the historical period and the RCP8.5 scenario: (a) past climatology, (b) future climatology, and (c) changes in the future compared to past.
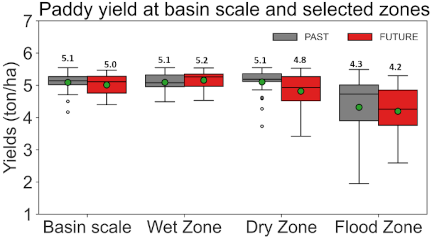
Fig. 13. Comparison of the annual average rain-fed paddy yield [t/ha] between the historical period and the RCP8.5 scenario at the basin scale. The numbers indicate the mean.
4.3.3. Changes in the Paddy Yield
The calibrated SIMRIW model was used to simulate crop yields at the basin scale to investigate the simultaneous effects of water stress and flood inundation on paddy yields. Figs. 12(a), (b), and (c) show the spatial distributions of rice yields across the basin under past and future climates and changes between past and future climate changes.
As the figures show, there are clear differences between the past and future scenarios in the simulation results. In the past, most of the area was characterized by relatively high yields ranging from 450 to 550 g/m\(^2\), with lower-yielding areas (3–3.5 t/ha) mainly confined to the Candaba region and further downstream. In contrast, as shown in Fig. 12(b), the future climate will experience a significant reduction in yield, with several areas shifting to lower yield classes and merging with high-yield fields.
The change map (Fig. 12(c)) reveals projected widespread yield losses, particularly in the eastern and southern portions of the basin, with reductions ranging from 0.5 to 2 t/ha. The main reason for the reduction in rain-fed yield in the eastern and southern regions was water scarcity due to reduced rainfall (Fig. 3(d)), whereas the reduction around the Candaba region was due to flood-induced damage. Conversely, the rain-fed yield in the western region will increase by \(\sim\)0.5 t/ha due to increased rainfall during the rainy season.
Figure 13 shows the basin and zonal areas (Fig. 12(c)) with averaged annual yields in the past and future climates. The wet zone (where the annual average rainfall change is greater than 50 mm per year) and dry zone (where the annual average rainfall change is less than 50 mm per year) were defined based on the rainfall differences shown in Fig. 3(d), whereas the flood zone (where the maximum water depth change is greater than 0.75 m) was defined based on Fig. 11(c). The basin-averaged yield will marginally decrease (from 5.1 to 5.0 t/ha, or \(\sim\)2%) under the future climate scenario compared to the past climate scenario. However, the future scenario exhibited a wider interquartile range, suggesting greater variability in yield outcomes and a higher risk in low-yield years. A detailed investigation of the selected zones revealed that the annual average yield will increase marginally (\(\sim\)2%) in the wet zone, decrease significantly (\(\sim\)6%) in the dry zone, and decrease moderately (\(\sim\)2%) in the flood zone.
5. Conclusions
Reliably assessing the impact of climate change on the water-food nexus is crucial for nations to develop policies that will help them achieve sustainable development goals. Accordingly, this study presents a climate–hydro–crop modeling framework that uses high-resolution bias-corrected climate model outputs, a seamless hydrological model, and a rain-fed paddy model to assess the impact of climate change on hydrometeorological characteristics and rain-fed paddy yield at the catchment scale.
Future climate projections (i.e., the RCP8.5 scenario) show complex hydrometeorological behavior with significant implications for the management of the basin’s water resources and agriculture. Although the average annual rainfall of the basin is projected to increase marginally (by approximately 2.5%), notable temporal and spatial heterogeneity can be observed. Rainfall is expected to increase in the western and southern parts of the basin; however, it is projected to significantly decline in the eastern and central regions. Monthly analyses showed wetter early monsoon seasons (May–June) due to the strengthening of the onset of the monsoon as well as drier late monsoon and dry seasons (September–April) due to the weakening of the post-monsoon period. This can intensify seasonal water stress and insecurity. Furthermore, an obvious upward trend in extreme rainfall (\(>\)250 mm over four days) was identified, indicating the potential intensification of heavy rainfall events (an increase of approximately 30%) under RCP8.5 scenarios.
Despite the challenges from the limited availability of discharge and crop yield data, the model was successfully calibrated and validated using observed discharge data from the San Isidro gauging station between 2022 and 2023. These results confirm the model’s ability to replicate low flows and peak discharges during periods of extreme rainfall (e.g., during Typhoons Karding and Egay). Simulated crop yields also corresponded well with the reported rice yield data from Pampanga Province, thereby reinforcing the model’s reliability in assessing agricultural productivity.
The outputs of the hydrological model from the hybrid model simulation reveal that the mean annual inflow to the Pantabangan Dam will remain unchanged, but with increased annual variability and increased extreme flows (\(>\)500 m\(^3\)/s), while the mean annual flow at the San Isidro gauging station will decrease by \(\sim\)12%, with increased extreme flows (\(>\)2,500 m\(^3\)/s) and a decline in low flows (\(<\)750 m\(^3\)/s). Increased extreme discharges will raise flood depths from historical maxima of 2–3 m to 3–4 m in the future, resulting in a more severe inundation situation in low-lying areas (e.g., Candaba).
This study assumed that all cultivated areas operate under rain-fed cropping systems during the rainy season. This enables potential changes in water stress and flood damage to be evaluated in the future under changing climate conditions, independent of the additional complexity introduced by irrigation management dynamics. Paddy model outputs revealed that the effects of future climate change pose a dual threat to rain-fed paddy yields. Although the simulated mean annual rain-fed yield indicated a marginal reduction of approximately 2% in basin-wide yields, there will be greater interannual variability caused by frequent and intense extreme flood events and a reduction in rainfall over the middle and eastern parts of the basin. Consequently, the eastern and southern parts of the basin will experience substantial yield reductions of approximately 4%, primarily because of water scarcity caused by reduced rainfall. Flood-prone areas such as Candaba will incur additional yield losses of approximately 2.8% due to flood inundation damage.
In summary, this study examined the impact of climate change on water-related disasters, water availability, and rainfed rice production in the Pampanga River basin. It also emphasizes the urgent requirement for climate-resilient and adaptive strategies to mitigate water-related disasters and ensure food and water security, as well as sustainable development in the region. It should be noted that the paddy model simulation did not incorporate future changes in vegetation type, land use, irrigation, cultivars, fertilization, or flood control measures because such data were unavailable for this study. Future work will involve intensive data collection, comprehensive sensitivity analysis, and explicit integration of irrigation practices and water storage functions of paddy fields. This will improve the reliability of risk assessments of paddy yields and enable informed policy recommendations.
Acknowledgments
This research was supported by the Science and Technology Research Partnership for Sustainable Development Program (SATREPS), implemented in collaboration with Japan and the Philippines. The authors would like to thank the University of Tokyo for providing resources for data archiving, processing, model simulations, and evaluation via the Data Integration and Analysis System (DIAS) and PAGASA for providing the necessary data for the development and validation of the hydrological model. We would also like to acknowledge the anonymous reviewers, whose comments and suggestions have improved this manuscript.
Footnotes
(1) The data can be accessed at https://www.hydrosheds.org/hydrosheds-core-downloads [Accessed March 17, 2026]
(2) http://www.fao.org [Accessed March 26, 2019]
(3) https://www.earthdata.nasa.gov/data/catalog/lpcloud-mod15a2h-006 [Accessed March 17, 2026]
- [1] Intergovernmental Panel on Climate Change (IPCC), “Climate Change 2022 – Impacts, Adaptation, and Vulnerability: Working Group II Contribution to the Sixth Assessment Report of the Intergovernmental Panel on Climate Change,” Cambridge University Press. 2023. https://doi.org/10.1017/9781009325844
- [2] A. Zhang, W. Liu, Z. Yin, G. Fu, and C. Zheng, “How will climate change affect the water availability in the Heihe River basin, northwest China?,” J. Hydrometeorol., Vol.17, No.5, pp. 1517-1542, 2016. https://doi.org/10.1175/JHM-D-15-0058.1
- [3] Q. Sun, C. Miao, and Q. Duan, “Comparative analysis of CMIP3 and CMIP5 global climate models for simulating the daily mean, maximum, and minimum temperatures and daily precipitation over China,” J. Geophys. Res. Atmos., Vol.120, No.10, pp. 4806-4824, 2015. https://doi.org/10.1002/2014JD022994
- [4] S. Kusunoki and O. Arakawa, “Are CMIP5 models better than CMIP3 models in simulating precipitation over East Asia?,” J. Clim., Vol.28, No.14, pp. 5601-5621, 2015. https://doi.org/10.1175/JCLI-D-14-00585.1
- [5] B. Rockel, “The regional downscaling approach: A brief history and recent advances,” Curr. Clim. Change Rep., Vol.1, No.1, pp. 22-29, 2015. https://doi.org/10.1007/s40641-014-0001-3
- [6] E. P. Diaconescu and R. Laprise, “Can added value be expected in RCM-simulated large scales?,” Clim. Dyn., Vol.41, No.7, pp. 1769-1800, 2013. https://doi.org/10.1007/s00382-012-1649-9
- [7] P. Hui et al., “Impact of resolution on regional climate modeling in the source region of Yellow River with complex terrain using RegCM3,” Theor. Appl. Climatol., Vol.125, No.1, pp. 365-380, 2016. https://doi.org/10.1007/s00704-015-1514-y
- [8] L. Wang et al., “Development of a distributed biosphere hydrological model and its evaluation with the Southern Great Plains Experiments (SGP97 and SGP99),” J. Geophys. Res. Atmos., Vol.114, No.D8, Article No.D08107, 2009. https://doi.org/10.1029/2008JD010800
- [9] T. Sayama, G. Ozawa, T. Kawakami, S. Nabesaka, and K. Fukami, “Rainfall–runoff–inundation analysis of the 2010 Pakistan flood in the Kabul River basin,” Hydrol. Sci. J., Vol.57, No.2, pp. 298-312, 2012. https://doi.org/10.1080/02626667.2011.644245
- [10] Y. Zheng, J. Li, T. Zhang, Y. Rong, and P. Feng, “Exploring the application of flood scaling property in hydrological model calibration,” J. Hydrometeorol., Vol.22, No.12, pp. 3255-3274, 2021. https://doi.org/10.1175/JHM-D-21-0123.1
- [11] M. Rasmy, T. Sayama, and T. Koike, “Development of Water and Energy Budget-based Rainfall-Runoff-Inundation model (WEB-RRI) and its verification in the Kalu and Mundeni River Basins, Sri Lanka,” J. Hydrol., Vol.579, Article No.124163, 2019. https://doi.org/10.1016/j.jhydrol.2019.124163
- [12] B. A. M. Bouman, T. P. Tuong, M. J. Kropff, and H. H. van Laar, “The model ORYZA2000 to simulate growth and development of lowland rice,” MODSIM 2001: Int. Conf. on Modelling and Simulation, pp. 1793-1798, 2001.
- [13] J. W. Jones et al., “Decision support system for agrotechnology transfer: DSSAT v3,” G. Y. Tsuji, G. Hoogenboom, and P. K. Thornton (Eds.), “Understanding options for agricultural production,” pp. 157-177, Springer, 1998. https://doi.org/10.1007/978-94-017-3624-4_8
- [14] T. Horie, H. Nakagawa, H. G. S. Centeno, and M. J. Kropff, “The rice crop simulation model SIMRIW and its testing,” R. B. Matthews, M. J. Kropff, D. Bachelet, and H. H. van Laar (Eds.), “Modeling the Impact of Climate Change on Rice Production in Asia,” pp. 51-66, CAB International, 1995.
- [15] K. Homma, M. Maki, and Y. Hirooka, “Development of a rice simulation model for remote-sensing (SIMRIW-RS),” J. Agric. Meteorol., Vol.73, No.1, pp. 9-15, 2017. https://doi.org/10.2480/agrmet.d-14-00022
- [16] K. Homma and T. Horie, “The present situation and the future improvement of fertilizer applications by farmers in rainfed rice culture in northeast Thailand,” L. R. Elsworth and W. O. Paley (Eds.), “Fertilizers: Properties, Applications and Effects,” pp. 147-180, Nova Science Publishers, Inc., 2009.
- [17] M. Ohnishi, T. Horie, and Y. Koroda, “Simulating rice leaf area development and dry matter production in relation to plant N and weather,” Applications of Systems Approaches at the Field Level (Proc. of the 2nd Int. Symp. on Systems Approaches for Agricultural Development, Vol.2), pp. 271-284, 1997. https://doi.org/10.1007/978-94-017-0754-1_19
- [18] M. Maki, K. Sekiguchi, K. Homma, Y. Hirooka, and K. Oki, “Estimation of rice yield by SIMRIW-RS, a model that integrates remote sensing data into a crop growth model,” J. Agric. Meteorol., Vol.73, No.1, pp. 2-8, 2017. https://doi.org/10.2480/agrmet.D-14-00023
- [19] M. Raksapatcharawong, W. Veerakachen, K. Homma, M. Maki, and K. Oki, “Satellite-based drought impact assessment on rice yield in Thailand with SIMRIW-RS,” Remote Sens., Vol.12, No.13, Article No.2099, 2020. https://doi.org/10.3390/rs12132099
- [20] B. B. Shrestha, T. Okazumi, M. Miyamoto, and H. Sawano, “Flood damage assessment in the Pampanga River basin of the Philippines,” J. Flood Risk Manag., Vol.9, No.4, pp. 355-369, 2016. https://doi.org/10.1111/jfr3.12174
- [21] R. Mizuta et al., “Climate simulations using MRI-AGCM3.2 with 20-km grid,” J. Meteorol. Soc. Jpn., Vol.90A, pp. 233-258, 2012. https://doi.org/10.2151/jmsj.2012-A12
- [22] W. C. Skamarock et al., “A description of the advanced research WRF Version 3,” NCAR Technical Note, NCAR/TN-475+STR, 2008.
- [23] M. Nakanishi and H. Niino, “An improved Mellor–Yamada Level-3 model with condensation physics: Its design and verification,” Bound.-Layer Meteorol., Vol.112, No.1, pp. 1-31, 2004. https://doi.org/10.1023/B:BOUN.0000020164.04146.98
- [24] M. B. Ek et al., “Implementations of Noah land surface model advances in the National Centers for Environmental Prediction operational mesoscale Eta model,” J. Geophys. Res. Atmos., Vol.108, No.D22, Article No.8851, 2003. https://doi.org/10.1029/2002JD003296
- [25] H. Inomata, K. Takeuchi, and K. Fukami, “Development of a statistical bias correction method for daily precipitation data of GCM20,” J. Jpn. Soc. Civ. Eng. Ser. B1 (Hydraul. Eng.), Vol.67, No.4, pp. I_247-I_252, 2011.
- [26] T. Horie, M. Yajima, and H. Nakagawa, “Yield forecasting,” Agric. Syst., Vol.40, Nos.1-3, pp. 211-236. 1992. https://doi.org/10.1016/0308-521x(92)90022-g
- [27] S. Kobayashi et al., “The JRA-55 reanalysis: General specifications and basic characteristics,” J. Meteorol. Soc. Jpn Ser. II, Vol.93, No.1, pp. 5-48, 2015. https://doi.org/10.2151/jmsj.2015-001
This article is published under a Creative Commons Attribution-NoDerivatives 4.0 Internationa License.