Survey Report:
Downscaled Climate Projections for Rainfall Extremes and Drought in Pampanga River and Pasig-Marikina-Laguna-Lake Basin
Ralph Allen E. Acierto*,†
 , Tomoki Ushiyama*
, Patricia Ann Jaranilla-Sanchez**, and Miho Ohara*,***
, Tomoki Ushiyama*
, Patricia Ann Jaranilla-Sanchez**, and Miho Ohara*,***
*International Centre for Water Hazard and Risk Management (ICHARM), Public Works Research Institute (PWRI)
1-6, Minamihara, Tsukuba, Ibaraki 305-8516, Japan
†Corresponding author
**University of the Philippines Los Baños
Los Baños, Philippines
***The University of Tokyo
Tokyo, Japan

The Philippines is one of the most climate-vulnerable countries in the world, with Central Luzon often experiencing extreme rainfall, floods, and droughts that are expected to worsen with ongoing warming. Using regional evidence from CORDEX–SEA (CMIP5) and CMIP6 multi-model ensembles, which show stronger rainfall extremes across Southeast Asia, this study produces basin-scale projections for the Pampanga River Basin and the Pasig-Marikina-Laguna-Lake Basin. High-resolution (5 km) climate projections were created with the Weather Research and Forecasting (WRF) model, dynamically downscaled from MRI-AGCM 3.2H (60 km) and 3.2S (20 km), and bias-corrected using the quantile-mapping method. The study analyzed projected changes in seasonal rainfall, heavy-rainfall indices (≥50 mm/day; 95th–99th percentiles), drought indicators (CDD, CWD), and design rainfall (from annual maxima) under RCP2.6 and RCP8.5 scenarios. The results show a clear intensification of heavy rainfall in both basins, especially during the southwest monsoon and under RCP8.5, with annual-maximum rainfall distributions indicating a consistent rise in extreme values and higher design rainfall for all return periods. Spatial patterns vary by basin: Pampanga has the largest increases in the lower western catchment, while the Pasig-Marikina-Laguna-Lake Basin shows a more uniform increase across the basin. At the same time, more consecutive dry days (CDD) and fewer consecutive wet days (CWD) suggest increased hydroclimatic variability, with wetter wet seasons and drier dry periods. These basin-specific, bias-corrected projections offer physically consistent data for flood and drought hazard assessment, agricultural and economic modeling, and climate-resilient water infrastructure design.
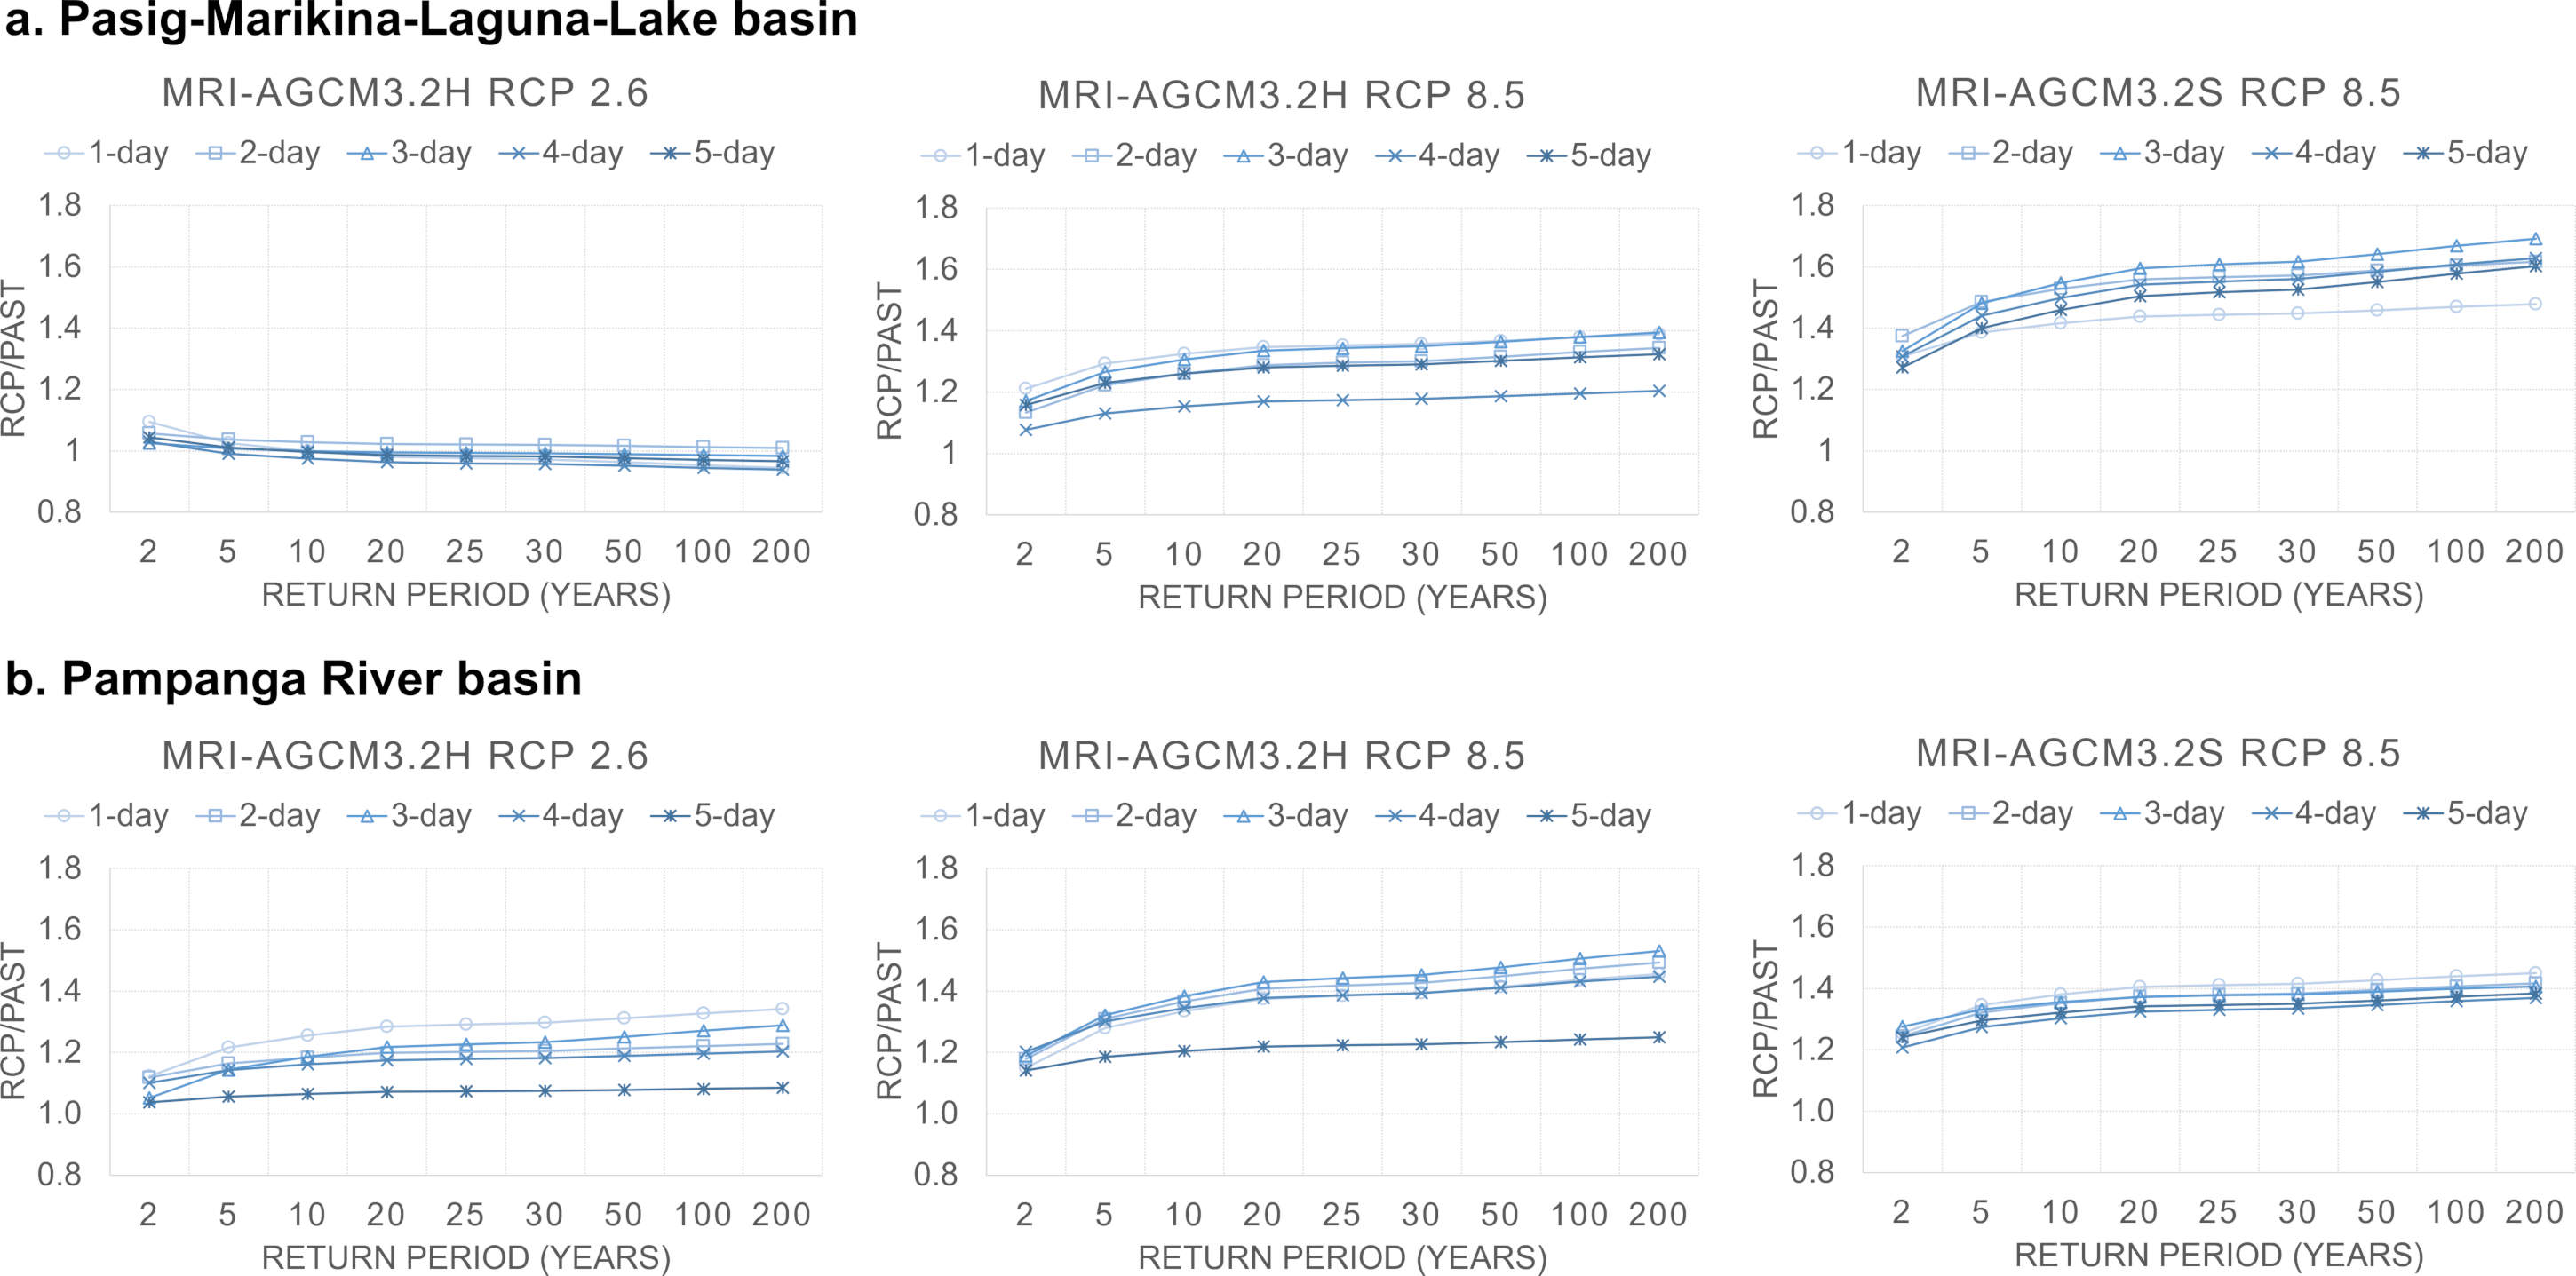
Projected design-rainfall change factors
- [1] Intergovernmental Panel on Climate Change (IPCC), “Climate change 2021 – The physical science basis,” Cambridge University Press, 2023. https://doi.org/10.1017/9781009157896.
- [2] R. Lasco et al., “State of the 2020 Philippine climate,” Oscar M. Lopez Center for Climate Change Adaptation and Disaster Risk Management Foundation, Inc., 2023.
- [3] F. Tangang et al., “Projected future changes in rainfall in Southeast Asia based on CORDEX–SEA multi-model simulations,” Clim. Dyn., Vol.55, Nos.5-6, pp. 1247-1267, 2020. https://doi.org/10.1007/s00382-020-05322-2
- [4] Supari et al., “Multi-model projections of precipitation extremes in Southeast Asia based on CORDEX-Southeast Asia simulations,” Environ. Res., Vol.184, Article No.109350, 2020. https://doi.org/10.1016/j.envres.2020.109350
- [5] R. Ito et al., “Uncertainties in climate change projections covered by the ISIMIP and CORDEX model subsets from CMIP5,” Geosci. Model Dev., Vol.13, No.3, pp. 859-872, 2020. https://doi.org/10.5194/gmd-13-859-2020
- [6] F. Ge et al., “Future changes in precipitation extremes over Southeast Asia: Insights from CMIP6 multi-model ensemble,” Environ. Res. Lett., Vol.16, No.2, Article No.024013, 2021. https://doi.org/10.1088/1748-9326/abd7ad
- [7] Z. Lin et al., “Projected changes in precipitation extremes over Southeast Asia: Unraveling the roles of thermodynamic and dynamic contributions,” Clim. Dyn., Vol.63, No.1, Article No.1, 2024. https://doi.org/10.1007/s00382-024-07491-w
- [8] P. A. Jaranilla-Sanchez et al., “Hydrological impacts of a changing climate on floods and droughts in Philippine river basins,” J. Japan Soc. Civ. Eng., Ser. B1 (Hydraul. Eng.), Vol.69, Issue 4, pp. I_13-I_18, 2014. https://doi.org/10.2208/jscejhe.69.i_13
- [9] T. Ushiyama et al., “Dynamic downscaling and bias correction of rainfall in the Pampanga River Basin, Philippines, for investigating flood risk changes due to global warming,” Hydrol. Res. Lett., Vol.10, No.3, pp. 106-112, 2016. https://doi.org/10.3178/hrl.10.106
- [10] M. Gusyev et al., “Evaluation of water cycle components with standardized indices under climate change in the Pampanga, Solo and Chao Phraya basins,” J. Disaster Res., Vol.11, No.6, pp. 1091-1102, 2016. https://doi.org/10.20965/jdr.2016.p1091
- [11] P. L. M. Tolentino et al., “Projected impact of climate change on hydrological regimes in the Philippines,” PLoS ONE, Vol.11, No.10, Article No.e0163941, 2016. https://doi.org/10.1371/journal.pone.0163941
- [12] C. E. Monjardin et al., “Impact of climate change on the frequency and severity of floods in the Pasig-Marikina River Basin,” E3S Web Conf., Vol.117, Article No.00005, 2019. https://doi.org/10.1051/e3sconf/201911700005
- [13] K. P. V. Robles and C. E. F. Monjardin, “Forecasting climate change impacts on water security using HEC-HMS: A case study of Angat Dam in the Philippines,” Water, Vol.17, No.14, Article No.2085, 2025. https://doi.org/10.3390/w17142085
- [14] R. Mizuta et al., “Climate simulations using MRI-AGCM3.2 with 20-km grid,” J. Meteorol. Soc. Jpn., Vol.90, No.A, pp. 233-258, 2012. https://doi.org/10.2151/jmsj.2012-A12
- [15] S. Kusunoki et al., “Evaluation of precipitation simulated by the atmospheric global model MRI-AGCM3.2,” J. Meteorol. Soc. Jpn., Vol.102, No.2, pp. 285-308, 2024. https://doi.org/10.2151/jmsj.2024-013
- [16] C. Tebaldi et al., “Climate model projections from the Scenario Model Intercomparison Project (ScenarioMIP) of CMIP6,” Earth Syst. Dyn., Vol.12, No.1, pp. 253-293, 2021. https://doi.org/10.5194/esd-12-253-2021
- [17] W. Skamarock et al., “A description of the Advanced Research WRF Version 3,” Tech. Rep., 2008. https://doi.org/10.5065/D6DZ069T
- [18] X. Zhang et al., “Indices for monitoring changes in extremes based on daily temperature and precipitation data,” Wiley Interdiscip. Rev. Clim. Change, Vol.2, No.6, pp. 851-870, 2011. https://doi.org/10.1002/wcc.147
- [19] S. Coles, “An introduction to statistical modeling of extreme values,” Springer London, 2001. https://doi.org/10.1007/978-1-4471-3675-0
- [20] R. W. Katz et al., “Statistics of extremes in hydrology,” Adv. Water Resour., Vol.25, Nos.8-12, pp. 1287-1304, 2002. https://doi.org/10.1016/S0309-1708(02)00056-8
- [21] S. M. Papalexiou et al., “How extreme is extreme? An assessment of daily rainfall distribution tails,” Hydrol. Earth Syst. Sci., Vol.17, No.2, pp. 851-862, 2013. https://doi.org/10.5194/hess-17-851-2013
- [22] J. R. M. Hosking and J. R. Wallis, “Regional frequency analysis,” Cambridge University Press, 1997. https://doi.org/10.1017/CBO9780511529443
This article is published under a Creative Commons Attribution-NoDerivatives 4.0 Internationa License.