Research Paper:
Evaluation Using AI-Based Approach of Pedicle Screw Stability Using Laser Resonance Frequency Analysis Prior to Surgical Insertion
Katsuhiro Mikami*1,†
 , Shogo Hashimoto*2, Tetsuya Matsuyama*2, Mitsutaka Nemoto*1
, Takashi Nagaoka*1
, Yuichi Kimura*3
, Takuto Hatakeyama*4
, Takeo Nagura*4,*5
, and Daisuke Nakashima*4,*5
, Shogo Hashimoto*2, Tetsuya Matsuyama*2, Mitsutaka Nemoto*1
, Takashi Nagaoka*1
, Yuichi Kimura*3
, Takuto Hatakeyama*4
, Takeo Nagura*4,*5
, and Daisuke Nakashima*4,*5
*1Faculty of Biology-Oriented Science and Technology, Kindai University
930 Nishi-mitani, Kinokawa, Wakayama 649-6493, Japan
†Corresponding author
*2Graduate School of Biology-Oriented Science and Technology, Kindai University
930 Nishi-mitani, Kinokawa, Wakayama 649-6493, Japan
*3Faculty of Informatics, Cyber Informatics Research Institute, Kindai University
3-4-1 Kowakae, Higashiosaka, Osaka 577-8502, Japan
*4Department of Orthopedic Surgery, Keio University School of Medicine
35 Shinano-machi, Shinjuku-ku, Tokyo 160-8582, Japan
*5Department of Clinical Biomechanics, Keio University School of Medicine
35 Shinano-machi, Shinjuku-ku, Tokyo 160-8582, Japan

In orthopedics, assessing the initial stability of pedicle screws is crucial for preventing failure after implantation. Traditional methods for determining stability are applicable only to post-screw insertion, complicating recovery in cases of inadequate strength. This study aimed to predict implant stability at the tapping stage prior to screw placement. Artificial bones with five distinct densities were utilized to measure tapping and screw insertion torques, facilitating a statistical evaluation of bone density and placement strength. A laser resonance frequency analysis (L-RFA) was conducted to obtain the vibration frequency spectra of the tap. Furthermore, linear approximation and support vector regression (SVR) were employed, utilizing spectral data and a 95% confidence interval to predict bone density. Significant differences in tapping and screw insertion torques were observed relative to bone density (p<0.01). Prediction based on a wide frequency range utilizing SVR improved the mean squared error from 26.9 to 8.08 when compared to traditional regression prediction, resulting in a coefficient of determination R2 of 0.843. The acquisition of bone density data at the tapping stage enables the prediction of expected screw stability. Bone density prediction using L-RFA has the potential to provide stability indicators prior to pedicle screw insertion.
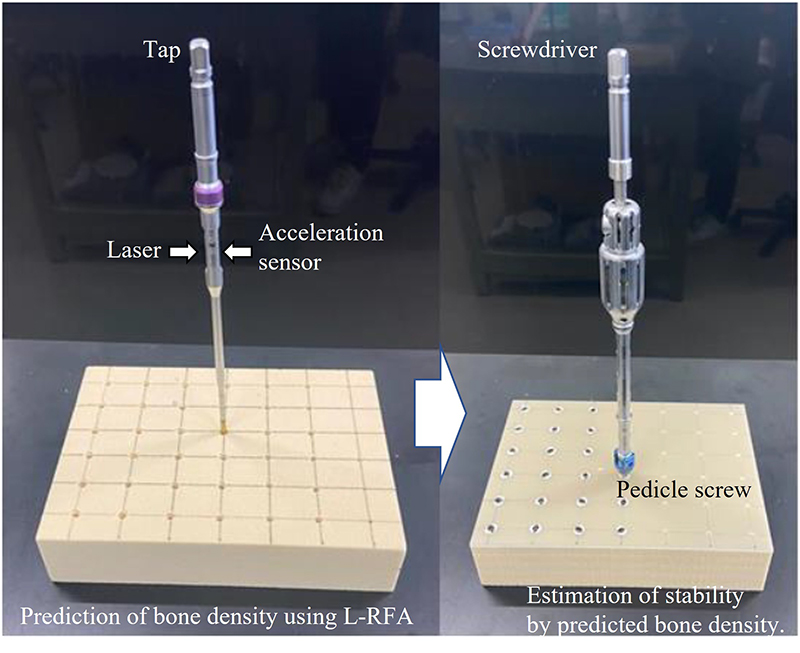
Prediction scheme for stability using L-RFA
1. Introduction
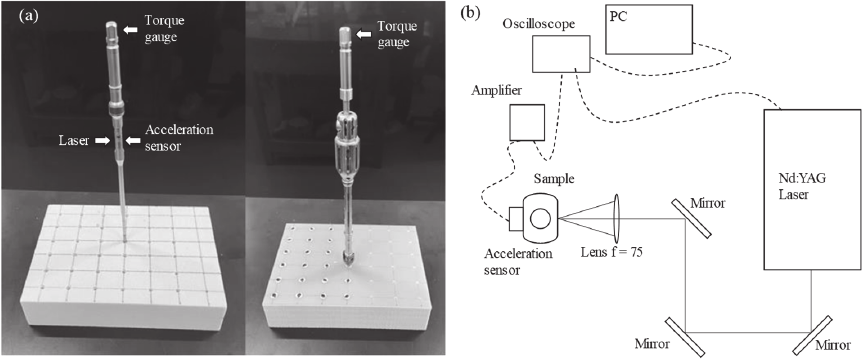
Fig. 1. (a) Experimental samples of tap and screw and (b) layout of L-RFA testing.
There has been a steep increase in the number of surgeries utilizing pedicle screws in orthopedics because of the aging society 1,2. Implant failure, particularly screw loosening, has emerged as a significant concern, with a reported incidence rate as high as 12% 3 and reoperation rates reaching up to 40% 4. Thus, preventing implant failure and evaluating the initial stability of the inserted implant have become essential 5,6. One of the underlying causes of such failures is the subjective nature of screw placement, which often relies on the surgeon’s tactile feedback and experience. This reliance on qualitative judgment introduces variability and potential inaccuracies in assessing bone quality and placement strength.
Conventional methods for assessing implant stability include pull-out strength tests 7 and insertion torque tests 5,8. However, the pull-out strength test is destructive, complicating its clinical application. Although the insertion torque test can be conducted in a clinical setting, it is limited to the time of insertion and cannot be repeated. Furthermore, the insertion speed and force are influenced by the operator, potentially affecting the evaluation results.
To address these limitations, resonance frequency analysis (RFA) was developed. Osstell ISQ® (Osstell, Integration Diagnostics) employs magnetic pulses to vibrate implants, utilizing magnetic RFA (M-RFA) specifically for dental implants. The results are presented as a unique index known as the implant stability quotient (ISQ). At the lowest resonance frequency of approximately 3000 Hz, the ISQ value was zero; conversely, at the highest resonance frequency of approximately 8000 Hz, the ISQ value reached 100 9,10. However, M-RFA requires the attachment of a smart peg to the implant during measurement, thereby imposing difficulties in its usage in deep internal areas of the body where implants are not easily accessible.
Therefore, we developed laser RFA (L-RFA), a method that induces vibrations through laser irradiation. L-RFA generates laser ablation or thermoelastic waves, thereby enabling noninvasive measurement of implant stability. Its effectiveness has been demonstrated for pedicle screws 11,12 and acetabular cups 13. In recent years, vibrations have been induced using a laser output that is harmless to biological tissues, and this method has been introduced into clinical trials.
Both the L-RFA and M-RFA methodologies require precise measurements after the placement of implants. In our previous research, we successfully demonstrated the assessment of pedicle screw stability using L-RFA post-implantation. The L-RFA method was validated utilizing cadaveric bone samples 12, where it achieved remarkable accuracy in predictions through machine learning algorithms that incorporated bone density metrics 14. Furthermore, the prediction of implant stability was significantly improved by applying machine learning techniques to polyaxial screws, which feature a movable head component 15. This unique feature of polyaxial screws can alter the vibrations induced during the installation process, contrasting with monoaxial screws that have a fixed head.
However, inadequate placement necessitates additional procedures such as removal or reinforcement, resulting in increased invasiveness and financial burdens on patients. If the placement strength of pedicle screws can be predicted at the pilot hole creation stage through tapping, appropriate adjustments, such as modifying the screw size, can be made.
The evaluation of bone density during the tapping stage can contribute toward the prediction of initial implant stability. Experimental methods 16,17 and simulation-based approaches 18 indicate that assessing bone density facilitates the prediction of implant stability. It is well recognized that the microstructure and composition of bone influence its stability due to the contact interface between the bone and the implant. In 2024, Hatakeyama et al. reported acquiring bone density information using L-RFA in a clinical study of acetabular cups 19.
This study aimed to predict the placement stability of pedicle screws based on bone density measured with L-RFA during the tapping stage prior to the insertion process. To achieve this, artificial bones with varying densities were utilized, and screw placement stability was defined by insertion torque. Data were statistically analyzed to examine the effect of density.
2. Experimental Methods
We employed five types of polyurethane foam (SAWBONES, Pacific Research Laboratory, Inc., Vashon Island, WA, US) as artificial bones to simulate vertebrae. These materials conform to the American Society for Testing and Materials (ASTM) standards and exhibit homogeneity and consistency comparable to those of human cancellous bone. The densities of the artificial bones were 10, 15, 20, 25, and 30 pcf, respectively. The taps and screws were placed at 25 mm \(\times\) 20 mm grid intersections, as depicted in Fig. 1(a). We used 35-mm-long, 5.5-mm-diameter polyaxial screws composed of titanium alloy (Ti-6Al-4V, 701M5535, Zimmer Biomet). Accordingly, taps were fabricated with a diameter of 4.5 mm (730M3045, Zimmer Biomet), which formed a hole that was 1 mm undersized relative to the screw.
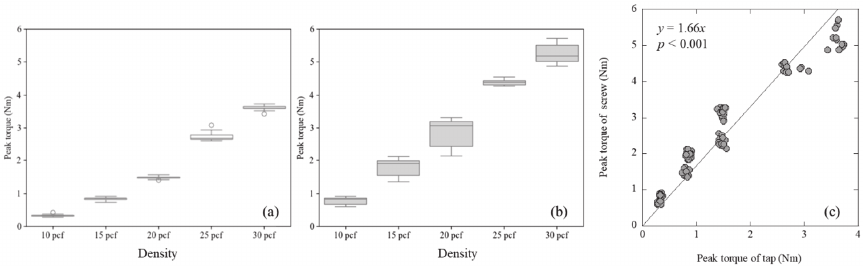
Fig. 2. Boxplots of insertion torques on different bone densities in the (a) tapping phase, (b) screw phase, and (c) relationship.
A digital torque gauge (HTGA-5N, Imada Co., Ltd.) was employed at a depth of 30 mm to assess the insertion torque of both the tap and the screw. This methodology is grounded in a previous study 20, which indicated that fixation strength diminishes once a screw head contacts the bone, adhering to similar procedures utilized in earlier research 12. A chuck was attached to the tip of the torque gauge, and the hexagonal part on the head of the tap and screwdriver was gripped to perform the insertion work. The torque gauge provided a measurement accuracy of 0.001 Nm with a sampling rate of 2000 points per second. The insertion torque progressively increased due to the growing number of threads engaged with the material, with the maximum torque recorded when the screw achieved the desired depth. In this study, maximum torque was defined as the placement stability of the pedicle screw.
The L-RFA measurement was adapted to only the tap to obtain a relationship between bone density and vibrational spectral from L-RFA. A Q-switched Nd:YAG laser (wavelength 1064 nm, pulse width 10 ns, DPS-1064-B, Changchun New Industries Optoelectronics Technology Co., Ltd.) was utilized to induce vibrations in the experimental samples, including taps and screws. The pulse energy was adjusted to 6 mJ, with a repetition frequency of 1 Hz. The experimental setup illustrated in Fig. 1(b) indicates that a focusing lens (focal length \(=75\) mm) is used for directing the laser onto the midshaft plane of the tap. An acceleration sensor (NP-3211, Ono Sokki Co., Ltd.) was attached on opposite surface with laser irradiation position as shown in Fig. 1(a) and detected vibrations, with the signals measured using an oscilloscope (Picoscope 2206 B, Pico Technology Ltd.) via an amplifier (M33, Metra Meß- und Frequenztechnik in Radebeul e.K.). The analog output from the amplifier was measured with sampling rate of 31.25 kHz.
For data acquisition, peak insertion torque was recorded for each tap and screw at 36 locations for densities of 10, 15, and 20 pcf, and at 12 locations for densities of 25 and 30 pcf. L-RFA vibration data were measured ten times for each insertion cycle, resulting in a total of 360 data points for each of the 10, 15, and 20 pcf densities, and 120 data points for each of the 25 and 30 pcf densities for analysis. The resulting time-voltage waveforms were converted into frequency spectra using fast Fourier transform (FFT) analysis. The frequency resolution in FFT was about 30 Hz. In this FFT analysis, input data were the time wave form during all measurement time of 20 ms. Setting a window to reduce the number of analysis points on this 20 ms acquired data is not recommended because it reduces the analysis time in FFT analysis, resulting in reduction of the frequency resolution. The sampling frequency and measurement time settings are directly related to the FFT analysis results and the acquired data size, so the conditions must be carefully determined.
Two methods were employed to estimate bone density: linear regression utilizing a single parameter extracted from the frequency spectrum, and support vector regression (SVR), which performs nonlinear regression. SVR is an adaptation of the support vector machine (SVM) 21,22, a pattern recognition method for regression that incorporates a kernel function to address nonlinear problems. We adopted the Gaussian kernel (RBF kernel) because of its high accuracy and short computation time, similar to those used in previously studies 14,15,23. The hyperparameters of the SVR, specifically the insensitivity coefficient \(\varepsilon\), regularization coefficient \(C\), and RBF kernel function \(\gamma\), were cross-validated in the range 2\(^{-10}\)–2\(^{10}\) through grid search. The combination yielding the highest coefficient of determination was selected. Data validation was conducted using 5-fold cross-validation, ensuring that each fold contained all 10 measurements from the same insertion site to maintain an equal number of data points across varying bone densities. The consistency of estimated bone density values with the true density of the artificial bone was assessed using the mean squared error (MSE), coefficient of determination (\(R^2\)), and 95% confidence interval.
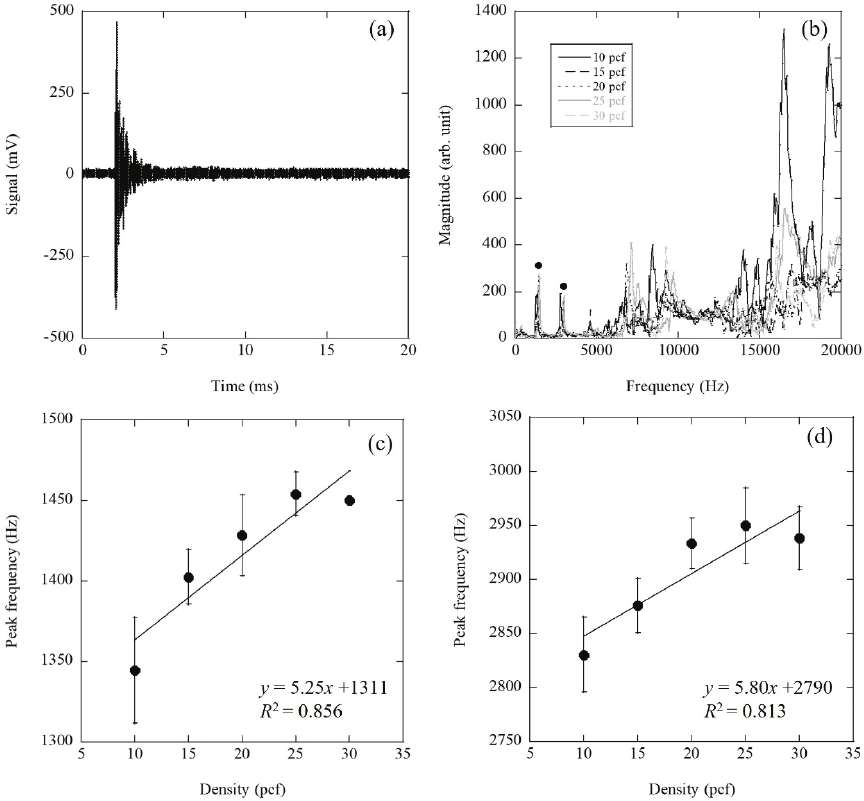
Fig. 3. Example of measured (a) time waveform and (b) frequency spectra analyzed by FFT. Relationships of peak frequencies as shown with black circles in (b) in the range of (c) 1000–2000 Hz and (d) 2000–3500 Hz.
3. Results
The experimental results for the insertion torque of the taps at each bone density are illustrated in Fig. 2(a), while those for the screws are depicted in Fig. 2(b). The insertion torque for both the tap and screw exhibited a significant increase with rising bone density, as evidenced by the Wilcoxon rank-sum test, which indicated \(p<0.01\) for all combinations. Furthermore, the correlation between the screw insertion torque and the insertion torque of the tap, following the creation of a pilot hole, is presented in Fig. 2(c). A strong correlation was identified, indicating that the insertion torque of the screw increased concurrently with the insertion torque of the tap. This finding suggests that prior estimation of the screw insertion torque is possible if bone density can be predicted at the tapping stage. Impulse excitation utilizing L-RFA was achieved through laser irradiation, inducing laser ablation. An example of the time-voltage waveform obtained during laser excitation is presented in Fig. 3(a). The timing of the Q-switch signal output from the excitation laser was set to 0 s. Induced vibrations occurred with a fixed delay characteristic of the equipment, after which the laser pulse irradiated the experimental sample. These vibrations decayed over a millisecond timescale and ultimately stabilized. A frequency spectrum was acquired by performing an FFT on this signal waveform. The spectral examples for each bone density, illustrated in Fig. 3(b), consistently exhibited stable peaks around 1400 and 2800 Hz (black circles). In contrast, a random spectrum above 5000 Hz was obtained, independent of the bone density.
In the previous studies for L-RFA of pedicle screws, implant stability, defined by insertion torque, was analyzed by concentrating on frequencies at which vibration peaks occurred. So these typical peaks were also analyzed in this study. The two stable peaks indicated by the black circles in Fig. 3(c) demonstrate the correlation between peak frequency and bone density in the 1000–2000 Hz range, whereas Fig. 3(d) depicts the correlation in the 2000–3500 Hz range. In each plot, the error bars signify standard errors. In both frequency ranges, the peak frequency increased with an elevation in bone density.
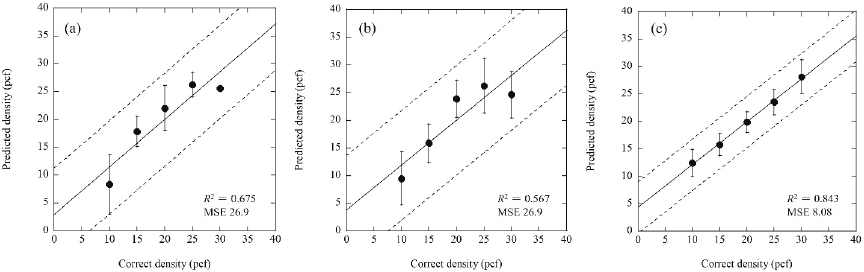
Fig. 4. Prediction results of the density with (a) peak frequency in the range of 1000–2000 Hz, (b) peak frequency in range of 2000–3500 Hz, and (c) SVR. The dashed lines indicate 95% confidence intervals.
Previously, implant stability was estimated using peak frequencies from the spectrum, and recent studies applied machine learning to enhance prediction accuracy. Figs. 4(a) and (b) illustrate the results for each bone density estimated from the regression lines presented in Figs. 3(c) and (d), respectively. The error bars in the plots represent standard errors, with both models exhibiting an MSE of 26.9. The coefficients of determination (\(R^{2})\) for the linear regressions were 0.675 and 0.567, respectively, indicating a moderate level of success in estimating bone density. Fig. 4(c) presents prediction results obtained through nonlinear regression employing SVR. The MSE was 8.08, and the \(R^2\) value was 0.843, indicating that SVR yielded significantly higher accuracy than predictions based on single-peak frequencies.
To validate regression predictions, 95% confidence intervals are represented as dotted lines in Figs. 4(a)–(c). All confidence intervals passed through the origin, resulting in a one-to-one correspondence. Furthermore, compared to the single-frequency linear regression illustrated in Figs. 4(a) and (b), the SVR regression shown in Fig. 4(c) exhibited narrower confidence intervals and greater accuracy.
4. Discussion
The insertion torque of the tap and screw was determined by friction with the bone; a higher bone density meant to increase the contact area when identical taps and screws were utilized, thereby enhancing the insertion torque. Additionally, it means that the evaluation results obtained by L-RFA are influenced by the friction related with the insertion torque and the bone density. Figs. 2(a) and (b) displayed that the observed increase in the insertion torque with higher bone density was consistent with the expectations. Furthermore, a frequency shift of the vibration peaks, indicated by black circles in Fig. 3(b), was observed, as illustrated in Figs. 3(c) and (d). The peak at \(\sim\)1400 Hz corresponds to the fundamental mode of natural vibration for the inserted tap, while the peak near 2800 Hz represents a higher-order natural vibration mode, attributed to an integer multiple of the fundamental frequency. Both peaks exhibited similar responses to the frequency shifts induced by insertion torque, demonstrating closely matched frequency shifts as reported in our previously studies 12,13. Therefore, the spectral shift by L-RFA indicates that the evaluation of both screw insertion torque (installation strength) and tap bone density is closely related to the common principle of friction.
In contrast, no specific peaks were detected at frequencies above 5000 Hz, as depicted in Fig. 3(b). The spectral shape exhibited characteristics of random noise, independent of bone density. This phenomenon can be interpreted as vibration frequency concerning the wavelength corresponding to the spacing of the pores within the bone structure. The microstructure of cancellous bone has been reported to be on the order of several tens of micrometers 24. Converting frequencies from 5000 to 20000 Hz to wavelengths yields values in the range of approximately 50–200 μm. Consequently, the induced vibration was amplified by resonance with the bone structure in contact with the tap, resulting in a spectrum that emphasizes and reflects the microscopic structure of the installation interface. Conventional X-ray techniques (such as multislice computed tomography (CT), micro-CT, and dual-energy X-ray absorptiometry) offer limited ability for accurately predicting implant stability. However, L-RFA can provide bone structural information at the implant site, suggesting its potential to enable a more precise estimation of implant stability compared to alternative methods. Additionally, employing the regression equations obtained in Figs. 3(c) and (d) or SVR demonstrated that bone density could be estimated from the L-RFA for taps, as illustrated in Figs. 4(a)–(c). The predictions in Figs. 4(a) and (b) yielded similar results, as higher-order modes of natural vibration occurred at integer multiples of the fundamental mode. However, the MSE of the prediction results utilizing SVR decreased, as depicted in Fig. 4(c), indicating an improvement in prediction accuracy. This enhanced accuracy is attributed to the capacity of the SVR model in incorporating not only natural vibration modes but also microstructural information from the bone that resonates with high-frequency vibration wavelengths. Limiting the analysis to specific frequency ranges, such as 1000–2000, 2000–3500, or 5000–20000 Hz, did not yield performance exceeding that achieved using a broader frequency range, as depicted in Fig. 4(c). This finding underscores the necessity of utilizing information from a wide frequency spectrum for accurate predictions. In addition, the slope of the SVR prediction was slightly less than 1, suggesting a proportional error. This finding suggests that accuracy can be further enhanced by multiplying the regression results by an appropriate correction factor.
In the present study, bone density was predicted by applying L-RFA during tapping. Furthermore, it was established that bone density significantly correlated with screw stability. Therefore, L-RFA possesses substantial potential for predicting implant stability during tapping. Although a direct prediction of screw insertion torque from the L-RFA of the tap was attempted while bypassing bone density, this approach did not achieve performance levels comparable to those of bone density estimation. This discrepancy likely arises because the high-frequency microstructural information obtained through the L-RFA of the tap did not correspond directly to the conditions for the subsequently inserted screw. However, given the clear correlation illustrated in Fig. 2(c), it appears that macroscopic bone density exerts a greater influence on implant stability than microscopic structure.
In an earlier investigation involving simulated bone models, Nakashima et al. 25 demonstrated that insertion torque serves as an indicator of the fixation strength of the screw along the long axis, particularly in the pull-out direction. In contrast, RFA assesses fixation strength in the short axis, especially during lateral pull-down scenarios. This distinction suggests that insertion torque and RFA may represent fundamentally different aspects of installation strength. In spinal implant surgeries, RFA may provide insights into the fixation strength relevant to the actual loads that the screw experiences, particularly as the screw is subjected to lateral forces due to gravity when the patient assumes a standing position postoperatively.
Employing this dual approach of estimating implant stability—integrating bone densitometry with L-RFA during the tapping phase—offers invaluable information that can significantly enhance the decision-making process of the surgeon. If low stability is predicted due to low bone density, multiple options become available, including the adjustment of screw size (both diameter and length), the addition of a fixed intervertebral space, the application of bone cement within the screw hole, and the consideration of utilizing an augmentation screw. Furthermore, this innovative sensor technology can be potentially applied in the rapidly advancing field of robotic surgery, as it enhances the quantitative and timely decision-making processes, while operating independently of the surgeon’s level of experience or subjective judgments.
A limitation of this study is that evaluations were conducted using a single tap diameter to achieve high predictive accuracy. Various types of taps must be assessed, given that the natural vibration modes differ according to their size and mechanical properties; thus, comprehensive L-RFA data must be gathered. In particular, bone density estimation using L-RFA for tapping process requires an SVR-based learning database tailored to each insertion length, accommodating all combinations of screw lengths and diameters. Meanwhile, further research is being conducted on SVR analysis methods, and performance improvements can be expected by combining them with new optimization methods 26. Additionally, testing with actual bone is necessary, as this evaluation was conducted using simulated bone. Special attention should be directed towards the effect of cortical bone, and continued laboratory-level verification using artificial bone remains vital for refining the method.
The measured frequency peaks were natural vibrations determined by the mechanical properties and shape of the object. When the attached position of accelerometer changes, the vibration peak increases or decreases in accordance with the fundamental and high order natural vibration shapes while the frequency remains the same. In this experiment, the accelerometer was attached on midway of the tap as shown in Fig. 1(a), which made it easy to measure the higher-order modes (around 2800 Hz) shown in Fig. 3(b). Since the SVR learns the vibration spectrum, the attachment position of the accelerometer must be strictly determined. On the other hand, the effects of the insertion depth of the taps and screws can be ignored in the analysis of this study. The vibrations measured in this experiment can be assumed to be those of a cantilever beam with the base as a fixed point. The fundamental mode frequency of the natural vibration of this cantilever beam is given by Eqs. \(\eqref{eq:1}\) and \(\eqref{eq:2}\).
5. Conclusion
In this study, data on the insertion torque for taps and screws, defined as implant stability across artificial bones of varying densities, were collected statistically. The results indicated that the insertion torque for both the tap and screw was highly dependent on bone density, with a higher bone density leading to improved implant stability. This relationship indicates that acquiring bone density information during the tapping process can facilitate the prediction of screw stability. Furthermore, bone density was effectively predicted using SVR with the vibration frequency spectrum data obtained from the L-RFA evaluation of the tap. Consequently, L-RFA provided a reliable diagnosis prior to screw placement.
In future, we expect the development of instruments based on the L-RFA methodology proposed in this study. For instance, as suggested by Nakashima et al. 12, conducting L-RFA within a hollow-structured tap can safely enable L-RFA evaluation without laser leakage. These findings underscore the potential of a novel measurement technique in surgeries involving pedicle screws, specifically for the prevention of bone nonunion.
Acknowledgments
This study was partly funded by JSPS KAKENHI JP20K14684 and JP24K15713.
- [1] R. A. Deyo, D. T. Gray, W. Kreuter, S. Mirza, and B. I. Martin, “United States trends in lumbar fusion surgery for degenerative conditions,” Spine, Vol.30, No.12, pp. 1441-1445, 2005. https://doi.org/10.1097/01.brs.0000166503.37969.8a
- [2] J. N. Weinstein, J. D. Lurie, P. R. Olson, K. K. Bronne, and E. S. Fisher, “United States’ trends and regional variations in lumbar spine surgery: 1992–2003,” Spine, Vol.31, No.23, pp. 2707-2714, 2006. https://doi.org/10.1097/01.brs.0000248132.15231.fe
- [3] J. Bredow, C. K. Boese, C. M. Werner, J. Siewe, L. Löhrer, K. Zarghooni, P. Eysel, and M. J. Scheyerer, “Predictive validity of preoperative CT scans and the risk of pedicle screw loosening in spinal surgery,” Arch. Orthop. Trauma. Surg., Vol.136, No.8, pp. 1063-1067, 2016. https://doi.org/10.1007/s00402-016-2487-8
- [4] M. Yagi, C. P. Ames, M. Keefe, N. Hosogane, J. S. Smith, C. I. Shaffrey, F. Schwab, V. Lafage, R. S. Bess, M. Matsumoto, K. Watanabe, and International Spine Study Group (ISSG), “A cost-effectiveness com-parisons of adult spinal deformity surgery in the United States and Japan,” Eur. Spine J. Vol.27, No.3, pp. 678-684, 2017. https://doi.org/10.1007/s00586-017-5274-5
- [5] A. W. Kwok, J. A. Finkelstein, T. Woodside, T. C. Hearn, and R. W. Hu, “Insertional torque and pull-out strengths of conical and cylindrical pedicle screws in cadaveric bone,” Spine, Vol.21, No.21, pp. 2429-2434, 1996. https://doi.org/10.1097/00007632-199611010-00004
- [6] T. L. Mueller, G. H. van Lenthe, M. Stauber, C. Gratzke, F. Eckstein, and R. Müller, “Regional, age and gender differences in architectural measures of bone quality and their correlation to bone mechanical competence in the human radius of an elderly population,” Bone, No.45, Vol.5, pp. 882-891, 2009. https://doi.org/10.1016/j.bone.2009.06.031
- [7] W. Lei and W. Zixiang, “Biomechanical evaluation of an expansive pedicle screw in calf vertebrae,” Eur. Spine J., Vol.15, No.3, pp. 321-326, 2006. https://doi.org/10.1007/s00586-004-0867-1
- [8] R. Ab-Lazid, E. Perilli, M. K. Ryan, J. J. Costi, and K. J. Reynolds, “Does cancellous screw insertion torque depend on bone mineral density and/or microarchitecture?,” J. Biomech., Vol.47, No.2, pp. 347-353, 2014. https://doi.org/10.1016/j.jbiomech.2013.11.030
- [9] L. Sennerby and N. Meredith, “Implant stability measurements using resonance frequency analysis: Biological and biomechanical aspects and clinical implications,” Periodontol 2000, Vol.47, pp. 51-66, 2008. https://doi.org/10.1111/j.1600-0757.2008.00267.x
- [10] P. Valderrama, T. W. Oates, A. A. Jones, J. Simpson, J. D. Schoolfield, and D. L. Cochran, “Evaluation of two different resonance frequency devices to detect implant stability: A clinical trial,” J. Periodontol., Vol.78, No.2, pp. 262-272, 2007. https://doi.org/10.1902/jop.2007.060143
- [11] K. Mikami, D. Nakashima, S. Kikuchi, T. Kitamura, N. Hasegawa, T. Nagura, and M. Nishikino, “Stability diagnosis of orthopedic implants based on resonance frequency analysis with fiber transmission of nanosecond laser pulse and acceleration sensor,” Proc. SPIE, Vol.11233, Article No.112330O, 2020. https://doi.org/10.1117/12.2544793
- [12] D. Nakashima, K. Mikami, S. Kikuchi, M. Nishikino, T. Kitamura, N. Hasegawa, M. Matsumoto, M. Nakamura, and T. Nagura, “Laser resonance frequency analysis of pedicle screw stability: A cadaveric model bone study,” J. Orthop. Res., Vol.39, No.11, pp. 2474-2484, 2021. https://doi.org/10.1002/jor.24983
- [13] S. Kikuchi, K. Mikami, D. Nakashima, T. Kitamura, N. Hasegawa, M. Nishikino, A. Kanaji, M. Nakamura, and T. Nagura, “Laser resonance frequency analysis: A novel measurement approach to evaluate acetabular cup stability during surgery,” Sensors, Vol.19, No.22, Article No.4876, 2019. https://doi.org/10.3390/s19224876
- [14] K. Mikami, M. Nemoto, A. Ishinoda, T. Nagura, M. Nakamura, M. Matsumoto, and D. Nakashima, “Improvement of machine learning-based prediction of pedicle screw stability in laser resonance frequency analysis via data augmentation from micro-CT images,” Appl. Sci., Vol.13, No.15, Article No.9037, 2023. https://doi.org/:10.3390/app13159037
- [15] K. Mikami, M. Nemoto, T. Nagura, M. Nakamura, M. Matsumoto, and D. Nakashima, “Machine learning-based diagnosis in laser resonance frequency analysis for implant stability of orthopedic pedicle screws,” Sensors, Vol.21, No.22, Article No.7553, 2021. https://doi.org/:10.3390/s21227553
- [16] D. Nakashima, K. Ishii, Y. Nishiwaki, H. Kawana, M. Jinzaki, M. Matsumoto, M. Nakamura, and T. Nagura, “Quantitative CT-based bone strength parameters for the prediction of novel spinal implant stability using resonance frequency analysis: A cadaveric study involving experimental micro-CT and clinical multislice CT,” Eur. Radiol. Exp., Vol.3, No.1, Article No.1, 2019. https://doi.org/10.1186/s41747-018-0080-3
- [17] R. H. Putra, N. Yoda, M. Iikubo, Y. Kataoka, K. Yamauchi, S. Koyama, U. Cooray, E. R. Astuti, T. Takahashi, and K. Sasaki, “Influence of bone condition on implant placement accuracy with computer-guided surgery,” Int. J. Implant. Dent., Vol.6, No.1, Article No.62, 2020. https://doi.org/10.1186/s40729-020-00249-z
- [18] J. T. Hsu, C. H. Chang, H. L. Huang, M. E. Zobitz, W. P. Chen, K. A. Lai, and K. N. An, “The number of screws, bone quality, and friction coefficient affect acetabular cup stability,” Med. Eng. Phys., Vol.29, No.10, pp. 1089-1095, 2017. https://doi.org/:10.1016/j.medengphy.2006.11.005
- [19] T. Hatakeyama, D. Nakashima, K. Mikami, A. Oya, A. Fujie, A. Sujino, M. Nakamura, and T. Nagura, “Evaluation of bone integrity around the acetabular cup using noninvasive laser resonance frequency analysis,” J. Orthop. Res., Vol.42, No.11, pp. 2552-2561, 2024. https://doi.org/:10.1002/jor.25925
- [20] R. K. Lippmann, “The use of auscultatory percussion for the examination of fractures,” The J. of Bone & Joint Surgery, Vol.14, No.1, pp. 118-126, 1932.
- [21] V. Vapnik, “Pattern recognition using generalized portrait method,” Autom. Remote Control, Vol.24, pp. 774-780, 1963.
- [22] B. E. Boser, I. M. Guyon, and V. N. Vapnik, “A training algorithm for optimal margin classifiers,” Proc. 5th Annu. Workshop Comput. Learn Theory, pp. 144-152, 1992. https://doi.org/:10.1145/130385.130401
- [23] K. Mikami, A. Ishinoda, and M. Nemoto, “Characterization of laser-induced photothermal vibration for young’s modulus imaging toward computer-aided detection,” Appl. Sci., Vol.13, No.6, Article No.3639, 2023. https://doi.org/:10.3390/app13063639
- [24] L. D. Carbonare and S. Giannini, “Bone microarchitecture as an important determinant of bone strength,” J. Endocrinol Invest., Vol.27, No.1, pp. 99-105, 2004. https://doi.org/:10.1007/BF03350919
- [25] D. Nakashima, K. Ishii, M. Matsumoto, M. Nakamura, and T. Nagura, “A study on the use of the Osstell apparatus to evaluate pedicle screw stability: An in-vitro study using micro-CT,” PLoS One, Vol.13, No.6, Article No.e0199362, 2018. https://doi.org/10.1371/journal.pone.0199362
- [26] J. Xie, T. Sun, J. Zhang, and W. Zhang, “A new hybrid method for parameter optimization of SVR,” J. Adv. Comput. Intell. Intell. Inform., Vol.22, No.2, pp. 271-279, 2018. https://doi.org/10.20965/jaciii.2018.p0271
This article is published under a Creative Commons Attribution-NoDerivatives 4.0 Internationa License.