Research Paper:
Research on Lead Stripping Area Detection Method and Application Based on YOLOv7
Jinglong Liu*, Yonghua Xiong*,†
 , Zhengfa Zhang*, and Jinhua She*,**
*School of Automation, China University of Geosciences
No.388 Lumo Road, Hongshan District, Wuhan, Hubei 430074, China
†Corresponding author
**School of Engineering, Tokyo University of Technology
1404-1 Katakuramachi, Hachioji, Tokyo 192-0982, Japan

To automate the wiring process for distribution network live-line operation robots, it is essential for visual sensors to accurately detect and locate the stripped areas of wires. However, due to the complex layout of power transmission lines and the varying outdoor lighting conditions, accurately identifying the stripped regions remains challenging. In this paper, we first construct a dataset of stripped wire areas and perform data augmentation to address the issue of limited samples. Subsequently, we apply a Transformer-based adaptive image enhancement model for image preprocessing, aiming to improve visual quality. Experimental results show that this model can enhance or correct lighting in a short time while preserving the primary color characteristics. Based on this, we design a stripped wire region detection model using an improved YOLOv7 algorithm, achieving high-precision, real-time detection in complex backgrounds. Tests with real-world data demonstrate an average detection accuracy exceeding 92%, effectively addressing the need for precise wire detection and localization during automated wiring in distribution networks, thereby advancing the development of smart grids.
1. Introduction
Live-line work refers to the operation of maintenance, replacement of components, or testing on high-voltage electrical equipment without interrupting power supply, thus preventing the economic and social losses caused by power outages. However, current field operations still heavily rely on manual labor, which poses significant threats to personal safety. Operating in high-voltage environments can lead to accidents such as electric shocks, burns, and falls, resulting in approximately 200 deaths annually in China, which account for over 40% of all fatalities in the power industry 1.
With the widespread use of smart devices in power systems, manual operations in live-line work are gradually being replaced by robots 2. Since the introduction of Japan’s first power line robot in 1988, various types of live-line work robots have emerged. These robots can perform precise operations in high-voltage environments, monitor and record the operation process in real time through sensors and cameras, and transmit or store the results via wireless communication or data storage. Operators can observe the work environment through real-time video information from visual sensors fixed on the robot arm and remotely control the robotic arm for live-line work.
In distribution system live-line operations, wire stripping and other wiring tasks account for 41.7% of the total workload 3,4. A key task involves overlapping the stripped end of a lead wire with the stripped area on the main transmission line and securing them with a connector, as shown in Fig. 1.
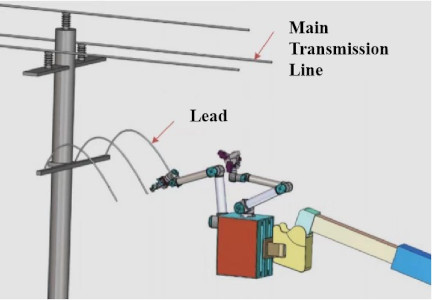
Fig. 1. Lead connection task performed by the robot.
Therefore, it is crucial to use visual sensors to detect and locate the stripped area to guide the robot’s operations. However, due to the diversity of power transmission line layouts and the uncertainty of the working environment, visual sensors may be interfered with by outdoor lighting conditions, posing multiple challenges for the live-line work robots in automatic operations. For example, the robot needs to accurately detect and locate transmission lines under varying weather conditions and adapt to complex lighting environments. Whether it’s in the bright sunlight of noon or in dim lighting at night, the robot must be able to perform under different working conditions 5. Additionally, sufficient real-time performance and stability are required to ensure fast and precise operations in high-voltage environments. Therefore, addressing the issue of abnormal images captured by visual sensors under complex lighting conditions and improving the detection and localization capabilities of the robot’s visual sensors are particularly important in lead connection tasks.
To overcome these challenges, this paper proposes a novel two-stage framework. The first stage introduces a lightweight adaptive image enhancement transformer, Adaptive Image Enhancement Transformer (AIET), which uniquely simulates the camera ISP pipeline to handle extreme lighting conditions in real-time. The second stage presents SDG-YOLOv7, a detection model where we strategically integrate dynamic snake convolution (DSC) to specifically capture the elongated wire morphology, a parameter-free SimAM attention to highlight fine features without risking overfitting on our custom dataset, and a Ghost module to ensure real-time performance on robotic platforms. This synergistic combination of specialized modules allows our method to achieve the high accuracy and efficiency required for live-line work.
3. Transformer-Based Adaptive Image Enhancement Model for Lead Stripping Areas
Due to the complex and variable lighting conditions in live-line operations of power systems, overexposure or underexposure issues may arise, especially during emergency repairs, leading to images with overexposure or underexposure. Therefore, it is essential to reduce or even eliminate overexposure.
3.1. Exposure Judgment Module Design for Lead Stripping Area Images
A crucial process in image enhancement tasks is to assess the exposure condition of an image and make corresponding adjustments. Existing neural network-based enhancement methods typically focus solely on the enhancement task itself, with little attention given to the exposure condition judgment. Traditional methods either count the number of pixels with brightness above a certain threshold, classifying them as overexposed if they exceed the threshold 14, or use pixel smoothness between adjacent pixels to detect regions with abrupt brightness changes 15. These methods are computationally complex and fail to address both the overall and local brightness information of the image. Support vector machines (SVMs) are simple in structure and have low inference computational complexity, which improves the real-time recognition performance of lead stripping areas in complex backgrounds. During training, SVM can also adjust the classification preference for images with different exposures through classification labels. Therefore, we propose an SVM-based exposure judgment module, utilizing the brightness information of the image to automatically determine the exposure condition of the image.
For exposure judgment, the key parameters to consider are the pixel distributions in low-brightness areas for underexposed images and in high-brightness areas for overexposed images, as shown in Fig. 2.
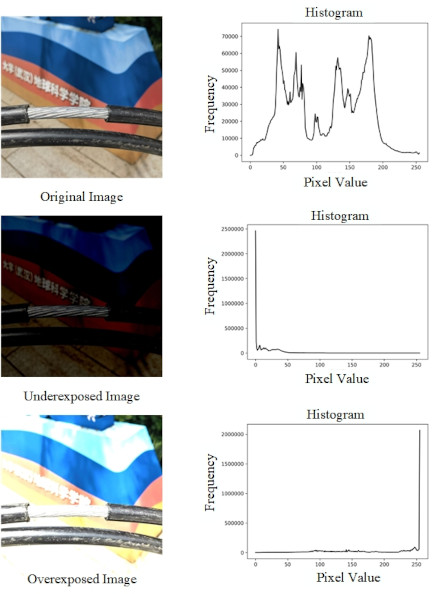
Fig. 2. Histograms of images under three lighting conditions.
The exposure condition of an image is directly related to the mean and median of its histogram. By converting the RGB image to the HSI color space and extracting the brightness component \(I\), we can calculate the histogram of the brightness distribution of a color image. Therefore, the mean brightness can be used as parameter \(x\), and experimental results show that the median brightness offers better separability, so it is selected as parameter \(y\).
The SVM algorithm used for exposure judgment is as follows:
-
Step 1:
Convert the input image from RGB to HSI color space, extract the \(I\) component, and calculate the histogram to obtain the mean \(\mathit{mean}\) and median \(\mathit{median}\).
-
Step 2:
Define the input vector as \(\boldsymbol{x}=[\mathit{mean}, \mathit{median}]\), and the exposure decision boundary can be represented as
\begin{align} g(x) = \boldsymbol{w}^{T}\boldsymbol{x}_{i} + w_{0} = \pm 1. \label{eq:eq1} \end{align} -
Step 3:
The distance \(\{g(\boldsymbol{x})\}/\|\boldsymbol{w}\|\) from point \(\boldsymbol{x}\) to the exposure decision line is calculated. When two points closest to the decision line have the same maximum distance, the decision line can be defined as
\begin{align} \frac{1}{\|\boldsymbol{w}\|} + \frac{1}{\|\boldsymbol{w}\|} = \frac{2}{\|\boldsymbol{w}\|}. \label{eq:eq2} \end{align} -
Step 4:
Maximizing the distance means minimizing the cost function \(J(\boldsymbol{w}) = {1/2} \cdot \|\boldsymbol{w}\|^{2}\) and satisfying the condition \(y_{i}(\boldsymbol{w}^{T}\boldsymbol{x}_{i} + w_{0}) \geq 1\). This is a convex optimization problem.
-
Step 5:
The convex optimization problem gives a unique solution, which is used as the exposure decision boundary, with the corresponding vector as the support vector.
In practical applications, exposure judgment needs to distinguish between three categories (underexposed, normal, and overexposed), and there may be intercrossing points at the boundaries between different categories. Thus, the SVM for binary classification needs to be modified: first, by using a kernel function to map the multi-class problem to higher dimensions for classification, and second, by introducing slack variables to mitigate the influence of crossing points on the decision boundary.
The first step is to use a kernel function to map the input to a higher-dimensional space, where the exposure decision surface can be obtained after classification. In this paper, we choose a linear function based on accuracy and computational speed to reduce computational complexity:
Next, slack variables \(\xi_{i}\) are introduced to modify the cost function as
Through this method, SVM can classify images into three exposure types, enabling the selection of the appropriate method for subsequent processing. The experiment used a linear kernel function with a penalty coefficient \(C = 0.0004\), and trained the SVM on 112 images each from the underexposed, normal, and overexposed categories. The resulting decision line is shown in Fig. 3.
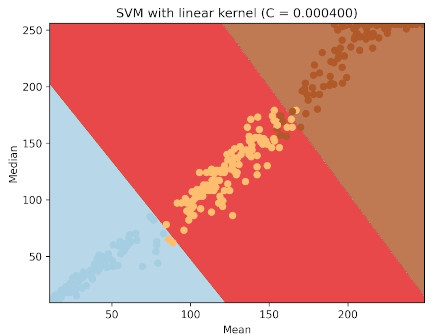
Fig. 3. SVM training results.
The trained SVM model achieved an accuracy of 97.7% in exposure classification, indicating strong overall performance in the classification task. Misclassifications primarily occurred in the boundary regions between the three categories, where image brightness features have transitional properties and overlap with neighboring categories. Such cases are difficult to definitively resolve even with human judgment, showing that the model’s misclassification points mainly occur in these ambiguous boundary regions, with minimal impact on overall classification performance.
Moreover, the subsequent image enhancement module compensates for the bias caused by these misclassification points by adaptively adjusting the brightness distribution in the boundary regions, ensuring that classification errors do not significantly affect the enhancement results. Furthermore, the SVM model, with an accuracy of 97.7%, demonstrates high robustness, meaning it can still perform relatively stably in classification tasks even when faced with complex lighting conditions and ambiguous boundary features. This indicates that the model not only performs excellently in regions with clearly defined data distributions under normal exposure conditions, but also exhibits high adaptability under both underexposed and overexposed conditions, meeting the practical requirements for image exposure classification in complex scenarios. Based on this analysis, the SVM model, by accurately capturing brightness distribution features and utilizing the compensatory mechanism of the subsequent enhancement module, shows good classification accuracy and robustness, providing a reliable foundation for subsequent image processing.
3.2. Lightweight Adaptive Image Enhancement Model Based on Transformer
While models like CCNet and EMANet are efficient, they are not designed to reverse the complex ISP pipeline essential for accurate lighting correction. To address this specific challenge, we propose the Adaptive Image Enhancement Transformer (AIET), a lightweight model specifically architected for this task. Its key advantage lies in a dual-branch structure that simulates the image formation process: a global branch estimates ISP parameters (e.g., color matrix, gamma), and a local branch performs pixel-level adjustments. This task-specific design makes AIET fundamentally more suitable for image enhancement than general-purpose backbones. The design of AIET also specifically addresses the parameter size and computational complexity bottlenecks of traditional Transformer models. It incorporates a series of lightweight optimization strategies to significantly reduce computational resource consumption while ensuring effective image enhancement results. This approach ensures image enhancement quality while meeting the real-time requirements in live-line operations.
In the current image processing flow, the sensor captures lighting data and converts it to raw RGB data. The image signal processing (ISP) algorithm then performs nonlinear operations such as color correction, exposure adjustment, and gamma correction on the raw data to produce the final sRGB image. Since the original lighting conditions of the image are represented by the raw RGB data, it is difficult to perform lighting correction on the transformed sRGB data. Therefore, most image enhancements are based on the raw RGB data rather than the sRGB data 16.
Considering that digital imaging systems typically output sRGB images, we need to design a reverse color space transformation algorithm to process the image in the original RGB space.
In this paper, we treat \(F\) and \(G\) from the Transformer algorithm as two branches: a local branch for pixel-level adjustments and a global branch for computing ISP-related transformations.
Let the input sRGB image be represented as \(I_{i} \in R^{H \times W \times 3}\), where \(H \times W \times 3\) represents the image size and 3 is the number of channels (\(r\), \(g\), and \(b\)). The processed image after enhancement by the image enhancement model is represented as \(I_{t} \in R^{H \times W \times 3}\), and the enhancement algorithm can be expressed as
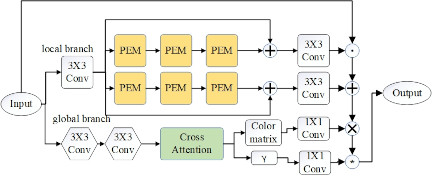
Fig. 4. Structure diagram of adaptive image enhancement module based on transformer.
The reverse transformation process is fitted using a least-squares method, decomposed into multiplication graph \(\mathrm{M}\) and addition graph \(\rm A\) for pixel-level operations, and expressed as
The final transformation process that integrates local and global branches is given in the following equation:
As previously described, this module uses parts of the camera ISP process, consisting of the local and global branches, which estimate both local and global image parameters. The Transformer-based adaptive image enhancement module can transform images under complex lighting conditions into corrected images, with the model structure shown in Fig. 4. Here, \(\odot\) denotes the element product, used to calculate the product of two matrices corresponding to the positional elements; \(\otimes\) denotes the element sum, used to calculate the sum of two matrices corresponding to the positional elements; \(\oplus\) denotes the matrix multiplication, used to calculate the product of two matrices; and \(\circledast\) denotes the power-taking operation.
The local branch is primarily responsible for performing pixel-level adjustments on the input image, estimating parameters \(\mathrm{M}\) and \(\mathrm{A}\). Using pixel-level multiplication and addition graphs, the input image undergoes least-squares adjustments to achieve local, pixel-based image enhancement, which preserves image details while fine-tuning aspects such as brightness, contrast, and color. The input image is first expanded through a \(3 \times 3\) convolution module, then passed into two independent branches for computation.
To reduce the number of parameters, we use a pixel-wise enhancement module (PEM) to replace the self-attention mechanism in the Transformer 17. On one hand, PEM serves as the core of the local branch, enabling efficient pixel-level feature processing through lightweight design while significantly reducing computational complexity. PEM includes position encoding layers, depthwise separable convolution layers, and point convolution layers: the position encoding layer retains pixel spatial information, the depthwise separable convolutions reduce computational complexity and improve feature extraction efficiency, and the point convolution optimizes channel dimensions. On the other hand, PEM introduces light normalization, using trainable parameters to dynamically adjust the feature distribution to adapt to complex lighting conditions. Additionally, matrix fusion techniques are employed to reduce redundant computations, further improving module efficiency. Multiple PEM modules are stacked to form the local branch, optimizing step by step and accumulating pixel-level adjustments to preserve the image’s brightness, contrast, and details, ensuring feature integrity. Overall, this module strikes a balance between lightweight design and performance optimization, providing crucial support for pixel-level image enhancement and laying a foundation for efficient enhancement in complex scenarios.
The global ISP branch’s role is to estimate global components \(W\) and gamma values \(\gamma\), simulating part of the camera ISP process (such as gamma correction, color matrix transformation, and white balance). It uses a global prediction module (GPM) to control and adjust the parameters \(W\) and \(\gamma\) using learnable query vectors 18. The GPM first extracts features through two lightweight convolution encoders, processing the image at low resolution to reduce computational load while preserving high-level feature information for analyzing the overall relationship in the image. The extracted information is then processed by the GPM to decode and predict \(W\) and \(\gamma\). The GPM consists of attention layers and feed-forward network layers, using trainable query vectors to generate global context representations and ensure training stability. Finally, the GPM outputs a 10-dimensional vector representing the ISP parameters.
The outputs from both the local and global branches are combined through multiplication and addition operations, followed by nonlinear ISP transformations to produce the enhanced image. The lightweight design primarily achieves efficiency by replacing the self-attention mechanism with PEMs, modeling global features at low resolution, and integrating modules with parameter reuse. While traditional Transformer self-attention mechanisms have strong feature modeling capabilities, their computational complexity increases quadratically, making them unsuitable for real-time applications. Therefore, the PEM is used to balance computational efficiency and adaptability. The global branch uses the lightweight GPM to reduce computational load by extracting low-resolution features, ensuring accurate global feature modeling. Compared to processing high-resolution features directly, GPM not only improves computational efficiency but also ensures accurate modeling of global features. In the design of both the local and global branches, this paper further reduces redundant parameters through module integration and parameter reuse, achieving a lightweight model.
4. Lead Stripping Area Detection Algorithm Based on Improved YOLOv7
In this paper, we propose the SDG-YOLOv7 model, which is an improvement on the original YOLOv7 model. YOLOv7 19 is a version of the YOLO 20 series of object detection algorithms, which, based on YOLOv4 21, has undergone extensive optimization to improve detection accuracy and real-time performance. SDG-YOLOv7 builds upon the original YOLOv7 model by introducing the SimAM attention mechanism and DSC, enhancing the model’s ability to detect targets in complex backgrounds. Additionally, the Ghost module replaces traditional convolutions and introduces staged convolution calculations, significantly reducing computational complexity and storage requirements, improving the model’s speed, and reducing the number of parameters, while ensuring detection accuracy and achieving model lightweighting.
4.1. SimAM Attention Mechanism
In the YOLOv7 head network 19, the MP module is mainly responsible for performing downsampling to reduce the number of pixels in the image. This helps to decrease computational load while retaining the main features of the image and ignoring less significant changes, making the features more prominent and stable. In this paper, we introduce the SimAM attention mechanism in the MP2 module, as shown in Fig. 5, to help the network better capture key information of the targets, thereby improving the feature representation capability of the model.
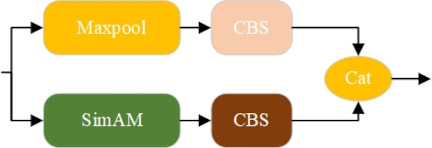
Fig. 5. Improved structure diagram of SimAM attention mechanism.
The core idea of SimAM is the spatial suppression effect 22, which suggests that neurons with spatial suppression effects should be given higher importance. The most direct method to identify these important neurons is by measuring the linear separability between neurons. By employing the SimAM mechanism, we achieve high computational efficiency without additional parameters, and the model demonstrates excellent detection performance even in complex backgrounds.
4.2. Dynamic Snake Convolution Network
Considering the morphological features of the lead stripping areas (mainly straight lines or slightly curved lines), we introduce DSC in this paper. DSC is a novel convolution operation inspired by the observation and understanding of the special characteristics of tubular structures 23. By combining DSC with multi-view features and considering the orientation and perspective changes of tubular structures, DSC can more accurately capture the structural features of the lead stripping areas. DSC not only captures local detail information but also incorporates global structural information, providing a more comprehensive and accurate feature representation, which helps the model better understand the morphology of the wires and improves detection accuracy.
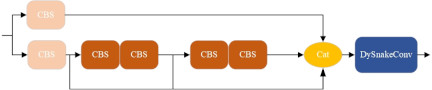
Fig. 6. Improved structure diagram of dynamic snake convolutional network.
In this paper, DSC is introduced in the YOLOv7 19 network to replace the last CBS module in the ELAN module, as shown in Fig. 6, allowing the lead stripping area detection model to better understand the shape of the wires, thereby further improving detection accuracy. At the same time, DSC can process the complex and varied global shape features, enhancing the overall feature representation capability.
4.3. Model Lightweight Design
The introduction of the SimAM attention mechanism and DSC increases the number of parameters and computational load of the model. To meet the real-time requirements of distribution network live-line operations, we performed a lightweight design for the improved YOLOv7 model by employing the Ghost module to optimize the model’s performance. The Ghost module significantly reduces the model’s complexity, parameter count, and computational load, making the model more efficient and compact, thus adapting to real-time processing requirements. The Ghost module, proposed in 2020 24, solves the feature redundancy problem caused by the stacking of many convolutional layers in dynamic convolutional neural networks in an efficient and cost-effective manner.
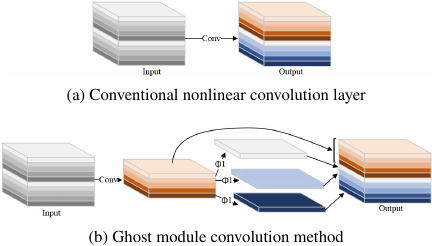
Fig. 7. Comparison diagram of Ghost module convolution method and conventional convolution method.
As shown in Fig. 7, two different convolution layer designs can be observed. Fig. 7(a) illustrates a conventional nonlinear convolution layer, while Fig. 7(b) represents the Ghost module introduced in this paper. Unlike traditional convolutions, which directly use a large number of convolution kernels to process the input feature maps, the Ghost module first generates preliminary feature maps with fewer nonlinear convolutions, then expands these features using low-cost linear convolutions, ultimately combining the results of both nonlinear and linear convolutions to generate the complete output feature map. This design significantly reduces the model’s computational complexity and parameter count, while maintaining a high level of feature representation capability.
The advantage of this design lies in reducing the density of nonlinear convolutions, which lowers the parameter count and resource consumption. The addition of linear convolutions effectively expands the feature channels and minimizes feature redundancy. This characteristic of the Ghost module makes it particularly suitable for real-time and efficient applications, such as distribution network live-line operations, which require both model compactness and performance.
Although the Ghost module optimizes the model’s lightweight design, it may slightly reduce the ability to capture complex features, especially in processing complex backgrounds or small targets. However, overall, this design strikes a good balance between detection accuracy and computational efficiency by carefully combining nonlinear and linear convolutions. The unique feature generation method provides strong support for lightweight models. These operations can significantly reduce the network’s parameter and computational requirements while maintaining the size and channel count of the original feature maps. This resolves the issues of increased computational load and parameter count caused by the introduction of the SimAM attention mechanism and DSC in the YOLOv7 model, making the improved model more suitable for real-world distribution network live-line operations.
4.4. Overall Detection Pipeline
The proposed solution for lead stripping area detection is a two-stage pipeline that integrates image enhancement and object detection. First, the input image is processed by our adaptive image enhancement framework. This involves an initial assessment of the lighting conditions using the SVM-based exposure judgment module, followed by enhancement using the AIET model to correct for issues like over- or under-exposure and improve visual clarity. Second, the enhanced image is fed into the SDG-YOLOv7 model for high-accuracy object detection. The model identifies and localizes the lead stripping areas, outputting their bounding box coordinates. The complete workflow is summarized in Algorithm 1.

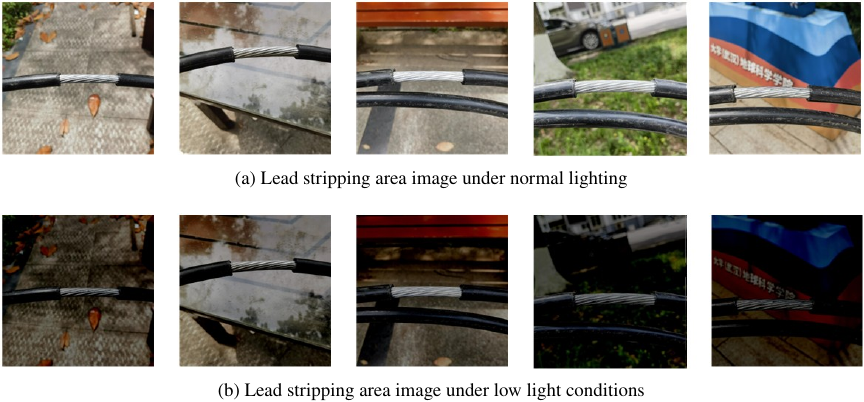
Fig. 8. Images of lead stripping area under normal lighting and simulated low light conditions.
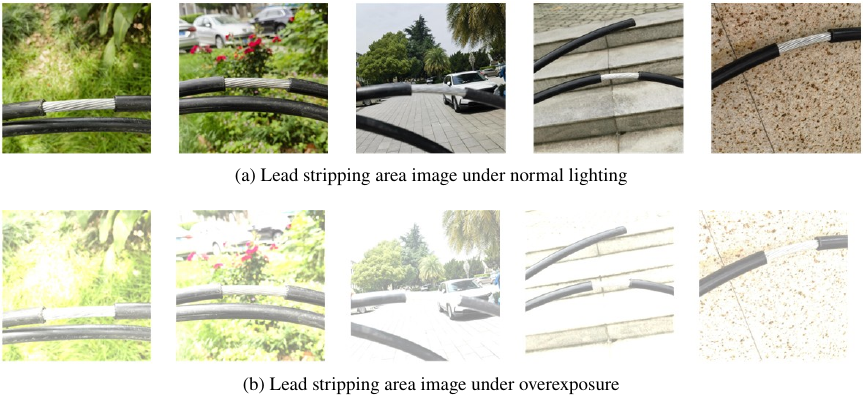
Fig. 9. Images of lead stripping area under normal lighting and simulated overexposure conditions.
5. Experimental Results and Analysis
5.1. Dataset Construction
A critical prerequisite for training a robust detection model is a large-scale, high-quality dataset. We first investigated existing public datasets for power systems, such as the Chinese Power Line Insulator Dataset and other overhead line inspection datasets. However, we found that these datasets primarily focus on common components like insulators, towers, and spacers. To the best of our knowledge, no publicly available dataset contains specific annotations for the lead stripping areas required for robotic wiring tasks. The unique and fine-grained nature of this target necessitated the creation of a specialized dataset.
To address this gap, we constructed a dedicated Lead Stripping Area Dataset. The dataset was collected from multiple distribution network maintenance sites under a wide variety of real-world conditions. The key characteristics are as follows:
-
Data source and diversity: The dataset comprises 1000 original high-resolution images captured using both robotic arm-mounted cameras and handheld devices. The images encompass diverse scenarios, including varying weather (sunny and cloudy), lighting conditions (strong daylight, shadows, and backlighting), and complex backgrounds (foliage, buildings, and sky).
-
Data splitting: The dataset was randomly divided into training, validation, and testing sets following an \(8:1:1\) split, ensuring no overlap between sets to allow for objective evaluation.
-
Augmentation: To enhance model robustness and prevent overfitting, we applied extensive data augmentation techniques, including random horizontal and vertical flips, rotations, scaling, and color space adjustments (brightness, contrast, and saturation).
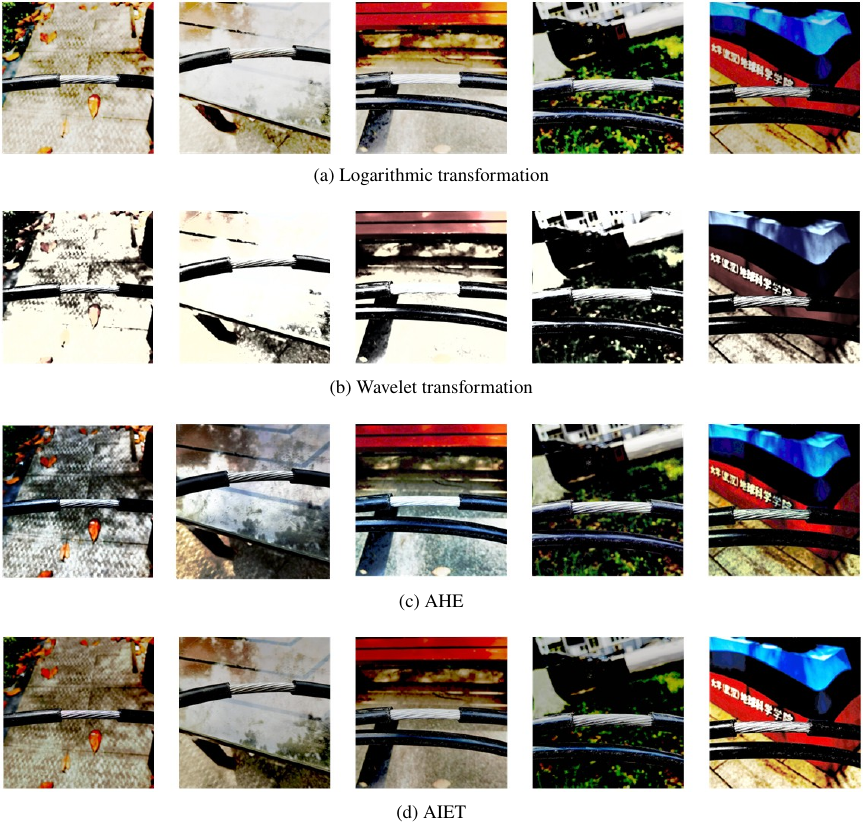
Fig. 10. Results of different image enhancement algorithms.
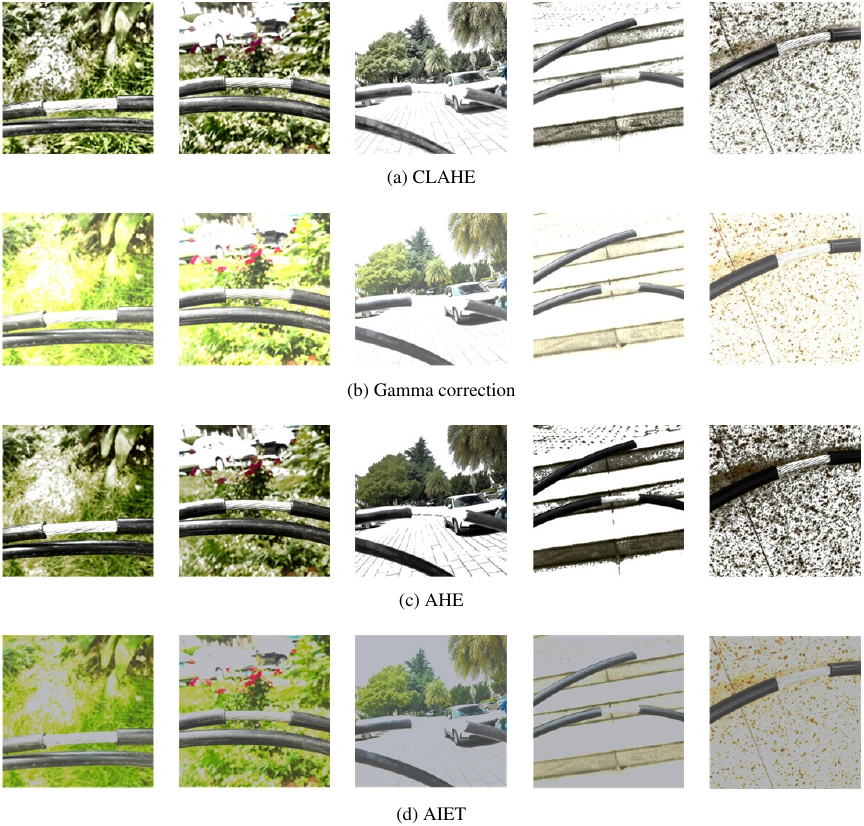
Fig. 11. Results of different image overexposure correction algorithms.
5.2. Adaptive Image Enhancement Algorithm
In this paper, the performance of the image enhancement algorithm is primarily evaluated through subjective observation, supplemented by parameters such as processing time, average values and standard deviations of image color and brightness in the histogram, and other performance metrics. Additionally, peak signal to noise ratio (PSNR) is used as an evaluation metric to quantify the similarity between the enhanced image and the original image 25. The higher the PSNR value, the more accurately the image enhancement algorithm preserves the original image characteristics.
We randomly selected 50 digital images with a size of \(224 \times 224\) from the lead stripping area image dataset for experimental observation. Due to experimental constraints, we adjusted the exposure coefficients of these 50 randomly selected images to simulate images of lead stripping areas under different lighting conditions, and used them as input images to test the performance differences among various image enhancement algorithms.
Due to space limitations, we selected 10 representative images from the 50 images to display and analyze the results of different image enhancement algorithms. These sample images are shown in Figs. 8(a) and 9(a).
Figure 8 shows the original image of the lead stripping area, and the image simulated under low-light conditions by randomly adjusting the exposure coefficient. Fig. 9 shows the original image of the lead stripping area and the image simulated under high-light conditions. As seen in Figs. 8(b) and 9(b), some images generated by adjusting the exposure coefficients under complex lighting conditions make it difficult for the human eye to discern the main subject information in the image, providing a good environment to compare the performance of different image enhancement algorithms.
For the low-light environment simulated lead stripping area image shown in Fig. 8(b), the processing results of each image enhancement algorithm are shown in Fig. 10. By comparing the untreated original sample image from Fig. 8(a), it can be seen from Fig. 10 that for low-light environment lead stripping area images, logarithmic transformation, wavelet transformation, and adaptive histogram equalization (AHE)-enhanced images all exhibit some color bias, losing some of the original image’s color information. These images tend to be overprocessed, and parts of the lead stripping area appear washed out, lacking authenticity.
Table 1. Performance of different image enhancement algorithms under low light conditions.

For the overexposed simulated lead stripping area image shown in Fig. 9(b), the processing results of various exposure correction algorithms are shown in Fig. 11. Comparing with the untreated original sample image from Fig. 9(a), AHE shows some color bias, resulting in the loss of image details and introducing noise, while gamma correction and other methods lead to color distortion and excessive contrast.
It can be observed that, in comparison to other image enhancement algorithms, the proposed AIET model demonstrates significant advantages. AIET outperforms other algorithms in both improving the overall image brightness and preserving the original colors.
To make a more objective comparison of the performance of various image enhancement algorithms, we selected the second-to-last image in Fig. 8(b) and the first image in Fig. 9(b) as input test images and recorded the performance results of each algorithm, as shown in Table 1.
In Table 1, the first row shows the parameter information of the untreated lead stripping area image, and the second row shows the parameter information of the simulated low-light environment lead stripping area image.
In the low-light image enhancement experiments, AIET exhibited the shortest processing time, which will have significant advantages for large-scale image processing tasks, especially in high-real-time applications such as live-line operations in distribution networks, where AIET shows better performance.
Table 2. Performance of overexposure image enhancement algorithms.

Besides processing time, handling brightness and color is crucial in the image enhancement process. Based on the data from Tables 1 and 2, it can be observed that AIET’s results for brightness and color are closer to the original image, indicating that AIET effectively improves the visual quality of the image while maintaining its original characteristics. Moreover, the images enhanced by AIET also exhibit the highest PSNR, demonstrating that AIET preserves the most information from the original image, thus maximizing the retention of the original image’s details during the enhancement process.
5.3. Lead Stripping Area Detection Algorithm
To comprehensively evaluate the performance of the SDG-YOLOv7 model proposed in this paper, a series of comparative and ablation experiments were conducted.
5.3.1. Experimental Environment and Initial Parameter Settings
The experiments were conducted on a Linux system. The specific experimental environment and related configuration details are provided in Tables 3 and 4.
Table 3. Experimental environment and related configuration information.

Table 4. Initial parameter settings table.

Table 3 includes information about the hardware, operating system, programming language, and frameworks used. Table 4 provides the initial parameters for training and validation, such as learning rate, batch size, and number of epochs.
5.3.2. Comparative and Ablation Experiments
To demonstrate the effectiveness and superiority of the proposed SDG-YOLOv7 model, we conducted comparative experiments against current mainstream object detection models, including YOLOv5s and YOLOv8 20, as well as the classic Faster-RCNN and SSD models. By observing the mAP values 19 during the training process, we can assess the model’s performance. Fig. 12 shows the accuracy comparison of various models.
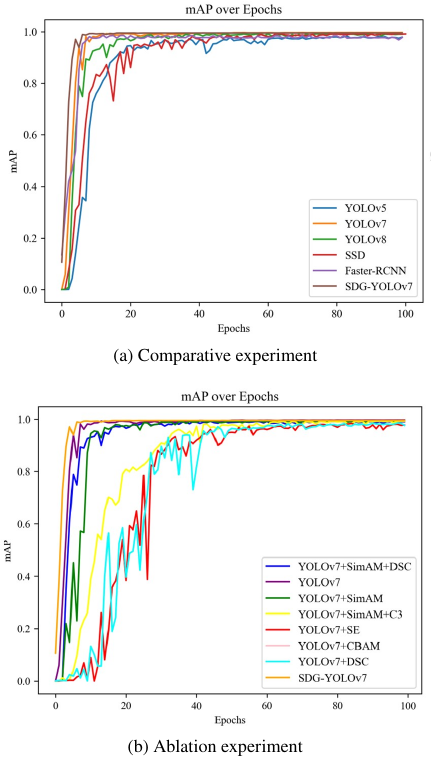
Fig. 12. Comparison of training accuracy for different models.
The comparison and ablation experiments shown in Fig. 12 indicate that the SDG-YOLOv7 model proposed in this paper reaches the highest mAP value the fastest compared to other mainstream object detection algorithms, demonstrating superior performance in detecting lead stripping areas.
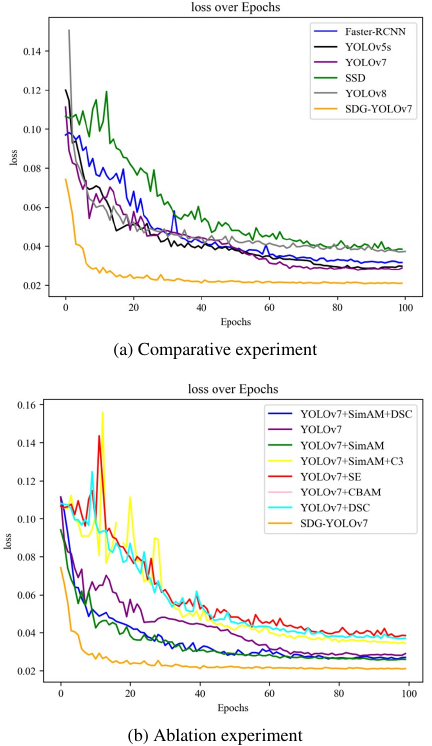
Fig. 13. Comparison of convergence speed for different models.
Figure 13 illustrates the convergence speed of various models. It is evident that the SDG-YOLOv7 model converges the fastest, significantly outperforming other models. Additionally, SDG-YOLOv7 achieves the lowest bounding box regression loss among all tested models, indicating that it can predict the target locations with high precision, which is a critical aspect of object detection tasks.
Table 5. Comparison of fps and GFLOPs for different models.

To provide a comprehensive and objective evaluation of model efficiency, we assessed two key metrics: frames per second (fps) and giga floating point operations (GFLOPs). While fps measures real-world processing speed on our specific hardware configuration, it can be influenced by code optimization and system environment. Therefore, we also include GFLOPs as a hardware-agnostic metric to more accurately represent the computational complexity and theoretical performance of each model. A lower GFLOPs value indicates a more computationally efficient model.
The results in Table 5 clearly illustrate the trade-offs between computational complexity (GFLOPs) and processing speed (fps). For instance, applying the Ghost module to the baseline YOLOv7 reduces its computational load from 103.2 to 87.6 GFLOPs, which translates to a higher processing speed of 172.5 fps, all while maintaining high detection accuracy. Conversely, integrating the more powerful SimAM attention and DSC significantly increases the model’s complexity to 158.1 GFLOPs, causing the processing speed to drop to 67.5 fps, which is insufficient for real-time application. This highlights the critical role of the Ghost module in our final SDG-YOLOv7 model. It effectively mitigates the complexity introduced by SimAM and DSC, reducing the GFLOPs to a more manageable 128.2. This substantial reduction in computational demand enables the model to achieve a high processing speed of 176.9 fps. Considering the practical need for both high precision and real-time performance in operational tasks, the SDG-YOLOv7 model strikes a superior balance, achieving high fps with a reasonable GFLOPs value compared to the other configurations.
To further evaluate the performance of the SDG-YOLOv7 algorithm proposed in this study, we used a representative video sample of lead stripping areas and compared its detection results with those from mainstream detection algorithms. The Intersection over Union (IoU) threshold was set to 0.5, and the confidence threshold was set to 0.3. Fig. 14 shows the specific detection results of a frame in the video compared with other mainstream algorithms.
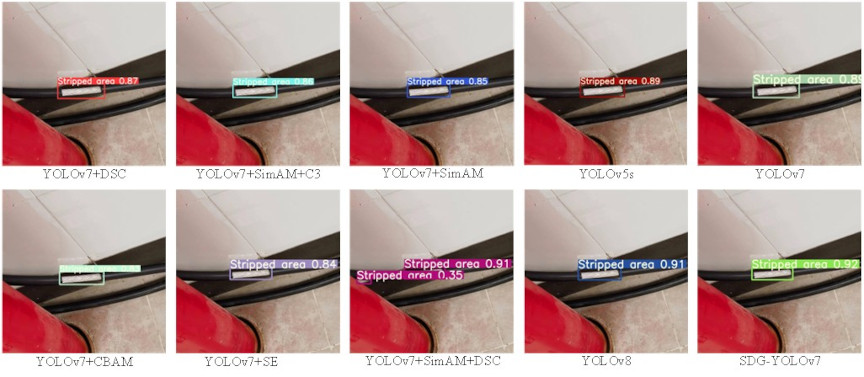
Fig. 14. Comparison diagram of detection results for different algorithms.
As seen in Fig. 14, all algorithms demonstrated good performance in detecting lead stripping areas. Even the lowest confidence model achieved a detection confidence of 83%. Despite good detection accuracy in other models, false positives still occurred during detection. The SDG-YOLOv7 model proposed in this paper achieved a detection confidence of 92% for the lead stripping area image, outperforming other models, thus demonstrating its superiority in handling the lead stripping area detection task.
6. Conclusions
In distribution network live-line operations, the complex lighting environment significantly impacts the image quality of visual sensors, which in turn severely affects the detection accuracy of lead stripping areas. There is also a scarcity of lead stripping area image samples in distribution network live-line work, and no publicly available datasets. To address this, this paper proposes a preprocessing method for lead stripping area images under complex lighting conditions and a detection method based on an improved YOLOv7 algorithm. Additionally, a dedicated dataset for lead stripping areas is established to enhance the detection efficiency and accuracy of these regions. Tests with real-world data demonstrate that the proposed method achieves an average detection accuracy of over 92%, meeting the practical application needs for distribution network live-line work, with promising practicality and potential for broader adoption.
Acknowledgments
This work was supported in part by the National Natural Science Foundation of China under Grants No.61873249.
- [1] H. Zhao et al., “Autonomous live working robot navigation with real-time detection and motion planning system on distribution line,” High Voltage, Vol.7, No.6, pp. 1204-1216, 2022. https://doi.org/10.1049/hve2.12221
- [2] M. Perez-Ramirez, G. Arroyo-Figueroa, and A. Ayala, “The use of a virtual reality training system to improve technical skill in the maintenance of live-line power distribution networks,” Interactive Learning Environments, Vol.29, No.4, pp. 527-544, 2021. https://doi.org/10.1080/10494820.2019.1587636
- [3] X. Zhang et al., “Measurement and analysis of key influencing factors in the cost of equipment assets of distribution network operation and maintenance cost,” 7th Int. Symp. on Advances in Electrical, Electronics, and Computer Engineering (SPIE Proc. Vol.12294), Article No.122p41B, 2022. https://doi.org/10.1117/12.2640486
- [4] B. Zhang, J. Song, Q. Liu, and Y. Yan, “Wear-YOLO: Research on detection methods of safety equipment for power personnel in substations,” 5th Int. Conf. on Clean Energy and Electric Power Engineering, pp. 274-278, 2024. https://doi.org/10.1109/ICCEPE62686.2024.10931509
- [5] W. Jiang et al., “Research on key technologies of multi-task-oriented live maintenance robots for ultra high voltage multi-split transmission lines,” Industrial Robot, Vol.48, No.1, pp. 17-28, 2020. https://doi.org/10.1108/IR-03-2020-0066
- [6] F. Shuang et al., “PLE: Power line extraction algorithm for UAV-based power inspection,” IEEE Sensors J., Vol.22, No.20, pp. 19941-19952, 2022. https://doi.org/10.1109/JSEN.2022.3202033
- [7] Y. Chen et al., “Intelligent power distribution live-line operation robot systems based on stereo camera,” High Voltage, Vol.8, No.6, pp. 1306-1318, 2023. https://doi.org/10.1049/hve2.12349
- [8] Y. Zhang, X. Shi, H. Zhang, Y. Cao, and V. Terzija, “Review on deep learning applications in frequency analysis and control of modern power system,” Int. J. of Electrical Power & Energy Systems, Vol.136, Article No.107744, 2022. https://doi.org/10.1016/j.ijepes.2021.107744
- [9] X. Lei and Z. Sui, “Intelligent fault detection of high voltage line based on the Faster R-CNN,” Measurement, Vol.138, pp. 379-385, 2019. https://doi.org/10.1016/j.measurement.2019.01.072
- [10] M. Liu, Z. Li, and G. Sheng, “Edge intelligent visual monitoring of substations based on lightweight object detection model,” IEEE Trans. on Instrumentation and Measurement, Vol.74, Article No.3533112, 2025. https://doi.org/10.1109/TIM.2025.3562970
- [11] J. Li et al., “PEDNet: A lightweight detection network of power equipment in infrared image based on YOLOv4-Tiny,” IEEE Trans. on Instrumentation and Measurement, Vol.72, Article No.5004312, 2023. https://doi.org/10.1109/TIM.2023.3235416
- [12] C. Liu, Y. Wu, J. Liu, and Z. Sun, “Improved YOLOv3 network for insulator detection in aerial images with diverse background interference,” Electronics, Vol.10, No.7, Article No.771, 2021. https://doi.org/10.3390/electronics10070771
- [13] Z. Yang, Z. Xu, and Y. Wang, “Bidirection-fusion-YOLOv3: An improved method for insulator defect detection using UAV image,” IEEE Trans. on Instrumentation and Measurement, Vol.71, Article No.3521408, 2022. https://doi.org/10.1109/TIM.2022.3201499
- [14] W. Cao et al., “Step-by-step: Efficient ship detection in large-scale remote sensing images,” IEEE Journal of Selected Topics in Applied Earth Observations and Remote Sensing, Vol.17, pp. 13426-13438, 2024. https://doi.org/10.1109/JSTARS.2024.3429395
- [15] O. Ulucan, D. Karakaya, and M. Turkan, “Saturated region recovery in tone-mapped HDR images,” 2021 IEEE Int. Conf. on Image Processing, pp. 1774-1778, 2021. https://doi.org/10.1109/ICIP42928.2021.9506727
- [16] K. Wei, Y. Fu, Y. Zheng, and J. Yang, “Physics-based noise modeling for extreme low-light photography,” IEEE Trans. on Pattern Analysis and Machine Intelligence, Vol.44, No.11, pp. 8520-8537, 2022. https://doi.org/10.1109/TPAMI.2021.3103114
- [17] K. Li et al., “UniFormer: Unifying convolution and self-attention for visual recognition,” IEEE Trans. on Pattern Analysis and Machine Intelligence, Vol.45, No.10, pp. 12581-12600, 2023. https://doi.org/10.1109/TPAMI.2023.3282631
- [18] A. Dosovitskiy et al., “An image is worth 16x16 words: Transformers for image recognition at scale,” arXiv:2010.11929, 2020.
- [19] C.-Y. Wang, A. Bochkovskiy, and H.-Y. M. Liao, “YOLOv7: Trainable bag-of-freebies sets new state-of-the-art for real-time object detectors,” 2023 IEEE/CVF Conf. on Computer Vision and Pattern Recognition, pp. 7464-7475, 2023. https://doi.org/10.1109/CVPR52729.2023.00721
- [20] N. Mukai et al., “Application of object grasping using dual-arm autonomous mobile robot—Path planning by spline curve and object recognition by YOLO—,” J. Robot. Mechatron., Vol.35, No.6, pp. 1524-1531, 2023. https://doi.org/10.20965/jrm.2023.p1524
- [21] R. Gai, N. Chen, and H. Yuan, “A detection algorithm for cherry fruits based on the improved YOLO-v4 model,” Neural Computing and Applications, Vol.35, No.19, pp. 13895-13906, 2023. https://doi.org/10.1007/s00521-021-06029-z
- [22] L. Yang, R.-Y. Zhang, L. Li, and X. Xie, “SimAM: A simple, parameter-free attention module for convolutional neural networks,” Proc. of the 38th Int. Conf. on Machine Learning, pp. 11863-11874, 2021.
- [23] Y. Qi, Y. He, X. Qi, Y. Zhang, and G. Yang, “Dynamic snake convolution based on topological geometric constraints for tubular structure segmentation,” 2023 IEEE/CVF Int. Conf. on Computer Vision, pp. 6047-6056, 2023. https://doi.org/10.1109/ICCV51070.2023.00558
- [24] K. Han et al., “GhostNet: More features from cheap operations,” 2020 IEEE/CVF Conf. on Computer Vision and Pattern Recognition, pp. 1577-1586, 2020. https://doi.org/10.1109/CVPR42600.2020.00165
- [25] D. Costarelli, M. Seracini, and G. Vinti, “A comparison between the sampling Kantorovich algorithm for digital image processing with some interpolation and quasi-interpolation methods,” Applied Mathematics and Computation, Vol.374, Article No.125046, 2020. https://doi.org/10.1016/j.amc.2020.125046
This article is published under a Creative Commons Attribution-NoDerivatives 4.0 Internationa License.