Research Paper:
Influence of Supporters’ Purposeful Movement on Effectiveness of Propaganda
Jiateng Pan*,†
 , Atsushi Yoshikawa*,**
, and Masayuki Yamamura*
, Atsushi Yoshikawa*,**
, and Masayuki Yamamura*
*School of Computing, Institute of Science Tokyo
4259 Nagatsuta-cho, Midori-ku, Yokohama, Kanagawa 226-8501, Japan
†Corresponding author
**College of Science and Engineering, Kanto Gakuin University
1-50-1 Mutsuura-higashi, Kanazawa-ku, Yokohama 236-8501, Japan

Conventional wisdom holds that growing a supporter base strengthens propaganda via the bandwagon effect; yet, real-world outcomes often show the opposite. We investigate why larger bases can coincide with lower conversion rates among undecided individuals. Using an agent-based simulation that incorporates a Schelling-style movement rule, we run nine scenarios across three competitive regimes (balanced, competitor-strong, propagandist-strong) with supporter shares ranging from 10%–33%. We find: (1) purposeful movement (preference-driven relocation) induces spatial clustering that reduces cross-type exposure, leading clustered supporters to consistently underperform dispersed supporters; (2) when supporters on both sides exhibit purposeful movement, a numerically inferior side could gain an advantage under certain conditions (e.g., when the opponent clusters more); and (3) excessive increases in supporter numbers—which promote strong spatial clustering—can erode a dominant propagandist’s edge. The mechanism is straightforward: clustering satisfies in-group preferences but isolates supporters from the undecided, muting the bandwagon effect. These results qualify the presumed linear link between supporter volume and campaign success and offer practical guidance: prioritize maintaining supporter dispersion over simply maximizing numbers (e.g., broad geographic reach rather than concentrated rallies). Our framework is reproducible and points to extensions involving heterogeneous agents, nonlinear persuasion, and diverse network topologies.
Purposeful movement reduces support rate
1. Introduction
1.1. Background
In this era of advanced information networks, anyone can become an influencer and participate in propaganda campaigns 1. This new landscape confronts a fundamental paradox in campaign outcomes. The established theory holds that increasing the number of supporters boosts propaganda effectiveness via the bandwagon effect 2,3, yet real-world observations frequently contradict this prediction, revealing a critical gap in our understanding of influence mechanisms.
The bandwagon effect refers to an individual’s tendency to align with perceived majority preferences 2 and has long been regarded as a key element of effective propaganda strategies 4. This psychological phenomenon suggests that visible support attracts further support, creating a positive feedback loop that amplifies a campaign’s influence 3. Agent-based simulations have consistently validated this framework, demonstrating that strategic growth in supporter numbers can effectively leverage social proof to convert non-supporters. For example, Chang et al. 5 use an agent-based diffusion model to show that a larger pre-merger market share leads to a higher probability of outcompeting rivals after a merger.
The linear relationship between supporter volume and campaign success has dominated strategic thinking in political campaigns, marketing initiatives, and social movements.
However, empirical evidence has increasingly challenged this assumption. A striking example is the 2020 U.S. presidential election, where periods in which Trump held superior or equal support did not translate into corresponding advantages in converting independents (Fig. 1) 6. As Broockman and Kalla 7 report, Trump’s propaganda effect was “substantially smaller” than Biden’s.
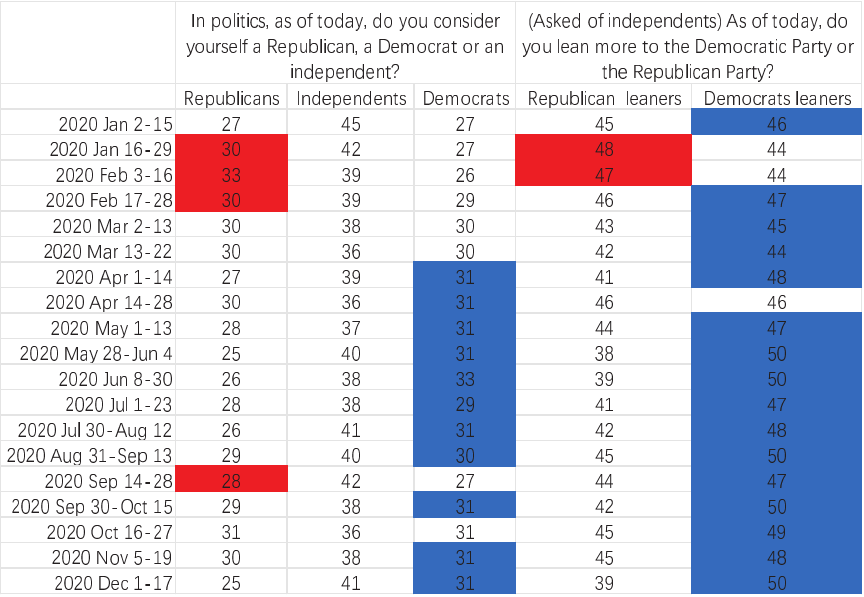
Fig. 1. Results of the 2020 U.S. Bipartisan Polls. Red represents republican dominance; blue represents democrat dominance. (Data source: Gallup 2024 6).
This pattern extends beyond political issues. Highly concentrated fan communities, despite their numerical strength and enthusiasm, often struggle to expand their influence beyond existing boundaries. Corporate campaigns with large active followings can underperform compared to competitors with smaller but more dispersed support networks. These observations suggest fundamental mechanisms that traditional theories do not capture.
1.2. Related Research
We propose that the critical missing element is supporter clustering, driven by purposeful movement. As propaganda succeeds and supporter numbers grow, these individuals naturally gravitate toward like-minded communities 8,9. While this clustering satisfies supporters’ in-group preferences, it systematically undermines the propaganda effect it is meant to reinforce.
The clustering hypothesis offers a persuasive explanation for this paradox. When supporters cluster, they isolate themselves from the non-supporters they are meant to influence, effectively reducing the impact of the bandwagon effect. This creates a negative feedback loop in which propaganda success (supporter growth) induces clustering, diminishing the effectiveness of future propaganda.
Despite extensive research on social influence 10,11, collective behavior 12,13, and informational cascades 14,15, the specific impact of supporter clustering on propaganda efficacy remains largely unexplored. Prior studies focused primarily on clustering from a public health perspective 16,17,18 or treated spatial distribution as a secondary consideration. To date, no research has systematically examined how the spatial dynamics of supporter movements influence campaign outcomes.
Therefore, existing models cannot account for the observed cases in which a larger supporter base coincides with a reduced conversion rate among ordinary, undecided individuals. This gap is particularly significant in modern societies, where community affiliation is fluid and supporters can actively seek congenial groups, accelerating clustering effects.
1.3. Research Objectives and Paper Structure
To address this theoretical gap, we integrate Schelling’s segregation model 19,20 into our propaganda-effectiveness analysis, creating a unified framework that accounts for both supporter count and spatial distribution. In our enhanced model, agents (supporters) assess their local community satisfaction and make purposeful movement decisions to find neighborhoods in which they feel most comfortable among like-minded peers.
This approach allows us to systematically investigate how purposeful movement and the resultant clustering behavior affect the fundamental mechanisms of the bandwagon effect. By modeling realistic movement patterns, we isolate the direct impact of clustering on propaganda outcomes while controlling for other variables.
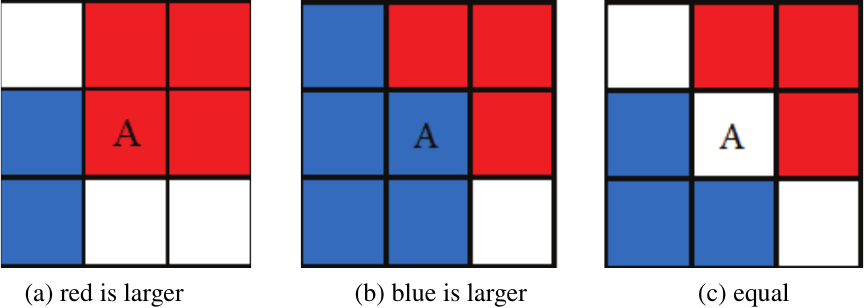
Fig. 2. Examples of non-supporters in action. For A in the middle position, (a) the eight surrounding agents tend to choose the red party, (b) the eight surrounding agents tend to choose the blue party, and (c) the eight surrounding agents have no preference.
This study introduces the concept of purposeful movement and makes three primary contributions:
-
We challengethe assumption of a linear relationship between supporter count and campaign success by quantifying the tradeoff between clustering and influence.
-
Through systematic simulation experiments, we demonstrate the conditions under which clustering undermines propaganda and creates strategic opportunities for competitors.
-
We provide practical insights into campaign strategies, suggesting that preserving supporter dispersion may hold more value than simply maximizing the number of supporters.
These findings carry profound implications for political campaigns, marketing strategies, social movements, and any domain where public opinion and influence are critical. Understanding the clustering paradox is essential for designing effective communication strategies in an increasingly connected, yet potentially fragmented, world.
The remainder of this paper is organized as follows: Section 2 reviews the preliminary research and baseline agent-based simulation. Section 3 presents our enhanced model, including agents’ satisfaction and purposeful-movement rules, and outlines the experimental design. Section 4 reports the results of nine experimental cases under three competitive regimes. Section 5 analyzes the mechanisms behind these findings and derives key implications. Section 6 provides broader explanations, managerial recommendations, and limitations of the study. Section 7 concisely summarizes the main findings and their implications.
2. Preliminary Research
To analyze the influence of the number of supporters on propaganda effectiveness, we conducted a preliminary study using agent-based simulations.
This study aims to explore how increasing the number of supporters can leverage the bandwagon effect to attract additional support from non-supporters.
The model created a social environment in which all agents could mutually influence each other, with each agent having equal influence (i.e., no agent had greater or lesser influence than any other). By setting the influence to eight (meaning that each agent can interact with eight other agents), this social model can be represented as a matrix. For each agent, a \(3\times 3\) submatrix centered around the agent represented its community, and the eight surrounding agents were those that could influence and be influenced by it. This design not only avoids the impact of any highly influential agent on the simulation results but also aids visualization. This allowed us to observe the simulation results more intuitively. The model was defined as follows.
2.1. Agent
As described by Chang et al. 5, most agents change their choices according to the choices of surrounding agents.
Figure 2(a) shows that of the eight agents surrounding A in the center, three chose red, two chose blue, and the remaining agents abstained and were counted as 0.5 for each side. Owing to the bandwagon effect, A chooses red, which represents the largest proportion. For A in Fig. 2(b), the proportion of blue is larger, so A chooses blue. For A in Fig. 2(c), the proportions of blue and red are equal, so A abstains. In this study, such agents are referred to as “non-supporters.”
By contrast, there is another type of agent whose choices do not change based on the choices of the surrounding agents. These agents consistently choose either red or blue from beginning to end. Such agents are referred to as “supporters.” Those who choose red are referred to as supporters of propagandists, whereas those who choose blue are referred to as supporters of competitors.
Table 1. Parameters used in the preliminary research.

2.2. Simulation
We used different proportions of propagandist supporters in the simulation to examine changes in the number of supporters caused by propaganda. Propagandists and competitors are depicted in red and blue, respectively. The proportion of Blue Party supporters was set at 33%, with the remainder comprising non-supporters. The maximum proportion of Red Party supporters was also set at 33% to ensure that non-supporters always constituted the majority. This design made the experiment more reflective of the real world, as shown in the public opinion polls in Fig. 1. Non-supporters are always the largest group, and the main goal of propaganda (whether political or otherwise) is to gain support from these undecided individuals.
After the random placement of 1024 agents in a \(32\times 32\) circular border social network, supporters first chose either blue or red. Subsequently, the non-supporters changed their choices according to those around them. This process occurred several times (at most a 100 times), or until a stable state was reached (no members changed after more than two consecutive votes). The proportion of choices made by non-supporters at this time was recorded, and the effectiveness of the propaganda was considered. Finally, the relationship between the proportion of Red Party supporters (10%–33%) and the proportion of non-supporters’ final choices was calculated.
This simulation was performed 100 times, and for each run, we recorded the relationship between the proportion of Red Party supporters (10%–33%) and the proportion of non-supporters’ final choices. The average values and 95% confidence intervals (CIs) were calculated and plotted using a line graph.
To eliminate the influence of random factors, 100 simulations were performed for each case, using different random seeds. The parameters used in the experiments are listed in Table 1. All simulations were implemented in Python 3.8 and executed on a Windows 11 Home 64-bit workstation (Intel Core i9-14900F 2.00 GHz, 64 GB RAM).
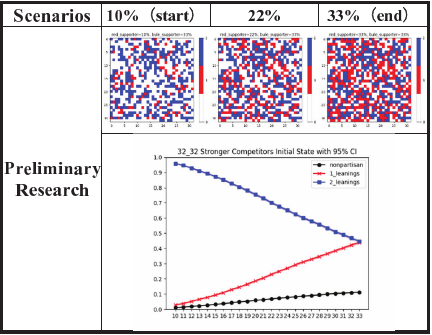
Fig. 3. Impact of Red Party supporter proportion on non-supporters’ final choices in social networks. Note: The average confidence intervals (CI) are as follows: abstain from making a choice (black) 0.0022, support the red party 0.0059, support the blue party 0.0066.
2.3. Result
Figure 3 illustrates the relationship between the proportion of Red Party supporters (ranging from 10% to 33%) and the final choices of non-supporters in a social network. The top row contains three heatmaps representing the distribution of red (Red Party supporters) and blue (Blue Party supporters) nodes in a social network with different initial proportions of red supporters: 10% (start), 22%, and 33% (end). Each heatmap is a snapshot of one of the 100 simulations conducted for each scenario, showing the state of the network before non-supporters make their choices (non-supporters are represented in white).
The bottom graph is a line chart showing the proportion of non-supporters’ final choices as the proportion of Red Party supporters increases. The \(x\)-axis represents the proportion of Red Party supporters, while the \(y\)-axis represents the proportion of non-supporters’ final choices. The blue line indicates the proportion of non-supporters who ultimately support the Blue Party, the red line indicates those who support the Red Party, and the black line indicates those who abstain from making a choice. The chart includes 95% CIs for each line.
2.4. Analysis
The results depicted in Fig. 3 illustrate the dynamics of supporter influence under various initial conditions. The line graph in the figure shows the proportion of non-supporters who lean toward either blue (competitor) or red (propagandist) supporters with a 95% confidence interval.
Initially, the proportion of blue supporters was fixed at 33%, while that of red supporters was increased to 10%. Owing to this initial disparity, the blue group gained a larger proportion of choices (support) from non-supporters. As the number of red supporters increased, the proportion of non-supporters leaning toward blue decreased, while those leaning toward red increased. This trend continued until the leanings toward both supporters converged, indicating a state of equilibrium.
This analysis reveals that when other conditions, such as the influence and distribution methods of both supporters, remain constant, the side with the initially higher proportion of supporters (blue) holds a significant advantage. This advantage allows blue to attract more non-supporters. However, as the number of red supporters increases, the leanings of non-supporters gradually shift toward red, eventually reaching a balanced state.
This conclusion aligns with the findings of Chang et al. 5, who also suggest that an increase in the number of supporters on one side can shift the balance of non-supporters’ leanings toward that side.
2.5. Preliminary Research Findings
The results of the analysis are consistent with the findings discussed in the research background. In simulations where competitors exist and propaganda efforts are used to increase the number of supporters, thereby leveraging the bandwagon effect to gain support from non-supporters, the side with more supporters consistently holds an advantage. This manifests as a greater proportion of non-supporters choosing to align with the side that has more supporters. Additionally, an increase in the number of supporters is directly correlated with a higher proportion of non-supporters’ support.
The simulation demonstrates that strategic efforts to increase the number of supporters can effectively shift public opinion and enhance the overall influence of propagandists.
3. Model Enhancement and Simulation
To analyze the influence of supporters’ purposeful movements on propaganda effectiveness, we extended our initial research by incorporating agents’ location dynamics into the simulation model. Unlike our preliminary study, in which the agents’ positions were randomly assigned without considering their movements, this enhanced model accounts for agents’ location choices.
In reality, people do not stay in communities they dislike. For instance, individuals are more likely to remain in communities where the majority share their views and leave those with opposing viewpoints. We used the Schelling model to simulate this logic. In this model, the agents evaluate their current community by assessing the types of agents around them and calculate their satisfaction with the community. If an agent determines that they would be better off in a completely different community, they decide to move.
For the agents deciding to move, we employed a random relocation method to simulate a real-world scenario in which individuals first leave undesirable communities and then seek more suitable ones. By allowing the agents to move purposefully based on their preferences and community satisfaction, we aimed to simulate real-world social dynamics more accurately.
The model was defined as follows.
3.1. Agent
In this enhanced model, we retain the three types of agents defined in the preliminary research described in Section 2.1.
-
Non-supporters: These agents change their choices according to the choices of surrounding agents.
-
Propagandists’ supporters: Agents that always choose red.
-
Competitors’ supporters: Agents that always choose blue.
3.2. Purposeful Movement
To better simulate real-world social dynamics, we introduced purposeful movement for the agents. Unlike the random placement and movement in the preliminary study, the agents in this enhanced model first decide whether to leave their current communities. If they choose to leave, they randomly swap positions with other agents who also decide to leave. This process is repeated until they find a community with which they are satisfied. This purposeful movement is driven by agents’ dissatisfaction with their current community and their desire to find a more favorable environment. By incorporating this behavior, we aimed to provide a more accurate representation of how supporters’ purposeful movements influence the effectiveness of propaganda.
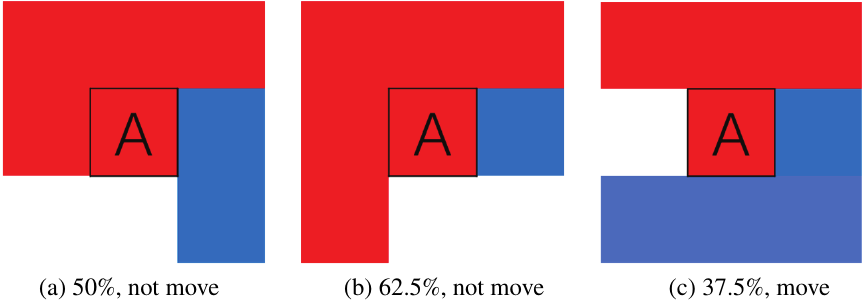
Fig. 4. Example of purposeful movement (\(\textit{thd}=0.5\)).
3.2.1. Satisfaction
We employed the Schelling model to facilitate clustering. This model was selected because of its ease of implementation 21 and its suitability for simulating real human clustering through purposeful movement. Clustering, represented by the Schelling model, is analogous to physics 12.
According to Schelling’s segregation model, each agent evaluates its current environment. Satisfaction depends on the proportion \(p\) of agents of the same type in the community. The relationship between satisfaction \(s\) and \(p\) is given by Eq. \(\eqref{eq:1}\).
The parameter \(\textit{thd}\) (\(0<\textit{thd}<1\)) represents the agent’s most preferred proportion \(p\), meaning that the agent’s satisfaction is highest when the proportion of agents of the same type in the community is \(\textit{thd}\).
Generally, a higher value of \(\textit{thd}\) implies that an agent has a stronger preference for communities with a greater proportion of similar agents, whereas a lower value indicates a less pronounced tendency. In our study, we set \(\textit{thd}\) at 0.5 to represent a neutral community without inherent bias toward segregation. However, it is important to note that within Schelling’s model—even with higher \(\textit{thd}\) values—the dynamics of agent interactions will eventually lead to clustering of similar agents over time.
3.2.2. Movement Decision Based on Satisfaction
Agents will calculate \(s(p)\) and \(s(1-p)\). If the current \(s(p)\) is less than \(s(1-p)\), then the agent decides to leave the current community in search of a better one.
Typically, the value of \(\textit{thd}\) can simulate communities with different levels of tolerance among agents, but this study does not aim to explore this aspect; therefore, \(\textit{thd}\) was set to 0.5.
As shown in Fig. 4, this can be understood simply as an agent choosing to leave the current community when \(p\) is less than 50%.
3.2.3. Random Movement Decision
Agents may decide to leave their current community to seek new communities for reasons other than dissatisfaction with their current environment. For example, members of various online interest groups may frequently leave and join new communities, paying little attention to the proportion of similar individuals around them. They are not restricted to a particular community.
This condition is fulfilled by agents who either remain stationary at all times or decide to move at any given moment. To ensure that the model reached a stable state more efficiently, such individuals were set to always decide to move.
If an agent continuously decides to leave its current community, it will continue to swap positions with other agents who have decided to leave. Due to the nature of this movement being more aimless, we refer to it as “Random Movement” to distinguish it from “Purposeful Movement.”
In this model, non-supporters exhibit this behavior. They are characterized as agents who do not care about the nature of their current community and are willing to explore multiple communities.
3.3. Simulation
We used different proportions of propagandist supporters in the simulation to model the increase or decrease in the number of supporters caused by propaganda. Propagandists and competitors are depicted in red and blue, respectively. The proportion of Blue Party supporters was set to match that of the Red Party supporters, at 33% and 10%, to simulate scenarios where the competitors were equally strong, stronger, or weaker than the propagandists. The remaining proportion comprised non-supporters.
In contrast to Section 2.2, after the random placement of 1024 agents in a \(32\times 32\) circular border social network, the agents made a movement decision (Table 2). Subsequently, the positions of all agents who decided to move were randomly exchanged, and all agents made a movement decision again.
This process was repeated multiple times until 97% of the agents designated for the purposeful movement decision chose not to move, or until the loop reached 300 iterations. This design not only reduces the computational burden of the simulation but also allows for some agents to continue searching for a suitable community, making the simulation setting more realistic.
Subsequently, as in the simulation described in Section 2.2, all the agents made their initial choices. Non-supporters adjusted their choices based on the decisions made by those around them. This process was repeated multiple times (up to 100 iterations) or until a stable state was reached (no changes in choices occurred for more than two consecutive rounds).
The simulations were performed 100 times. For each run, we recorded the relationship between the proportion of Red Party supporters (10%–33%) and the proportion of non-supporters’ final choices. The average values and 95% CIs were calculated and plotted using a line graph.
Table 2. Nine simulation scenarios.

Table 3. Parameters used in the experiments.

To observe the impact of the purposeful movements of supporters on propaganda effectiveness under various conditions, we set up the following three scenarios:
-
When competitors and propagandists were evenly matched, the proportion of supporters remained the same for red and blue.
-
When competitors were stronger than the propagandists, the proportion of competitor supporters was fixed at 33%.
-
When competitors were weaker than the propagandists, the proportion of competitor supporters was fixed at 10%.
Different results were observed in three scenarios: (a) no movement decision, (b) all supporters made purposeful movement decisions, and (c) only competitors’ supporters made purposeful movement decisions (a total of nine scenarios; Table 2).
The parameters used in the experiments are listed in Table 3. All simulations were implemented in Python 3.8 and executed on a Windows 11 Home 64-bit workstation (Intel Core i9-14900F 2.00 GHz, 64 GB RAM).
3.4. Research Questions and Experimental Design
The experiment was divided into three parts, each specifically designed to address the following research questions:
Q1: Does purposeful movement of supporters impact the effectiveness of propaganda in a balanced community setting?
In the first part (Cases 1–3), the number of supporters of both propagandists (red) and competitors (blue) was kept constant. This experimental setup was designed to address the research question: Does purposeful movement of supporters impact the effectiveness of propaganda in a balanced community setting, and how does this effect differ when only one side’s supporters move purposefully compared to both sides engaging in such movement or to a scenario where positions are randomized. Given that all agents in the experiment mutually influence each other and that each community always comprises the same number of agents (each agent is surrounded by eight neighbors and itself), if purposeful movement has no effect on propagation, then the outcomes of Case 2 (both sides move purposefully) and Case 3 (only one side moves purposefully) should resemble those observed in Case 1, where supporter positions are randomly assigned. Conversely, if differences emerge, particularly if Case 3 shows significant deviations from the other two scenarios, this would indicate that the purposeful movement of supporters affects the results of propaganda, revealing whether this strategy confers an advantage or disadvantage to the side whose supporters are deliberately positioned.
Next, if the purposeful movement of supporters had a negative impact on propaganda, two additional parts were designed to explore the conditions under which this impact occurred.
Q2: Under what conditions can propagandists (red) secure a strategic advantage given their lower supporter count?
In the second part (Cases 4–6), the number of supporters of the competitors (blue) was fixed at 33%. As mentioned in Section 2.2, 33% is the maximum proportion that supporters can reach to ensure that non-supporters always constitute the majority. This design ensures that competitors (blue) are not at a disadvantage in terms of supporter proportion. For Case 4, this setup is equivalent to the experiment in the preliminary research; thus, the conclusion is that competitors (blue) with a higher proportion of supporters will gain more choices from non-supporters. However, if supporters on both sides engage in purposeful movement (Case 5), will this conclusion change? What will the result be if only competitors’ (blue) supporters engage in purposeful movement (Case 6)? This section explores the conditions under which propagandists (red) gain an advantage despite being at a numerical disadvantage.
Q3: Under what conditions can dominant propagandists (red) maintain their advantage given their superior proportion of supporters?
In the third part (Cases 7–9), the number of supporters of the competitors (blue) was fixed at 10%. Since the proportion of propagandist (red) supporters ranges from 10% to 33%, competitors (blue) are never in the majority. For Case 7, based on the conclusion of the preliminary research, the dominant propagandists (red) gained more choices from non-supporters. If supporters on both sides engage in purposeful movement (Case 8), can the advantage of the propagandists (red) be maintained? Will this advantage expand if only the competitors’ (blue) supporters engage in purposeful movements? This section explores how the dominant propagandists (red) maintain their advantage.
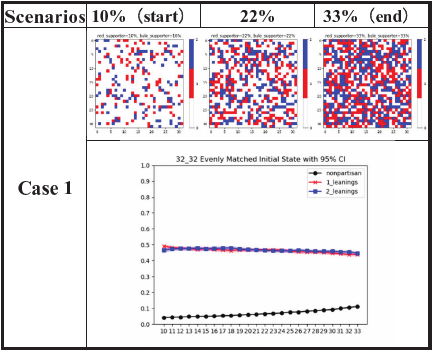
Fig. 5. Case 1 results. Competitors and propagandists are evenly matched, supporters without movement. Note: The average confidence intervals (CI) are as follows: abstain from making a choice (black) 0.0021, support the red party 0.0088, support the blue party 0.0089.
4. Experimental Results
4.1. When Competitors and Propagandists are Evenly Matched (Cases 1–3)
4.1.1. Case 1: Without Movement
Figure 5 illustrates the simulation results under conditions in which the number of propagandist supporters (red) and competitor supporters (blue) are equal and randomly distributed.
It can be seen that the effectiveness of their propaganda (measured by the proportion of non-supporters choosing each side) remained similar, as depicted in the line graph.
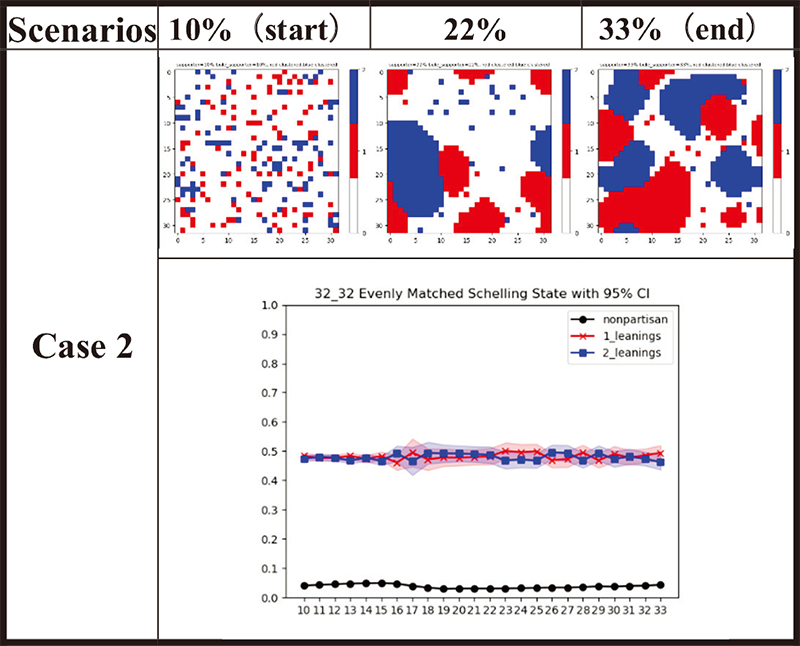
4.1.2. Case 2: Both with Purposeful Movement
Figure 6 illustrates the simulation results under conditions where the number of propagandist supporters (red) and competitor supporters (blue) are equal and both make purposeful movement decisions.
It can be seen that the effectiveness of their propaganda remains similar, as depicted in the line graph. However, as the proportion increases, supporters who make purposeful movement decisions begin to cluster, and the CIs become larger than in Case 1.
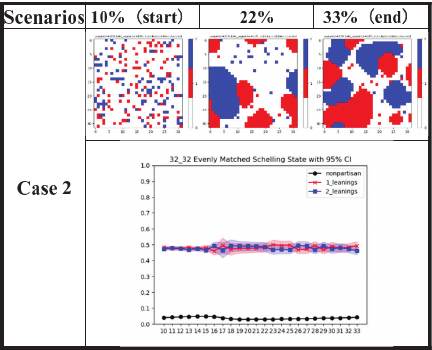
Fig. 6. Case 2 results. Competitors and propagandists are evenly matched, supporters with purposeful movement. Note: The average confidence intervals (CI) are as follows: abstain from making a choice (black) 0.0017, support the red party 0.0241, support the blue party 0.0241.
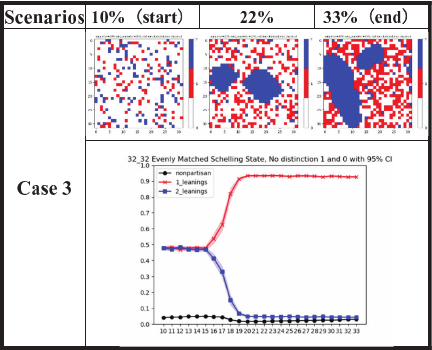
Fig. 7. Case 3 results. Competitors and propagandists are evenly matched, competitors’ supporters with purposeful movement, propagandists’ supporters with random movement. Note: The average confidence intervals (CI) are as follows: abstain from making a choice (black) 0.0016, support the red party 0.0096, support the blue party 0.0087.
4.1.3. Case 3: Competitors’ Supporters of Purposeful and Random Movements
Figure 7 illustrates the simulation results under conditions in which the numbers of propagandist supporters (red) and competitor supporters (blue) are equal. Propagandist supporters make random movement decisions, whereas competitor supporters make purposeful decisions.
From the three heatmaps of the social network at the top of Fig. 7, showing different proportions of propagandist supporters (red), it can be observed that when both groups have a small proportion (10%–15%), the social network resembles Cases 1 and 2, with no significant differences in the results presented in the line chart. However, as the proportion increases, competitors who make purposeful movement decisions begin to cluster, and simultaneously, the proportion of non-supporters choosing the propagandist side (red) gradually increases.
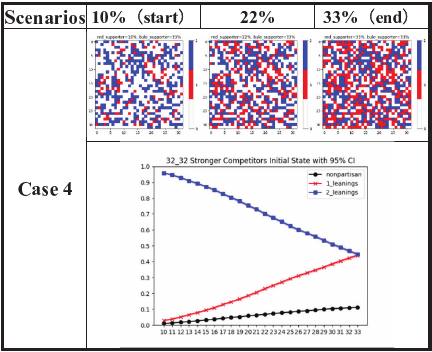
Fig. 8. Case 4 results. Competitors are stronger than propagandists, supporters without movement. Note: The average confidence intervals (CI) are as follows: abstain from making a choice (black) 0.0022, support the red party 0.0059, support the blue party 0.0066.
4.2. When Competitors are Stronger than Propagandists (Cases 4–6)
4.2.1. Case 4: Without Movement
Figure 8 illustrates the simulation results under conditions where the number of competitor supporters (blue) is fixed at 33% and all supporters are randomly distributed.
This result is consistent with the findings of the preliminary research, indicating that, under the same conditions, the competitor with the largest number of supporters (blue) consistently attracts more choices from non-supporters. As the number of propagandist supporters increased, the proportion of non-supporters’ choices gradually approached equality.
4.2.2. Case 5: Both with Purposeful Movement
Figure 9 illustrates the simulation results under conditions in which the number of competitor supporters (blue) is fixed at 33% and all supporters make a purposeful movement decision.
From the three heatmaps of the social network at the top of Fig. 9, it can be observed that although supporters from both sides executed purposeful movement decisions, propagandist supporters (red) did not cluster together as much as competitor supporters (blue) when propagandist supporters were in the minority. As a result, as shown in the line chart, even though the number of propagandist supporters was much lower than that of competitors, they still managed to attract more choices from non-supporters, reaching 87.54%.
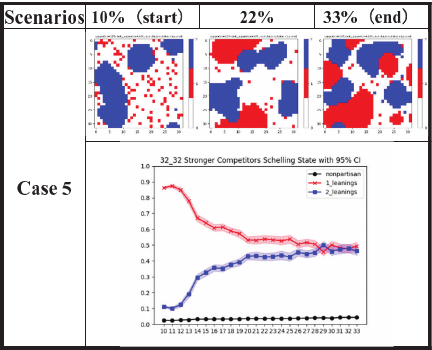
Fig. 9. Case 5 results. Competitors are stronger than propagandists, supporters with purposeful movement. Note: The average confidence intervals (CI) are as follows: abstain from making a choice (black) 0.0017, support the red party 0.0224, support the blue party 0.0221.
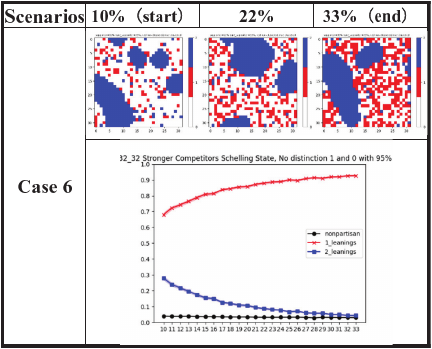
Fig. 10. Case 6 results. Competitors are stronger than propagandists, competitors’ supporters with purposeful movement, propagandists’ supporters with random movement. Note: The average confidence intervals (CI) are as follows: abstain from making a choice (black) 0.0017, support the red party 0.0067, support the blue party 0.0060.
4.2.3. Case 6: Competitors’ Supporters of Purposeful and Random Movements
Figure 10 illustrates the simulation results when the number of competitor supporters (blue) is fixed at 33%. Propagandist supporters make random movement decisions, whereas competitor supporters make purposeful decisions.
From the three heatmaps of the social network at the top of Fig. 10, it can be observed that because only competitor supporters executed purposeful movement decisions, they consistently clustered together. In contrast, propagandist supporters were randomly dispersed in the remaining positions. As shown in the line chart, the propagandist side always maintains an advantage, attracting more choices from non-supporters, and this proportion increases as the number of propagandist supporters rises.
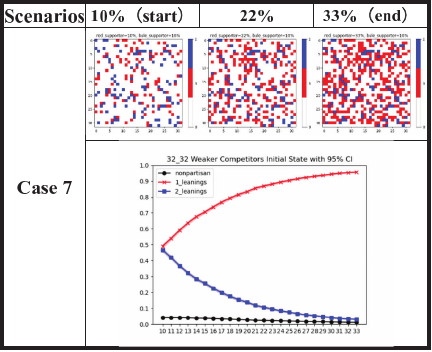
Fig. 11. Case 7 results. Competitors are weaker than propagandists, supporters without movement. Note: The average confidence intervals (CI) are as follows: abstain from making a choice (black) 0.0013, support the red party 0.0076, support the blue party 0.0069.
4.3. When Competitors are Weaker than Propagandists (Cases 7–9)
4.3.1. Case 7: Without Movement
Figure 11 illustrates the simulation results under conditions in which the number of competitor supporters (blue) is fixed at 10% and all supporters are randomly distributed.
It can be observed from Fig. 11 that, contrary to Case 4, under the same conditions, the propagandist side (red), which has more supporters, attracts more choices from non-supporters. The proportion starts at an even split when both sides have 10% supporters and gradually increases as the number of propagandist supporters rises.
4.3.2. Case 8: Both with Purposeful Movement
Figure 12 illustrates the simulation results under conditions in which the number of competitor supporters (blue) is fixed at 10% and all supporters make a purposeful movement decision.
From the three heatmaps of the social network at the top of Fig. 12, it can be observed that although supporters from both sides executed purposeful movement decisions, competitor supporters, comprising only 10% of the total, never formed clusters at any point. In contrast, as the number of propagandist supporters increased, they began to cluster. As a result, as shown in the line chart, initially (during the 10%–17% period), the propagandist side had the advantage of attracting more choices from non-supporters. However, this proportion suddenly decreased as the number of propagandist supporters increased.
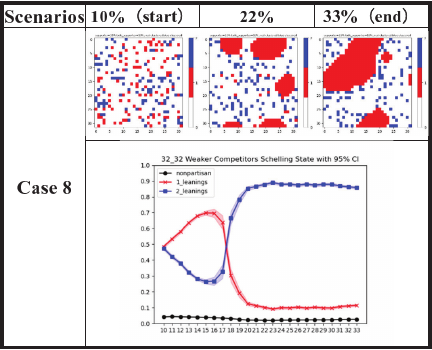
Fig. 12. Case 8 results. Competitors are weaker than propagandists, supporters with purposeful movement. Note: The average confidence intervals (CI) are as follows: abstain from making a choice (black) 0.0013, support the red party 0.0132, support the blue party 0.0136.
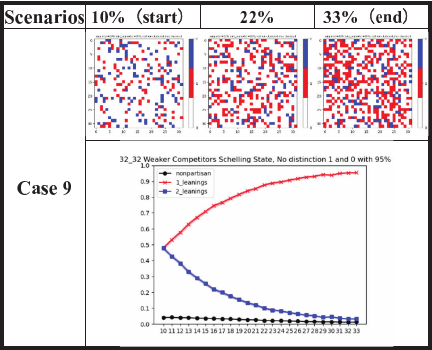
Fig. 13. Case 9 results. Competitors are weaker than propagandists, competitors’ supporters with purposeful movement, propagandists’ supporters with random movement. Note: The average confidence intervals (CI) are as follows: abstain from making a choice (black) 0.0013, support the red party 0.0074, support the blue party 0.0067.
4.3.3. Case 9: Competitors’ Supporters of the Purposeful and Random Movements
Figure 13 illustrates the simulation results when the number of competitor supporters (blue) is fixed at 10%. Propagandist supporters make random movement decisions, whereas competitor supporters make purposeful decisions.
From the three heatmaps of the social network at the top of Fig. 13, it can be observed that although competitor supporters executed purposeful movement decisions, their small proportion prevented them from clustering. Meanwhile, propagandist supporters executing random movement decisions resulted in a social network heatmap very similar to that of Case 7. Consequently, the trend presented in the line chart is also similar to Case 7, with the choices of non-supporters increasing as the number of propagandist supporters increases.
5. Analysis and Conclusions
Observing Cases 1 and 2, it can be seen that when all conditions (such as the number and distribution of supporters) are the same, the propaganda effectiveness (i.e., the proportion of choices obtained from non-supporters) of both the propagandist and competitor is the same for both sides.
5.1. Negative Impact of Supporters’ Purposeful Movements on Propaganda Effectiveness
In addressing Q1, does the purposeful supporter movement affect the effectiveness of propaganda in a balanced community setting? Our results from Cases 3, 4, 6, 7, and 9 indicate that as the proportion of propagandist supporters increases, the number of choices of non-supporters also increases. This implies that increasing the number of supporters has a positive effect on propaganda effectiveness, which is consistent with previous research and the findings of Chang et al. 5.
Notably, Cases 3 and 6 were particularly significant. In these instances, although the number of competitor supporters (blue) is equal to or even exceeds that of propagandist supporters (red), the propagandist side still secures more choices from non-supporters, a result that contradicts earlier conclusions. A closer examination showed that in Cases 3 and 6, only competitor supporters made purposeful movement decisions. This behavior led to clustering, which in turn limited their influence on a broader range of non-supporters. Indeed, during the early phase of Case 3 (10%–15%), when the number of competitor supporters was low and clustering had not yet emerged (as illustrated in the heatmap of Case 3 at 10%), this phenomenon was not observed.
Thus, our findings clearly demonstrate that the purposeful movement of supporters can induce clustering, which negatively affects the overall effectiveness of propaganda. This directly addresses Q1, confirming that purposeful movements of supporters, especially when they lead to clustering, have a negative impact on the effectiveness of propaganda.
5.2. Overcoming Numerical Disadvantages Through Sparse, Non-Clustered Supporters
In addressing Q2, under what conditions can propagandists (red) secure a strategic advantage, given their lower supporter counts? Our examination of Cases 5 and 6 provides valuable insights. In both cases, despite having fewer supporters, the propaganda side consistently attracted more choices from non-supporters. Notably, in Case 6, this advantage is observed across a broader range of supporter proportions, whereas in Case 5, a similar pattern emerges specifically when the supporter proportion is low (in the 10%–15% range), when the propagandist side has significantly more choices than the competitor side.
The heatmaps for Case 5 revealed that when the number of supporters was low, they did not cluster even though they executed purposeful movement decisions. This observation reinforces our earlier conclusion in Section 5.1 that clustering induced by purposeful movements negatively impacts propaganda effectiveness. Moreover, this suggests that if the competitor supporters are already clustered, the propaganda side requires only a small number of non-clustered supporters to secure a strategic advantage. This finding directly addresses Q2 by demonstrating that propagandists can overcome their numerical disadvantages by relying on a small number of non-clustered supporters.
5.3. Sustaining Dominance: Avoiding Over-Clustering Among Propagandist Supporters
In addressing Q3, under what conditions can dominant propagandists (red) maintain their advantage given their superior proportion of supporters? Our observations in Case 8 provide critical insights. When the competitor’s supporter proportion is fixed at a low 10% and the propagandist supporters remain similarly low (10%–17%), the results align with previous research: a higher proportion of supporters leads to more choices from non-supporters. However, as the number of propagandist supporters increased beyond this range, the proportion of non-supporters suddenly dropped to a low point.
The heatmaps indicate that although both sides execute purposeful movement decisions, only propagandist supporters (red) form clusters as their numbers grow. As noted in Section 5.1, this clustering negatively impacts propaganda effectiveness by causing non-supporters to lean toward competitors. Thus, while a numerical majority usually confers an advantage, an excessive accumulation of propagandist supporters, which triggers clustering, can undermine that advantage. This finding directly addresses Q3 by demonstrating that dominant propagandists must carefully manage supporter numbers to maintain their strategic edge.
6. Discussion
The purpose of this study was to use agent-based simulations to analyze the influence of increased purposeful movements of post-propagandist supporters on the effectiveness of propaganda. The results showed that as the number of supporters increased, their purposeful movements led to clustering, which negatively affected propaganda effectiveness for the supported side.
6.1. New Explanations for Existing Issues
This is consistent with the poll results analyzed during the 2020 U.S. election when Trump’s supporters were more clustered than Biden’s supporters. Therefore, even if Trump had more supporters, he could not gain support from non-supporters. This also explains why Trump’s propaganda effect is far weaker than Biden’s 6. The greater clustering of Trump supporters means that these supporters can influence fewer non-supporters through the bandwagon effect; however, as Biden was a “newcomer,” his supporters did not have time to cluster (as seen in Cases 3 and 8).
Several such cases have been reported. Most fan groups that cluster together do not have a particularly good reputation. This is often believed to be because people consider the behavior of a group member to be a problem for the entire group and then feel disgusted with it 22. This study provides a new explanation from the perspective of competitors of these groups: it is precisely because of the clustering of these fans that many people who have no particular positive or negative feelings about the group feel “isolated” in their disgust, which provides excellent publicity conditions for competitors of these groups.
6.2. Recommendations for Real-World Issues
The bandwagon effect is also known as the contagion effect 23. This describes how behavior can spread through a group, causing individuals to follow the collective. Supporters can be seen as “contagious sources”; once they cluster together and are isolated from the general public, their “contagiousness” is greatly reduced.
We conclude that for “blue ocean fields” with no competition, more effective use of the bandwagon effect for propaganda requires avoiding targeting the same group of people in the early stages of propaganda and allowing as many supporters as possible to appear in different fields rather than concentrating in one field. According to the definition of the blue ocean strategy 24, it is evident that the clustering of supporters creates “blue ocean fields” for competitors.
Our findings suggest that the degree of clustering among competitor supporters should be observed. In areas (fields) where supporters’ purposeful movement is not obvious, we should either not participate in the competition (when the competitors are strong) or invest more resources to win over potential supporters in as many places as possible. Conversely, in areas (fields) where the concentration of competitors’ supporters is higher, it is worth investing fewer resources to participate in the competition.
6.3. Limitations of the Study
This study has several limitations. We assumed that the quality of the competing parties was equal (i.e., the number of supporters obtained under the same publicity intensity and the utilization rate of the bandwagon effect were the same). In subsequent studies, we will discuss the results obtained when party quality and the number of supporters obtained under the same publicity intensity are unequal and when the maximum utilization rate of the bandwagon effect is not limited to 50%.
As clustering based on the Schelling model often occurs immediately after exceeding a certain threshold, we did not address questions such as the degree of clustering that would produce a particular level of effect. More controllable clustering methods may be required to address these questions.
We assume that the agents can identify the types of agents around them, which is not the case in real life. People tend to make judgments based on the behavior of those around them. Therefore, future research should consider the choices of clustering agents rather than their types to determine whether they produce different results.
7. Summary
Traditional theory holds that increasing supporter numbers boosts propaganda effectiveness through the bandwagon effect. Our study reveals a systematic mechanism that undercuts this assumption: the clustering of supporters—an inevitable consequence of their growth—erodes the impact of propaganda.
Specifically, by embedding the Schelling model into an agent-based simulation, we show that supporters’ purposeful movement toward like-minded communities produces spatial clustering, which dramatically reduces their influence on non-supporters. This finding exposes a decisive limit to the bandwagon effect: clustered supporters become isolated, shrinking opportunities for persuasion. In other words, clustering satisfies in-group preferences but diminishes collective propaganda power—a concentration–dispersion tradeoff. We also observed a strategic reversal: even a numerically inferior competitor can gain the upper hand when the opponent’s supporters are overly clustered.
Our results fundamentally overturn the presumed linear link between supporter count and campaign success. They demonstrate that a smaller yet more widely dispersed supporter base can outperform a larger but highly clustered follower base.
This insight suggests a paradigm shift in propaganda strategies of maintaining supporter dispersion may prove more valuable than simply maximizing numbers. This implies the following for practitioners:
-
In early campaign stages, prioritize broad geographic and demographic reach over concentrated rallies.
-
Monitor competitors’ clustering patterns to identify strategic openings.
-
Deploy counter clustering tactics (e.g., cross-community outreach) to sustain propaganda momentum.
In sum, propaganda effectiveness hinges not only on how many supporters you have but also on how they are distributed spatially and socially.
Future studies will explicitly relax the linearity and homogeneity assumptions used in the present model and evaluate the robustness of our findings under more realistic, nonlinear, and heterogeneous conditions. Specific directions include the following:
-
(1)
Introducing heterogeneous influence strengths and susceptibilities across agents (continuous distributions or discrete classes) and testing how heterogeneity alters clustering thresholds and conversion dynamics.
-
(2)
Replacing fixed-radius, uniform interaction neighborhoods with variable network structures (random, small-world, scale-free, and empirical contact networks) and measuring sensitivity to local density and clustering coefficients.
-
(3)
Incorporating nonlinear persuasion functions and threshold rules.
-
(4)
Modeling perceptual noise and behavior-based inference (agents judge neighbors by observed actions rather than true types) to test robustness when identification is imperfect.
Acknowledgments
This research was conducted with the help of several members of the Yoshikawa Research Office, and the authors greatly benefited from their valuable advice and opinions. This study received support from the Tokyo Tech Tsubame Scholarship for Doctoral Students. We thank Diane Williams, Ph.D., from Edanz (https://jp.edanz.com/ac) for editing a draft of this manuscript.
- [1] E. Bakshy, J. M. Hofman, W. A. Mason, and D. J. Watts, “Everyone’s an influencer: quantifying influence on twitter,” Proc. Fourth ACM Int. Conf. Web Search Data Min. (WSDM’11), pp. 65-74, 2011. https://doi.org/10.1145/1935826.1935845
- [2] R. Schmitt-Beck, “Bandwagon effect,” G. Mazzoleni (Ed.), “The International Encyclopedia of Political Communication,” John Wiley & Sons, pp. 1-5, 2015. https://doi.org/10.1002/9781118541555.wbiepc015
- [3] S.-M. Choi, H. Lee, Y.-S. Han, K. L. Man, and W. K. Chong, “A recommendation model using the bandwagon effect for e-marketing purposes in IoT,” Int. J. Distrib. Sens. Netw., Vol.11, Issue 7, Article No.475163, 2015. https://doi.org/10.1155/2015/47516
- [4] X. Shen, “The role of psychological needs in understanding propaganda’s heterogeneous effects,” Social Science Research Network, 2022. https://doi.org/10.2139/ssrn.4177261
- [5] R. M. Chang, W. Oh, A. Pinsonneault, and D. Kwon, “A network perspective of digital competition in online advertising industries: A simulation-based approach,” Inf. Syst. Res., Vol.21, Issue 3, pp. 571-593, 2010. https://doi.org/10.1287/isre.1100.0302
- [6] Gallup, “Party affiliation.” https://news.gallup.com/poll/15370/party-affiliation.aspx [Accessed May 28, 2024]
- [7] D. E. Broockman and J. L. Kalla, “When and why are campaigns’ persuasive effects small? Evidence from the 2020 U.S. presidential election,” Am. J. Political Sci., Vol.67, Issue 4, pp. 833-849, 2023. https://doi.org/10.1111/ajps.12724
- [8] D. Gambetta, G. Mauro, and L. Pappalardo, “Mobility constraints in segregation models,” Scient. Rep., Vol.13, Article No.12087, 2023. https://doi.org/10.1038/s41598-023-38519-6
- [9] Y. Liao, J. Gil, S. Yeh, R. H. M. Pereira, and L. Alessandretti, “Socio-spatial segregation and human mobility: A review of empirical evidence,” arXiv:2403.06641, 2024. https://arxiv.org/abs/2403.06641
- [10] Y. Zhou and L. Liu, “Social influence based clustering of heterogeneous information networks,” Proc. 19th ACM SIGKDD Int. Conf. Knowl. Discovery Data Min., pp. 338-346, 2013. https://doi.org/10.1145/2487575.2487640
- [11] R. B. Cialdini and N. J. Goldstein, “Social influence: Compliance and conformity,” Annu. Rev. Psychol., Vol.55, No.2, pp. 591-621, 2004. https://doi.org/10.1146/annurev.psych.55.090902.142015
- [12] M. Van Zomeren, T. Postmes, and R. Spears, “Toward an integrative social identity model of collective action: A quantitative research synthesis of three socio-psychological perspectives,” Psychol. Bull., Vol.134, Issue 4, pp. 504-535, 2008. https://doi.org/10.1037/0033-2909.134.4.504
- [13] C. Castellano, S. Fortunato, and V. Loreto, “Statistical physics of social dynamics,” Rev. Mod. Phys., Vol.81, No.2, pp. 591-646, 2009. https://doi.org/10.1103/RevModPhys.81.591
- [14] M. Jalili and M. Perc, “Information cascades in complex networks,” J. Complex Netw., Vol.5, Issue 5, pp. 665-693, 2017. https://doi.org/10.1093/comnet/cnx019
- [15] S. Bikhchandani, D. Hirshleifer, and I. Welch, “A theory of fads, fashion, custom, and cultural change as informational cascades,” J. Polit. Econ., Vol.100, No.5, pp. 992-1026, 1992. https://doi.org/10.1086/261849
- [16] C. Baraniuk, “Covid-19: People are gathering again, but can crowds be made safe?,” BMJ, Vol.371, Article No.m3511, 2020. https://doi.org/10.1136/bmj.m3511
- [17] A. Tavan, A. D. Tafti, M. Nekoie-Moghadam, M. Ehrampoush, M. R. V. Nasab, H. Tavangar, and H. Fallahzadeh, “Risks threatening the health of people participating in mass gatherings: A systematic review,” J. Educ. Health Promot., Vol.8, Article No.209, 2019. https://doi.org/10.4103/jehp.jehp_214_19
- [18] P. Zhu, X. Tan, M. Wang, F. Guo, S. Shi, and Z. Li, “The impact of mass gatherings on the local transmission of COVID-19 and the implications for social distancing policies: Evidence from Hong Kong,” PloS One, Vol.18, Issue 2, Article No.e0279539, 2023. https://doi.org/10.1371/journal.pone.0279539
- [19] T. C. Schelling, “Dynamic models of segregation,” J. Math. Sociol., Vol.1, Issue 2, pp. 143-186, 1971. https://doi.org/10.1080/0022250X.1971.9989794
- [20] D. Vinković and A. Kirman, “A physical analogue of the Schelling model,” Proc. Natl. Acad. Sci., Vol.103, Issue 51, pp. 19261-19265, 2006. https://doi.org/10.1073/pnas.0609371103
- [21] N. G. Domic, E. Goles, and S. Rica, “Dynamics and complexity of the Schelling segregation model,” Phys. Rev. E, Vol.83, Article No.056111, 2011. https://doi.org/10.1103/PhysRevE.83.056111
- [22] W. Michener, “The individual psychology of group hate,” J. Hate Stud., Vol.10, Issue 1, 2011. https://doi.org/10.33972/jhs.112
- [23] A. Singh, D. Vainchtein, and H. Weiss, “Schelling’s segregation model: parameters, scaling, and aggregation,” Demogr. Res., Vol.21, pp. 341-366, 2009. https://doi.org/10.4054/DemRes.2009.21.12
- [24] W. C. Kim, “Blue ocean strategy: From theory to practice,” Calif. Manag. Rev., Vol.47, Issue 3, pp. 105-121, 2005. https://doi.org/10.1177/000812560504700301
This article is published under a Creative Commons Attribution-NoDerivatives 4.0 Internationa License.