
Research Paper:
In Situ Visualization of Bubble Formation During Selective Laser Melting of an Alumina Powder Bed
Daijiro Tokunaga†
 , Manabu Kodama
, Yuko Aono
, and Atsushi Hirata
, Manabu Kodama
, Yuko Aono
, and Atsushi Hirata
Department of Mechanical Engineering, Institute of Science Tokyo
2-12-1 Ookayama, Meguro-ku, Tokyo 152-8550, Japan
†Corresponding author

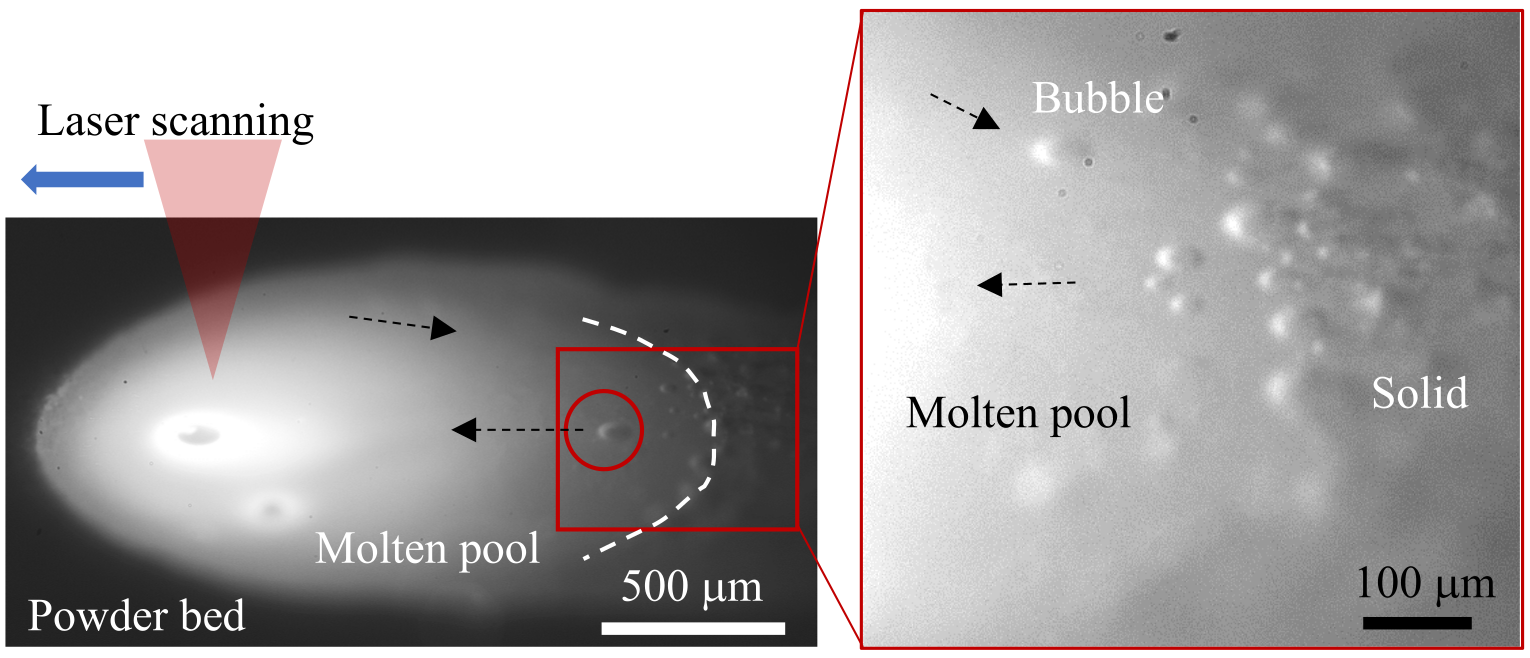
The behavior of bubble and pore formation during selective laser melting of ceramics remains unclear. In this study, in situ observations of a single laser scan over an alumina powder bed were performed using a simple near-infrared visualization system. A CO2 laser was scanned over a pressurized powder bed under various irradiation conditions, and the interior of the molten pool was recorded with a high-speed camera. The solidified beads were then analyzed by X-ray computed tomography. The observations revealed bubbles forming at the solid–liquid interface and migrating within the molten pool, which were ultimately trapped as pores in the solidified structure. In addition, a qualitative correlation was established between the pore distribution in the solidified structure and the bubble distribution observed in situ. The influence of laser irradiation conditions on pore formation behavior was systematically clarified. These results demonstrate the effectiveness of near-infrared observation techniques in selective laser melting of oxide ceramics.
Molten pool formed on the alumina powder bed
1. Introduction
Ceramics are used in a wide range of industrial, medical, and aerospace applications because of their high hardness, heat resistance, corrosion resistance, and biocompatibility. Most ceramic components are fabricated by sintering, and their inherent hardness and brittleness result in high postprocessing costs and limited manufacturability of complex geometries. In recent years, additive manufacturing (AM) has been applied to ceramics due to its advantages for flexible manufacturing in high-variety, low-volume production. Among various AM methods, stereolithography and selective laser melting (SLM) have been actively investigated. In particular, SLM is expected to be a highly efficient fabrication technique because it enables three-dimensional shaping without subsequent sintering 1,2,3,4,5.
However, applying SLM to ceramics remains challenging. The brittleness of ceramics leads to crack formation caused by thermal shock from localized heating during laser irradiation 6,7,8,9,10. In addition, bubbles form in the molten pool due to gas trapped in vacancies in the powder bed, evaporated components, and the keyhole bottom. Some of these bubbles persist during solidification, resulting in residual pores. These cracks and pores significantly reduce the mechanical strength of ceramic components 11,12,13,14,15. In particular, the mechanisms underlying bubble generation and migration, which are primarily related to pore formation, remain incompletely understood. Marangoni convection, driven by the temperature dependence of surface tension, strongly influences bubble movement and distribution inside the molten pool 16,17. The presence of Marangoni convection was validated by comparing numerical analyses with cross-sectional observations of solidified samples. The convection velocity within the molten pool was experimentally measured by tracking unmelted powder particles during direct energy deposition processes 15. In addition, the melting and solidification processes in SLM were visualized using operando tomographic microscopy. However, fundamental evidence for capturing the complete sequence of bubble formation, migration, and trapping within molten ceramic pools during solidification remains limited.
Numerous in situ X-ray imaging studies have been conducted on SLM processes for metals 18,19. In contrast, in situ observations of convection phenomena inside ceramic molten pools are extremely limited, resulting in a lack of fundamental experimental data required for reliable numerical modeling. Molten alumina, however, is optically transparent across the visible-to-near-infrared range 20 and can transmit radiation within submillimeter-scale molten pools. We previously conducted fundamental studies on the laser welding and AM of ceramic micro components by irradiating cylindrical alumina specimens approximately 1 mm in diameter. The generation, coalescence, and migration of bubbles inside the molten pool were successfully visualized using near-infrared (NIR) light, taking advantage of the optical properties of molten alumina. The results indicated that some bubbles are not released at the gas–liquid interface but circulated within the molten pool 21.
In this study, bubble generation, migration, and pore formation in alumina SLM were investigated through in-situ observation of the molten pool interior using NIR light. A pressurized alumina powder bed was scanned with a CO\(_2\) laser, and the interior of the molten pool was observed using a simple optical system consisting of an NIR light source and a band-pass filter. A fundamental understanding of the melting and solidification processes in ceramic SLM was obtained by clarifying the relationship between the in situ observed bubble dynamics and the pore distribution after solidification.
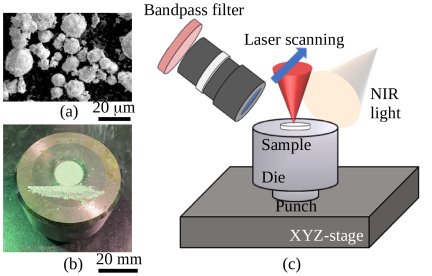
Fig. 1. Experimental setup: (a) SEM image of the powder, (b) pressed sample, and (c) apparatus.
2. Materials and Methods
Figure 1 shows a schematic of the specimen and the experimental setup. In this study, the behavior of bubbles inside a molten pool formed in a powder bed during laser irradiation was examined. Bubbles originating from the base plate and the balling effect were minimized to focus on bubble dynamics within the molten pool. The balling effect has been reported to be effectively suppressed by applying pressure to the powder bed 6; this method was adopted in this study. Fig. 1(a) shows a scanning electron microscopy (SEM) image of the alumina powder, and Fig. 1(b) shows the pressurized powder bed specimen. Fine alumina particles with a size of 7–13 μm (AO-509, Admatechs Co., Ltd., 99.8% purity) were manually filled into an SCM435 steel die with an inner diameter of 16 mm. The filling depth was set at approximately 2 mm from the specimen stage (lower punch). An upper punch was placed on top of the powder, and a uniaxial pressure of 40 MPa was applied using a hydraulic pump. The resulting powder bed was sufficiently thick so that the molten pool did not penetrate the specimen stage, which served as the base plate. Therefore, all observed phenomena could be considered to originate solely from the powder bed.
Figure 1(c) shows a schematic of the experimental setup. A continuous-wave CO\(_2\) laser (f201, Novanta Inc.) was used as the laser source because of its high absorption by Al\(_2\)O\(_3\). The laser wavelength was 10.6 μm, and the output power ranged from 1 to 200 W. The laser beam was focused using a 100 mm focal-length lens, resulting in a spot diameter of approximately 400 μm. The laser power was varied from 15 to 150 W, while the scanning speed was adjusted from 200 to 20,000 μm/s, with a constant normalized enthalpy as defined in Eq. (1):
The pressurized powder bed inside the die was mounted on an \(\mathit{XYZ}\) stage and laser irradiation was applied from above. Laser scanning was performed across the specimen surface by moving the stages. The molten pool was observed using a high-speed camera (Phantom V2640M, Vision Research Inc.) positioned at a 30° angle relative to the powder bed surface and perpendicular to the laser scanning direction. Details of the illumination system and other optical components are described in our previous study 21. All experiments were conducted under ambient atmospheric conditions.
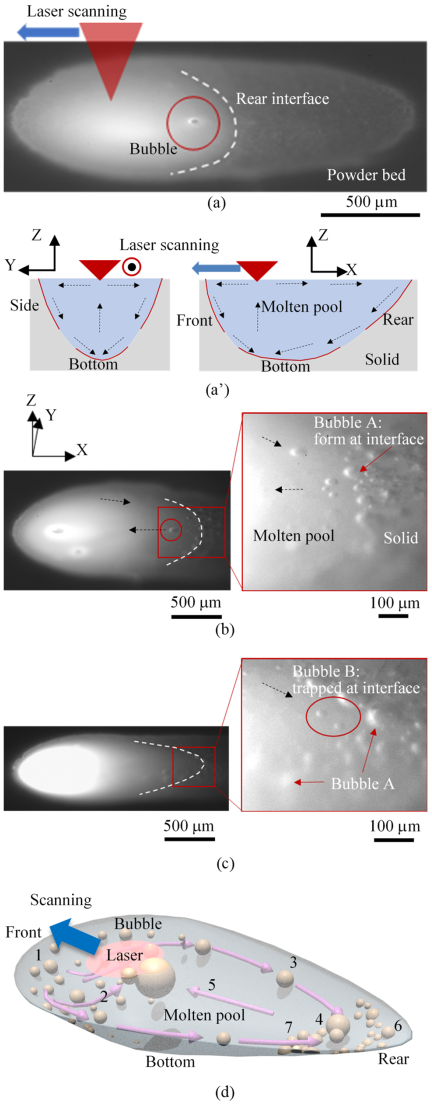
Fig. 2. High-speed images of molten pool generated by different laser power and scanning speed: (a) 26 W–600 μm/s, (b) 47 W–2,000 μm/s, (c) 82 W–6,000 μm/s. (a’) Schematic illustrations of the molten pool and (d) typical bubble motion inside the molten pool.
3. Results and Discussion
3.1. Representative Molten Pools
Figure 2 shows high-speed camera images of a quasi-steady molten pool after the initial transient stage of laser scanning, under three processing conditions with the same normalized enthalpy: (a) 26 W–600 μm/s, (b) 47 W–2,000 μm/s, and (c) 82 W–6,000 μm/s. The laser scanned to the left. The average direction of bubble migration is indicated by black dashed arrows. A video of condition (a) is provided in Supplementary Material 1. The bubbles, highlighted by the red circle in Fig. 2(a), form during the initial stage of laser-induced melting. The bubble moves in the laser-scanning direction at a velocity comparable to the laser-scanning speed, so the relative distance between the bubble and the laser irradiation point remains nearly constant.
A schematic representation in Fig. 2(a’) shows the cross-sectional molten-pool shapes expected from the literature, viewed both along and perpendicular to the laser scanning direction 23. The red lines indicate the solid–liquid interfaces, referred to as the side, bottom, front, and rear interfaces. For example, the white dashed line in the observation images indicates the rear interface, where solidification occurs during laser scanning. The black dashed arrows in Fig. 2(a’) depict a typical Marangoni convection pattern driven by the temperature gradients. The surface tension of molten alumina decreases with increasing temperature, reaching a minimum at the laser spot. Consequently, Marangoni convection directed toward the side interface is induced along the laser-scanning direction, as shown in Fig. 2(a’). This convection causes a flow toward the bottom interface and an upward flow toward the laser-irradiated spot. A similar convection pattern should appear in the schematic when viewed perpendicular to the laser scanning direction.
The overall and magnified videos of the in-situ observations in Fig. 2(b) are shown in Supplementary Materials 2 and 3, respectively. The bubbles migrating inside the molten pool are considered to originate at the front interface, where melting occurs during laser scanning. As indicated by the black dashed arrows in Fig. 2(b), these bubbles travel along the side interface toward the rear interface. The bubbles migrate toward the laser spot after coalescing with surrounding bubbles and following the laser scan, as shown by the bubble in Fig. 2(a). In addition, bubbles that migrate directly from the front interface toward the laser-irradiated spot and follow the laser scan are observed. In contrast, bubbles are also observed at the rear interface. Many of these bubbles are not released into the interior of the molten pool but are instead captured at the rear interface. Hereafter, bubbles formed during solidification are referred to as Bubble A. Bubble A is attributed to differences in gas solubility between the liquid and solid phases.
The overall and magnified videos of the in-situ observations in Fig. 2(c) are shown in Supplementary Materials 4 and 5, respectively. The bubble highlighted by the red circle migrates toward the rear interface and is subsequently captured there. Bubbles that migrate within the molten pool and are eventually trapped in the solidified microstructure are hereafter referred to as Bubble B. The formation of Bubble A is observed, as shown in Fig. 2(b). However, in contrast to Fig. 2(b), bubbles form not only at the rear interface, but also near the bottom interface. Therefore, the NIR-based observation system allows direct capture of bubble behavior originating within the molten pool and potentially forming pores during solidification. It should be noted that, as reported in previous studies, the observed NIR images correspond not to the transmitted or scattered illumination light passing through the molten pool, but to the NIR component of the high-temperature thermal emission from the molten pool.
Figure 2(d) shows a schematic overview of the bubble behavior under different irradiation conditions. The numbers indicate the locations at which specific bubble behaviors are observed; these behaviors vary with the laser irradiation settings. Bubbles form at the front interface at position 1. These bubbles either migrate directly toward the laser-irradiated spot, as seen at position 2, or toward the rear interface along the side interface, as indicated at position 3. Near the rear interface at position 4, the bubbles either coalesce with the surrounding bubbles or become trapped at the rear interface, forming Bubble B. After coalescence, the bubbles migrate toward the laser-irradiated spot along the center of the width of the molten pool, as shown at position 5, and then follow the laser-scanning movement. In addition, bubbles form during solidification in the area from the rear interface to the bottom interface, as shown by positions 6 and 7, which are referred to as Bubble A. Notably, the bubble that moves toward the laser-irradiated spot at position 5 traveled in the direction opposite to typical Marangoni convection, as shown schematically in Fig. 2(a’). This behavior is attributed to convection, which drives the bubbles from the side interface toward the rear interface at position 3, creating a flow toward the laser-irradiated spot. Moreover, this bubble motion may have occurred within the interior of the molten pool rather than along the surface.
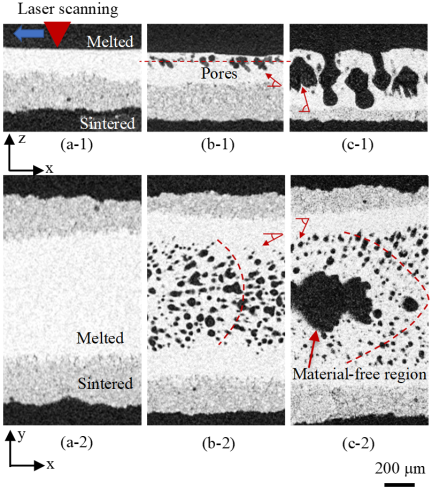
Fig. 3. X-ray CT images: (a-1), (b-1), and (c-1) show the \(x\)–\(z\) plane of the laser optical axis; and (a-2), (b-2), and (c-2) show the \(x\)–\(y\) plane at the vicinity of the surface, corresponding to the conditions in Fig. 2: (a) 26 W–600 μm/s, (b) 47 W–2,000 μm/s, and (c) 82 W–6,000 μm/s, respectively.
3.2. X-ray Computed Tomography Images
X-ray computed tomography (CT) is widely used to characterize defect distributions 24,25,26. In CT images, gas-filled pores appear as dark regions due to their low X-ray attenuation 27. Fig. 3 shows cross-sectional images of the specimens obtained using a microfocus X-ray CT system (inspeXio SMX-225CT, Shimadzu Corporation). The X-ray CT system operated with a micro focused tungsten X-ray tube at 160 kV and 70 μA. A total of 1,800 projections were acquired over 360°, yielding a reconstructed voxel size of 2 \(\times\) 2 \(\times\) 3 μm\(^{3}\) 28. The effective spatial resolution under these conditions is approximately 10 \(\times\) 10 \(\times\) 10 μm\(^{3}\). The processing conditions for each specimen are shown in Fig. 2. Figs. 3(a-1)–(c-1) and (a-2)–(c-2) correspond to the cross section including the laser optical axis in the \(x\)–\(z\) plane and the \(x\)–\(y\) plane of the near-surface cross section indicated by the dashed line in the \(x\)–\(z\) plane, respectively. The white regions represent the melted and solidified areas, whereas the gray regions correspond to the powder near the molten region sintered below the melting temperature. In Fig. 3(a-1), no pores are observed within the melted and solidified regions, whereas a large number of pores (black regions) are clearly identified in Figs. 3(b-1) and (c-1). The pore morphology is elongated, which is characteristic of bubbles generated by differences in gas solubility between the liquid and solid phases. The elongation direction of these pores generally indicates the migration direction of the solidification front (rear interface). The angle between the pore elongation direction, indicated by the red arrows, and the laser scanning direction is larger in Fig. 3(c-1) than in Fig. 3(b-1). In addition, in Fig. 3(b-1), pores are predominantly formed near the laser-irradiated spot, whereas in Fig. 3(c-1), pore formation is more pronounced near the bottom of the melted and solidified regions. These results indicate that the bubbles formed near the bottom interface, as observed in Fig. 2(c), which exhibit a larger solidification angle relative to the laser scanning direction, predominantly contribute to pore formation. The pores in Fig. 3(c-1) are larger than those in Fig. 3(b-1). This difference is attributed to the longer path that bubbles originating from the bottom interface traverse within the molten pool before solidification compared to those formed at the rear interface. Furthermore, as indicated by the red arrows in Fig. 3(c-2), the pore elongation direction relative to the laser scanning direction is larger than that in Fig. 3(b-2). This difference is attributed to the variations in the solidification vector arising from the geometry of the rear interface, as shown in Figs. 2(b) and (c). The red dashed lines in Figs. 3(b-2) and (c-2) show the estimated profiles of the rear interface in the pore-generation regions during melting and solidification, constructed by connecting lines perpendicular to the elongation directions of the individual pores. In Fig. 3(c-2), the large black region does not represent a pore, but a material-free area in the displayed cross-section, resulting from the concave shape of the solidified region under high-power and high-scanning-speed conditions. Fig. 4 shows a representative cross section in the \(y\)–\(z\) plane corresponding to Fig. 3(c). The red dashed line indicates the position of the \(x\)–\(y\) plane corresponding to Fig. 3(c-2). The laser-irradiated surface exhibits a concave-shaped profile, and no material is present near the center of the red dashed line. The cross-sections in Figs. 3(c-1) and 3(c-2) were taken at different locations to improve pore visibility.
Based on the present results, it is concluded that the morphology and spatial distribution of the pores formed during melting and solidification are governed by bubble behavior, as revealed by in situ observations. However, the pores originating from Bubble B cannot be clearly identified because of the large number of pores originating from Bubble A.
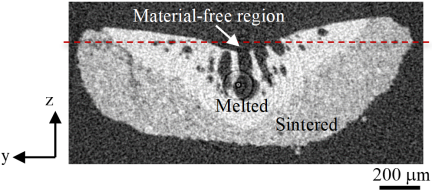
Fig. 4. X-ray CT image of the representative \(y\)–\(z\) plane corresponding to Fig. 3(c) (82 W–6,000 μm/s).
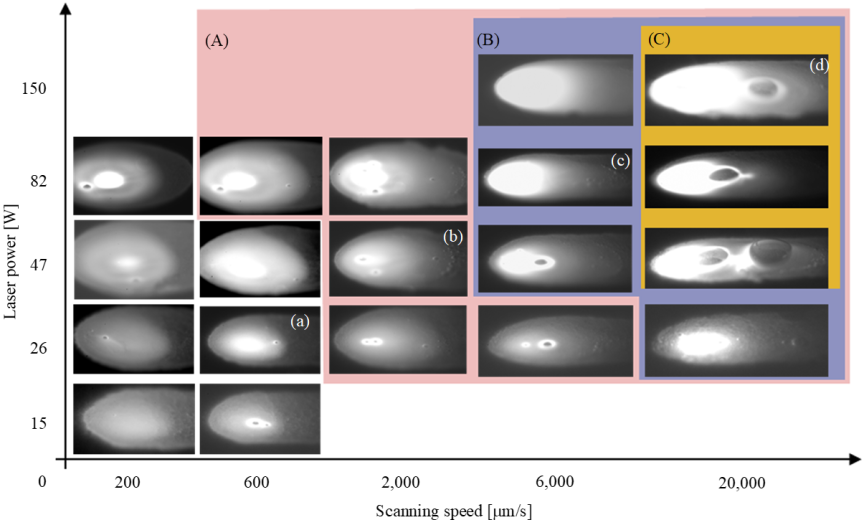
Fig. 5. Each snapshot from the experiments. The scale of the figures has been arbitrarily adjusted to improve the visibility of the molten pool (the width of the molten solidified parts ranges from 0.5 to 4.0 mm, see details in Fig. 5). Areas (A) and (B) illustrate the conditions that form Bubble A and Bubble B, respectively. Area (C) illustrates the conditions that create a large bubble, which disconnects the molten pool.
3.3. Effect of Laser Irradiation Conditions
Figure 5 shows the in-situ observation images captured under all laser irradiation conditions. Brightness and spatial scale were individually adjusted for each image to enhance visibility. Figs. 5(a), (b), and (c) correspond to the images in Figs. 2 and 3. Regions (A) and (B) highlight the areas where Bubbles A and B are observed. As the laser scanning speed increased, Bubble A was observed to form first, whereas Bubble B appeared only at higher scanning speeds. It has been reported that bubble formation resulting from differences in gas solubility between the liquid and solid phases requires a threshold solidification interface velocity, and the present results are consistent with these reports 29,30. Notably, the generation condition for Bubble B is included within that for Bubble A, and both types of bubbles are observed simultaneously, as confirmed under the irradiation condition of 82 W–6,000 μm/s shown in Fig. 2(c).
Bubble B is generated when the laser scanning speed exceeds the bubble migration velocity. Because bubble migration depends on Marangoni convection, pore formation is governed by the relationship between the solidification and convection velocities. However, as observed in Supplementary Material 2, some bubbles temporarily remain near the solid–liquid interface before migrating. This suggests that experimental investigations and modeling that account for bubble diameter are necessary and remain subjects for future research.
In region (C), large bubbles were intermittently generated at higher scanning speeds, as shown in Fig. 5(d). These bubbles grow to sizes comparable to the width of the molten pool and either solidify or rupture without migrating into the molten pool, significantly reducing the visibility of the pool interior. In addition, bubble rupture causes intermittent disruption in the molten pool. Consequently, region (C) was excluded from the analysis because in situ observation of the molten pool interior is difficult under these conditions, and severe defects form.
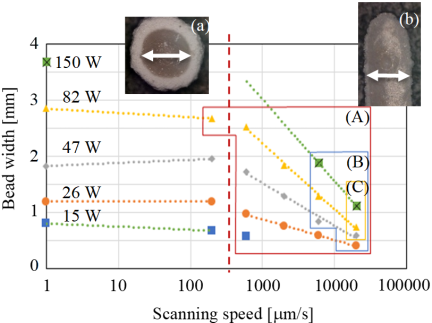
Fig. 6. Bead width as a function of scanning speed: (a) bead image formed without laser scanning, (b) a typical example of a laser-scanned bead.
3.4. Bead Width
Figure 6 shows the bead width as a function of laser scanning speed. The data obtained at a scanning speed of 1 μm/s correspond to the bead width produced by stationary laser irradiation until the molten pool reaches a steady state. A representative micrograph is shown in Fig. 6(a). The bead width was measured as the width of the melted and solidified regions, excluding the surrounding white-sintered regions. Measurements were taken immediately before the laser irradiation was stopped. A representative image is shown in Fig. 6(b). The red, blue, and yellow frames in the figure correspond to regions (A), (B), and (C) in Fig. 5, respectively.
The bead width decreases from approximately 3.5 to 0.5 mm as scanning speed increases and laser power decreases. A change in slope is observed at a scanning speed of approximately 600 μm/s. The dotted lines represent logarithmic fits to the data obtained separately for scanning speeds below and above this point. This behavior is associated with the transition from quasi-steady to transient heat conduction, determined by the balance between thermal diffusion and laser scanning. At low scanning speeds, the temperature field develops sufficiently, resulting in a gradual decrease in bead width. At higher scanning speeds, the limited interaction time suppresses lateral diffusion, and the process becomes transient and scanning-dominated, leading to a rapid decrease in bead width.
4. Conclusion
In this study, bubble behavior and pore formation during the SLM of alumina were investigated through in situ visualization of the molten pool interior. A pressurized alumina powder bed was irradiated with a CO\(_2\) laser, and the interior of the molten pool was observed using a high-speed camera equipped with a NIR light source and a band-pass filter. The main conclusions of this study are as follows:
-
・
Bubble formation and migration inside the molten pool were visualized by observing near-infrared emission from the high-temperature molten pool.
-
・
No bubbles capable of forming pores were observed at laser scanning speeds below 600 μm/s. Between 600 and 2,000 μm/s, pores were generated at the solidification front, whereas above 2,000 μm/s, bubbles migrating within the molten pool were trapped during solidification. Based on these observations, a model describing bubble behavior was developed.
-
・
The effectiveness of near-infrared observation for evaluating pore formation mechanisms was demonstrated by X-ray computed tomography, which revealed a qualitative correlation between in situ bubble behavior, pore number, and morphology in the solidified structure.
-
・
Laser scanning under low-power and low-speed conditions enabled the formation of solidified structures with high packing densities.
-
・
The bead width decreased with decreasing laser power and increasing scanning speed. The rate of change varies around a scanning speed of approximately 600 μm/s.
This study demonstrated that in situ visualization of bubble behavior and pore formation mechanisms during SLM of alumina using a simple optical system enables the optimization of laser irradiation conditions and real-time defect detection. This approach contributes significantly to the development of additive manufacturing techniques capable of producing fully dense ceramic components without porosity.
Acknowledgments
This work was supported in part by JSPS KAKENHI Grant Number JP25K17521 and Mizuho Foundation for the Promotion of Sciences.
Supplementary Material
Supplementary Material 1
Supplementary Material 2
Supplementary Material 3
Supplementary Material 4
Supplementary Material 5
- [1] A. Ur Rehman, A. Ullah, T. Liu, R. Ur Rehman, and M. U. Salamci, “Additive manufacturing of AlO ceramics with MgO/SiC contents by laser powder bed fusion process,” Front. Chem., Vol.11, Article No.1034473, 2023. https://doi.org/10.3389/fchem.2023.1034473
- [2] S. Yan et al., “Formation mechanism and process optimization of nano AlO-ZrO eutectic ceramic via laser engineered net shaping (LENS),” Ceram. Int., Vol.43, No.17, pp. 14742-14747, 2017. https://doi.org/10.1016/j.ceramint.2017.07.214
- [3] F. Verga et al., “Laser-based powder bed fusion of alumina toughened zirconia,” Addit. Manuf., Vol.31, Article No.100959, 2020. https://doi.org/10.1016/j.addma.2019.100959
- [4] N. Travitzky et al., “Additive manufacturing of ceramic-based materials,” Adv. Eng. Mater., Vol.16, No.6, pp. 729-754, 2014. https://doi.org/10.1002/adem.201400097
- [5] Y. Hosoya, D. Tokunaga, S. Momozono, Y. Aono, and A. Hirata, “Fundamental study on direct and serial joining of spherical alumina particles with CO laser,” J. Mater. Process. Technol., Vol.326, Article No.118314, 2024. https://doi.org/10.1016/j.jmatprotec.2024.118314
- [6] Y.-D. Qiu et al., “Balling phenomenon and cracks in alumina ceramics prepared by direct selective laser melting assisted with pressure treatment,” Ceram. Int., Vol.46, pp. 13854-13861, 2020. https://doi.org/10.1016/j.ceramint.2020.02.178
- [7] Y. Zhang et al., “Morphology and formation mechanism of cracks in AlO–ZrO eutectic ceramics fabricated via laser powder bed fusion,” J. Am. Ceram. Soc., Vol.107, No.4, pp. 2128-2142, 2024. https://doi.org/10.1111/jace.19586
- [8] J. Deckers, S. Meyers, J. P. Kruth, and J. Vleugels, “Direct selective laser sintering/melting of high density alumina powder layers at elevated temperatures,” Phys. Procedia, Vol.56, pp. 117-124, 2014. https://doi.org/10.1016/j.phpro.2014.08.154
- [9] Y. Zheng et al., “Cracks of alumina ceramics by selective laser melting,” Ceram. Int., Vol.45, No.1, pp. 175-184, 2019. https://doi.org/10.1016/j.ceramint.2018.09.149
- [10] Z. Shen et al., “Laser additive manufacturing of melt-grown AlO/GdAlO eutectic ceramic composite: Powder designs and crack analysis with thermo-mechanical simulation,” J. Eur. Ceram. Soc., Vol.42, No.14, pp. 6583-6598, 2022. https://doi.org/10.1016/j.jeurceramsoc.2022.07.020
- [11] H. Liu et al., “Effect of scanning speed on the solidification process of AlO/GdAlO/ZrO eutectic ceramics in a single track by selective laser melting,” Ceram. Int., Vol.45, No.14, pp. 17252-17257, 2019. https://doi.org/10.1016/j.ceramint.2019.05.281
- [12] F. Niu et al., “Microstructure and macro properties of AlO ceramics prepared by laser engineered net shaping,” Ceram. Int., Vol.44, No.12, pp. 14303-14310, 2018. https://doi.org/10.1016/j.ceramint.2018.05.036
- [13] H. Liu et al., “Insights into high thermal stability of laser additively manufactured AlO/GdAlO/ZrO eutectic ceramics under high temperatures,” Addit. Manuf., Vol.48, Article No.102425, 2021. https://doi.org/10.1016/j.addma.2021.102425
- [14] Z. Liu et al., “Formation mechanism and quantitative analysis of pores in AlO–ZrO ceramic different structures by laser additive manufacturing,” Ceram. Int., Vol.49, No.10, pp. 16099-16109, 2023. https://doi.org/10.1016/j.ceramint.2023.01.208
- [15] F. Li, Z. Liu, B. Li, Y. Wang, and Y. Zhang, “Pore formation model for direct laser deposition of AlO–ZrO ceramic,” J. Eur. Ceram. Soc., Vol.42, No.1, pp. 207-215, 2022. https://doi.org/10.1016/j.jeurceramsoc.2021.09.042
- [16] D. Triantafyllidis, L. Li, and F. H. Stott, “Mechanisms of porosity formation along the solid/liquid interface during laser melting of ceramics,” Appl. Surf. Sci., Vols.208-209, pp. 458-462, 2003. https://doi.org/10.1016/S0169-4332(02)01433-2
- [17] E. Li, Z. Zhou, L. Wang, R. Zou, and A. Yu, “Numerical studies of melt pool and gas bubble dynamics in laser powder bed fusion process,” Addit. Manuf., Vol.56, Article No.102913, 2022. https://doi.org/10.1016/j.addma.2022.102913
- [18] C. L. A. Leung et al., “In situ X-ray imaging of defect and molten pool dynamics in laser additive manufacturing,” Nat. Commun., Vol.9, Article No.1355, 2018. https://doi.org/10.1038/s41467-018-03734-7
- [19] Q. Guo et al., “In-situ full-field mapping of melt flow dynamics in laser metal additive manufacturing,” Addit. Manuf., Vol.31, Article No.100939, 2020. https://doi.org/10.1016/j.addma.2019.100939
- [20] J. K. R. Weber, S. Krishnan, C. D. Anderson, and P. C. Nordine, “Spectral absorption coefficient of molten aluminum oxide from 0.385 to 0.780 μm,” J. Am. Ceram. Soc., Vol.78, No.3, pp. 583-587, 1995. https://doi.org/10.1111/j.1151-2916.1995.tb08218.x
- [21] D. Tokunaga, Y. Aono, and A. Hirata, “Near-infrared in situ observation of bubble migration and crystal growth behavior in a laser-induced AlO molten pool,” J. Vis., Vol.28, No.6, pp. 1133-1142, 2025. https://doi.org/10.1007/s12650-025-01087-0
- [22] D. B. Hann, J. Iammi, and J. Folkes, “A simple methodology for predicting laser-weld properties from material and laser parameters,” J. Phys. D: Appl. Phys., Vol.44, Article No.445401, 2011. https://doi.org/10.1088/0022-3727/44/44/445401
- [23] H. Shen, J. Yan, and X. Niu, “Thermo-fluid-dynamic modeling of the melt pool during selective laser melting,” Materials, Vol.13, No.18, Article No.4157, 2020. https://doi.org/10.3390/ma13184157
- [24] S. Ishibashi et al., “Porosity and tensile properties of rhizoid porous structure fabricated using selective laser melting,” Int. J. Automation Technol., Vol.14, No.4, pp. 582-591, 2020. https://doi.org/10.20965/ijat.2020.p0582
- [25] A. Tawfik, M. Radwan, M. A. Attia, P. Bills, R. Racasan, and L. Blunt, “The detection of unfused powder in EBM and SLM additive manufactured components,” Int. J. Automation Technol., Vol.14, No.6, pp. 1025-1035, 2020. https://doi.org/10.20965/ijat.2020.p1025
- [26] A. Tawfik, P. Bills, and L. Blunt, “Development of an additive manufactured artifact to characterize unfused powder using computed tomography,” Int. J. Automation Technol., Vol.14, No.3, pp. 439-446, 2020. https://doi.org/10.20965/ijat.2020.p0439
- [27] E. Maire and P. J. Withers, “Quantitative X-ray tomography,” Int. Mater. Rev., Vol.59, No.1, pp. 1-43, 2014. https://doi.org/10.1179/1743280413Y.0000000023
- [28] A. Ohashi et al., “Stress distribution in the composite electrodes of sulfide all-solid-state lithium-ion batteries,” J. Power Sources, Vol.470, Article No.228437, 2020. https://doi.org/10.1016/j.jpowsour.2020.228437
- [29] H. Su et al., “Distribution control and formation mechanism of gas inclusions in directionally solidified AlO-ErAlO-ZrO ternary eutectic ceramic by laser floating zone melting,” J. Mater. Sci. Technol., Vol.66, pp. 21-27, 2021. https://doi.org/10.1016/j.jmst.2020.03.085
- [30] P. B. Oliete and J. I. Peña, “Study of the gas inclusions in AlO/YAlO and AlO/YAlO/ZrO eutectic fibers grown by laser floating zone,” J. Cryst. Growth, Vol.304, No.2, pp. 514-519, 2007. https://doi.org/10.1016/j.jcrysgro.2007.02.042
This article is published under a Creative Commons Attribution-NoDerivatives 4.0 Internationa License.