Research Paper:
Comparison of 3D Point Cloud Acquisition Accuracy in a Large-Scale Japanese Pear Tree Orchard
Kohei Shibata*1, Nobuo Kochi*2,*3,†, and Kazutoshi Hamada*4
*1The United Graduate School of Agricultural Science, Ehime University
3-5-7 Tarumi, Matsuyama, Ehime 790-8566, Japan
*2National Agriculture and Food Research Organization
Tokyo, Japan
*3R&D Initiative, Chuo University
Tokyo, Japan
*4Faculty of Agriculture and Marine Science, Kochi University
Nankoku, Japan
†Corresponding author

Practical three-dimensional (3D) phenotyping in large-scale orchards with repetitive row structures remains challenging, and systematic evidence comparing both accuracy and acquisition efficiency under outdoor conditions remains limited. This study presents a field-deployable evaluation framework and implements it in a 2-ha commercial Japanese pear orchard trained under a joint V-trellis system. Using a terrestrial laser scanner (TLS) as the reference, we evaluated two handheld LiDAR systems (a low-cost SLAM-based system and a high-performance system), structure from motion / multi-view stereo (SfM/MVS) reconstructions from three camera platforms (a digital camera, an action camera, and a 360° camera), and 3D Gaussian splatting (3DGS) constructed from action-camera video. Measurements were taken at two spatial scales to capture scale-dependent effects. In the span-scale survey (4 m), location error was derived from TLS-referenced target coordinate differences, and reconstruction error was quantified using cloud-to-mesh distances with cubic targets. In the row-scale survey (one tree row), positional stability during continuous mapping was evaluated as location error. Operational metrics (acquisition time, data volume, and processing effort) were also documented. The results demonstrate clear trade-offs among the methods: LiDAR enables rapid wide-area acquisition but is susceptible to cumulative drift in row-structured environments, whereas SfM/MVS provides superior geometric fidelity at the cost of increased time and data volume. Although 3DGS is less suitable for precise quantitative measurement, it demonstrates strong potential for intuitive visualization of orchard structure and fruit distribution. These findings highlight the need for staged, purpose-specific, and seasonally adaptive strategies for orchard-scale digital twin development.
3D sensing comparison in orchard
1. Introduction
In fruit tree cultivation, phenotypic characteristics, including branch architecture, growth patterns, and the position and size of fruits, play an essential role in evaluating tree development, orchard management, and yield prediction 1,2,3. In Japanese fruit production, these data have traditionally been collected through manual measurements and interpreted based on growers’ experience and intuition.
Historically, Japanese fruit agriculture has been characterized by small-scale farms with a strong emphasis on high-quality production. However, the decline and aging of the agricultural workforce have resulted in an increase in abandoned farmland. In response, farmland consolidation and the expansion of large-scale orchards have progressively accelerated in recent years. In the fruit sector, standardized training systems, such as the tall spindle system for apple trees 4 and the joint V-trellis system for Japanese pear trees 5,6,7, have been increasingly implemented to support efficient management in large-scale orchard systems. In particular, joint training systems for Japanese pear have expanded throughout Japan, with 74.1 ha documented in national surveys in 2017 and a further 55.0 ha established under replanting and new planting support programs during FY2019–FY2023: notably, this approach represents approximately half of the recent replanting and new planting area in Japanese pear production 8. Nevertheless, in such large-scale orchards, acquiring phenotypic data by means of traditional manual methods is highly impractical due to labor and time requirements.
To address the challenges of data acquisition in large-scale orchards, various approaches have been proposed, including the estimation of vegetation indices such as LAI and NDVI using UAV-based multispectral imaging 9, and fruit counting through image-based object detection methods 10,11. In parallel, advances in three-dimensional (3D) measurement technologies have enabled extensive studies on plant phenotyping using 3D point clouds derived from light detection and ranging (LiDAR) and structure from motion / multi-view stereo (SfM/MVS) 12,13,14,15,16,17,18.
In LiDAR-based measurement, low-cost handheld devices equipped with SLAM have become increasingly available, significantly lowering the barrier to field deployment. Meanwhile, in image-based 3D reconstruction, rendering-focused techniques, including neural radiance fields 19 and 3D Gaussian splatting (3DGS) 20, have been developed, offering high computational efficiency and detailed 3D representations. However, 3DGS is primarily designed for high-quality rendering rather than explicit geometric reconstruction purposes 20; therefore, geometric accuracy metrics should be carefully evaluated when applied to 3DGS-based outputs.
Despite rapid advances in these diverse 3D measurement technologies, comprehensive quantitative studies that systematically evaluate their accuracy and real-world applicability under outdoor and unstructured conditions, such as those found in large-scale orchards, remain limited. Required measurement accuracy is dependent on the intended application context. In commercial fruit grading systems, size classes are typically categorized at intervals of approximately 5 mm in fruit diameter; therefore, an estimation accuracy of approximately 5 mm can be considered a practical benchmark for fruit size estimation 21. By contrast, accuracy on the order of several centimeters is generally sufficient for fruit and branch detection, structural characterization, and overall canopy structure mapping, provided that row structure and spatial relationships are consistently preserved. Centimeter-level positioning based on RTK-GNSS is commonly employed in orchard navigation and digital orchard management 22,23.
Therefore, this study aims to develop practical guidelines for selecting appropriate 3D measurement methods for large-scale orchards by collecting 3D data using handheld LiDAR, SfM/MVS, and 3DGS, and quantitatively comparing their measurement accuracy using a terrestrial laser scanner (TLS) as the ground truth.
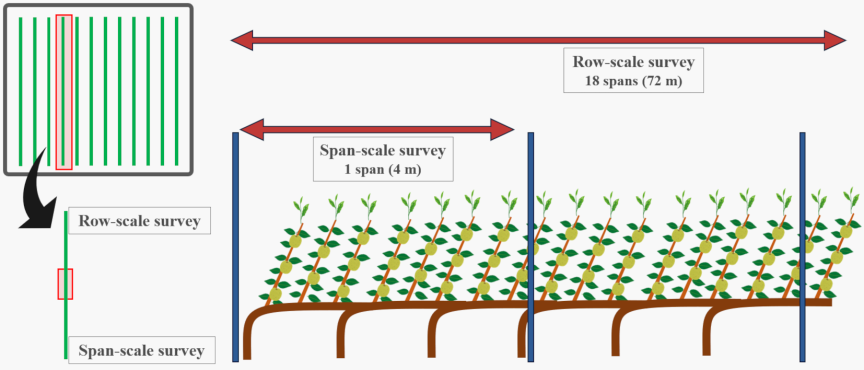
Fig. 1. Overview of the survey area and measurement scales in the experimental orchard. The row-scale survey encompassed a single tree row (18 spans, approximately 72 m), whereas the span-scale survey focused on an individual span (4 m).
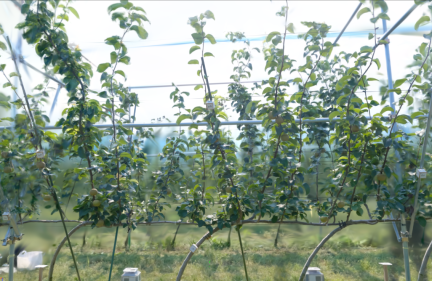
Fig. 2. The study orchard used in this experiment (generated by 3DGS).
Table 1. Specifications of LiDAR devices.

Table 2. Specifications of camera devices.

2. Experimental Design
2.1. Study Orchard
This study was conducted in a commercial Japanese pear orchard situated in Ibaraki Prefecture, Japan. The experiment was carried out in August 2025 over two separate days, and on both days, data acquisition was performed between approximately 09:00 and 15:00 under sunny conditions with no precipitation and an average wind speed of 2 m s\(^{-1}\). The experimental orchard covered 2 ha and utilized a joint V-trellis training system. In this system, the main trunk is horizontally trained at a height of approximately 0.8 m above ground level, with primary branches positioned on one side, thereby forming a characteristic tree architecture 6. Trees were planted at a spacing of 4 m between rows, and approximately 1.4 m between trees within a row, and steel pipes were placed along the rows at 4 m intervals. In this study, the section between adjacent steel pipes was designated as one span (Figs. 1 and 2).
To evaluate measurement accuracy at different spatial scales, 3D measurements were conducted under two conditions: a row-scale survey and a span-scale survey. The row-scale survey covered a single tree row comprising 18 spans (approximately 72 m), whereas the span-scale survey examined a single span to enable a detailed assessment of measurement accuracy.
2.2. Measurement Devices
In this study, a TLS (FARO Focus3D; FARO Technologies, Lake Mary, FL, USA) was used as the reference measurement system. The evaluated devices included a low-cost handheld LiDAR (Mapry LA03; Mapry Co., Ltd., Tamba, Hyogo, Japan), a high-performance handheld LiDAR system (LiGrip H120; GreenValley International Inc., Berkeley, CA, USA), and three camera platforms: a digital camera (Canon EOS R100; Canon Inc., Tokyo, Japan), an action camera (GoPro HERO5; GoPro, Inc., San Mateo, CA, USA), and a 360° camera (Insta360 X4; Insta360, Shenzhen, Guangdong, China). For camera-based measurements, 3D datasets were generated using SfM/MVS and 3DGS. The 3DGS method was specifically applied only to data acquired with the GoPro camera.
The Mapry LA03 is a handheld LiDAR system integrated with a single-line, non-repetitive scanning sensor, featuring an approximate scan rate of 200,000 points/s, a maximum ranging distance of approximately 40 m, and a relative accuracy of approximately 2 cm. It is a low-cost device initially developed for forest measurement and does not acquire any RGB color information. On the other hand, the LiGrip H120 is a high-performance handheld LiDAR system equipped with a multi-line, repetitive scanning sensor, featuring an approximate scan rate of 320,000 points/s, a maximum ranging distance of approximately 120 m, and a relative accuracy of approximately 3 cm. The LiGrip H120 also supports advanced GNSS-based post-processing and, although more expensive than the Mapry LA03, delivers higher point density and enhanced positional stability in large-area surveys (Table 1).
The Canon EOS R100 is a mirrorless camera equipped with an APS-C sensor, allowing for high-resolution image acquisition. The GoPro HERO5 features a wide-angle lens and offers high mobility; video frames extracted from recorded footage were utilized for both SfM/MVS and 3DGS processing. The Insta360 X4 is a 360° camera designed for omnidirectional image capture (Table 2).
Three-dimensional point clouds were generated through SfM/MVS processing with Agisoft Metashape Professional (ver. 2.2.1; Agisoft LLC, St. Petersburg, Russia), and LiDAR data processing and analysis were conducted using CloudCompare (ver. 2.13.2; EDF R&D, Paris, France).
2.3. Camera Measurement Resolution
The theoretical spatial resolution of the cameras used in this study was analytically estimated based on the imaging conditions and camera specifications using the following equations. The planar spatial resolution (\(XY\)), \(\Delta xy\), and the depth (\(Z\)) spatial resolution, \(\Delta z\), were computed as follows:
The theoretical spatial resolution of each camera, derived from the imaging conditions of the span-scale survey, and calculated using Eqs. \(\eqref{eq:eq1}\) and \(\eqref{eq:eq2}\), is summarized in Table 3. These values represent idealized estimates; the actual accuracy of the resulting 3D point clouds is affected by multiple factors, including image overlap, feature matching accuracy, lens distortion correction, and the camera orientation and position during image acquisition.
Table 3. Estimated theoretical spatial resolution of the cameras in the span-scale measurement.

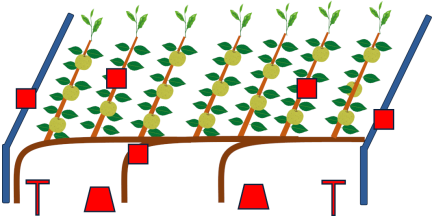
Fig. 3. Arrangement of targets in the span-scale survey (one side of the tree row). The square, trapezoidal, and T-shaped symbols denote cubic targets, cross-shaped targets, and pole targets, respectively.
2.4. Span-Scale Survey
To evaluate the accuracy achievable by each measurement method under conditions favorable to high-precision 3D data acquisition in a Japanese pear orchard, a span-scale survey targeting a single span (4 m tree-row length) was performed.
The measurement systems utilized in this study consisted of a TLS (FARO Focus3D), a handheld LiDAR (Mapry LA03), and three cameras (Canon EOS R100, GoPro HERO5, and Insta360 X4). For the camera data, 3D point clouds were generated and processed using SfM/MVS, and for the GoPro data, 3D data generation using 3DGS was further incorporated as an additional complementary approach. Because 3DGS is predominantly developed for high-quality rendering rather than explicit geometric reconstruction, its accuracy evaluation using the same geometric metrics as SfM/MVS should be interpreted as a reference assessment of geometric reproducibility.
For accuracy evaluation, reference targets were installed within the span: ten cubic targets (6 cm edge length) with coded targets on all faces, four pole-shaped targets with coded targets on their top surfaces, and four cross-shaped targets (Fig. 3).
TLS measurements were conducted from six positions—three on each side of the tree row—with a scan duration of 10 min per position. The TLS operated at a scan rate of 488,000 points/s, a maximum range of 120 m, and a relative accuracy of 3.1 mm. The Mapry measurements were conducted on each side of the tree row at an approximate distance of 1 m from the canopy while vertically traversing the device. The R100 captured images in continuous shooting mode following the same vertical motion. The GoPro continuously recorded video while being moved vertically, whereas the Insta360 captured video while being moved horizontally at two heights (approximately 1.5 m and 0.5 m above ground level).
After generating the 3D data separately for each side of the tree row, point cloud registration was performed and refined using the TLS data as the reference, based on two pole-shaped targets and two cubic targets. The coordinates of three cubic targets and two cross-shaped targets were then extracted and identified, and their deviations from the TLS-derived coordinates were calculated as location error.
Moreover, point clouds corresponding to the ten cubic targets were extracted and segmented into a cubic mesh (6 cm edge length) using the ICP method 24. Shape accuracy was subsequently assessed using the cloud-to-mesh (C2M) distance 25,26,27,28.
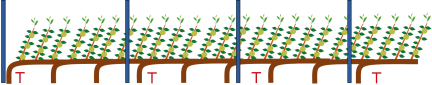
Fig. 4. Arrangement of targets in the row-scale survey. Pole targets with coded markers were installed at regular intervals along the tree row.
2.5. Row-Scale Survey
To evaluate the accuracy of each measurement method for wide-area 3D data acquisition in a Japanese pear orchard, a row-scale survey focusing on a single tree row (18 spans) was conducted.
The measurement systems included a TLS (FARO Focus3D), handheld LiDAR devices (Mapry LA03 and LiGrip H120), and two cameras (Canon EOS R100 and Insta360 X4). For the camera data, 3D point clouds were generated using the SfM/MVS methodology.
In the row-scale survey, 16 pole-shaped targets with coded targets on their top surfaces were installed along the target row. Point cloud registration was conducted using six of these targets, and positional error was assessed by calculating the coordinate differences between the remaining nine targets and the corresponding TLS-derived reference coordinates (Fig. 4).
TLS measurements were performed with a scan duration of 5 min per position, a scan rate of 244,000 points/s, and a maximum range of 120 m. Scans were collected at approximately 8 m intervals along the row, resulting in a total of 19 scan positions from both sides of the row. For the Mapry, LiGrip, and Insta360, data were collected by walking a complete loop around the canopy. The R100 captured images in continuous shooting mode, and images were acquired while vertically moving the camera, consistent with the span-scale survey.
Table 4. Data acquisition time and data volume in the span-scale survey.

Table 5. Location error in the span-scale survey.

Table 6. Reconstruction error in the span-scale survey, averaged across all ten cubic targets.

3. Result of the Span-Scale Survey
3.1. Data Volume and Acquisition Time
The data volume was largest for the Insta360, followed by the R100, the GoPro, and the Mapry (Table 4). The shortest acquisition duration was recorded time for the Insta360 (1.5 min), whereas the other devices each required approximately 5 min.
The processing time was longest for the Insta360, largely due to the additional SfM/MVS pre-processing steps, including frame extraction from video and the Build Point Cloud procedure. Moreover, equirectangular images from the Insta360 exhibited distortions near the top and bottom of the image, which increased the time required for manual registration to compensate for these effects. In contrast, because the Mapry does not support automatic registration, targets had to be manually identified directly in the point cloud, resulting in additional increased registration time.
3.2. Location Error
The Mapry exhibited a location error of approximately 40 mm, which was significantly larger than that of the other methods (Table 5). This error was particularly evident in the \(Z\)-direction.
Among the three SfM/MVS-based devices, no statistically significant differences in location error were observed; however, the Insta360 showed the largest deviation within this group, with notably greater errors in the \(Z\)-direction. On the other hand, the 3DGS reconstruction generated from the GoPro exhibited a location error more than three times larger than that of SfM/MVS, with substantial deviations in the \(X\)-direction corresponding to the row orientation.
3.3. Reconstruction Error
The number of points per cubic target was highest for the R100, followed by the Mapry, GoPro, and Insta360 (Table 6). For the GoPro, no statistically significant difference in the point count was identified between SfM/MVS and 3DGS. In contrast, the Insta360 produced a markedly lower point count, at approximately \(1/20\) that of the reference R100 system.
Each target point cloud was registered to a 6 cm cubic mesh prior to C2M calculation, resulting in mean ICP fitness values of 0.3666 for 3DGS, 0.7547 for GoPro, 0.3782 for Insta360, 0.1635 for Mapry, and 0.7189 for R100.
C2M distances between each target point cloud and a 6 cm cubic mesh were then calculated. The smallest mean C2M error was obtained for the point clouds generated by SfM/MVS, within which the Insta360 demonstrated the largest error. The mean error of GoPro-based 3DGS was approximately twice that of SfM/MVS, while the mean error of the Mapry was more than ten times larger than that of the R100.
Analysis of the C2M error distributions further indicated that, for SfM/MVS with the R100 and the GoPro, more than 50% of the points were contained within a 1 mm error range, allowing clear visual identification of cube edges and corners (Fig. 5). In contrast, for the Insta360- and GoPro-based 3DGS, more than 50% of the points were distributed within a 5 mm error range. For the Mapry, large target-level errors resulted in unstable ICP-based alignment.
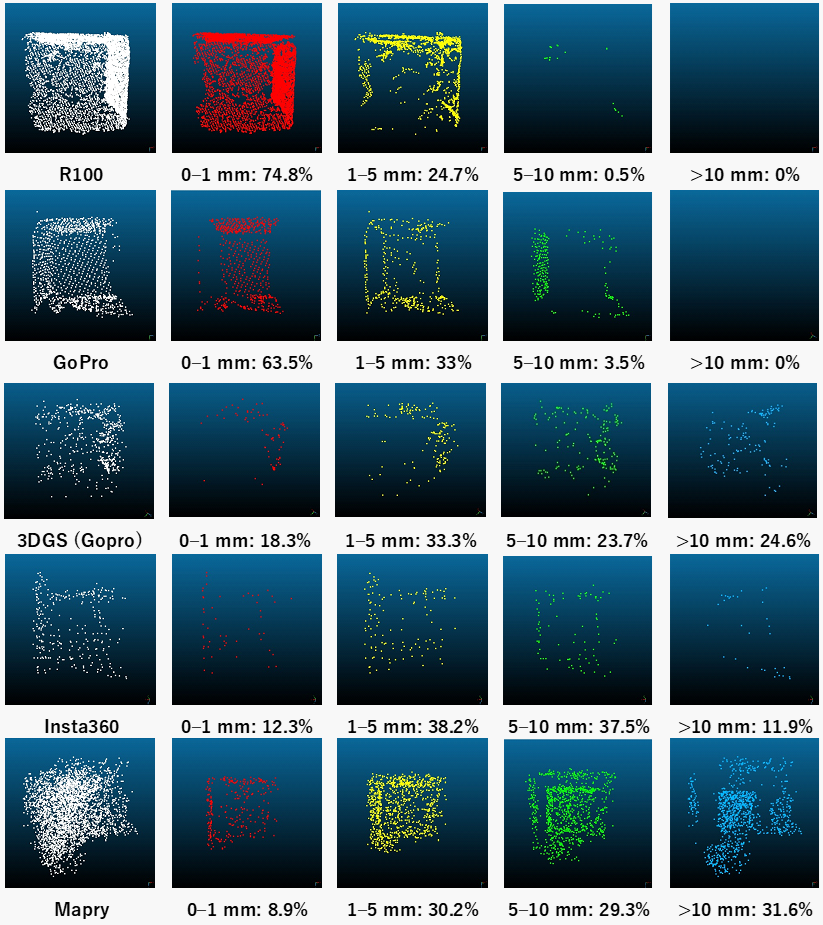
Fig. 5. Representative distribution of reconstruction error assessed using the C2M method for a selected cubic target.

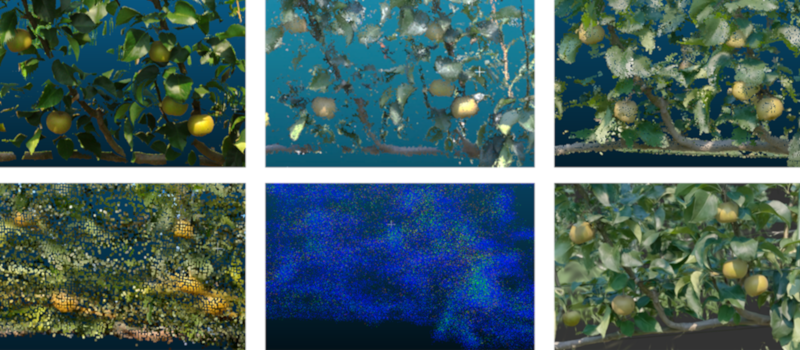
Fig. 6. Visual comparison of 3D representations generated using different sensing and reconstruction methods approaches. Top row: (a) FARO TLS, (b) SfM/MVS using Canon EOS R100, and (c) SfM/MVS using GoPro. Bottom row: (d) SfM/MVS using Insta360, (e) handheld LiDAR (Mapry), and (f) 3DGS reconstructed from GoPro images.
3.4. Reconstruction Error
Figure 6 presents representative orchard visualizations generated by various sensing and reconstruction approaches from the same viewpoint. The FARO point cloud exhibited the highest point density, facilitating detailed identification of both fruit and leaf shapes. The R100- and GoPro-based SfM/MVS reconstructions clearly represented fruit shapes, although the detailed geometry of individual leaves was comparatively less distinct than in the FARO reference. The Insta360-based SfM/MVS reconstruction enabled recognition of fruit positions through color information, but the point cloud itself was relatively low in detail. The Mapry point cloud was relatively sparse and lacked color information, making detailed recognition of fruits and leaves more challenging. In contrast, the GoPro-based 3DGS rendering allowed visual recognition of both fruit and leaf shapes, providing a visually rich and continuous representation.
Table 7. Data acquisition time and data volume in the row-scale survey.

Table 8. Location error in the row-scale survey.

4. Results of the Row-Scale Survey
4.1. Data Volume and Acquisition Time
In the row-scale survey, the data volume was largest for the Insta360, consistent with the span-scale survey results (Table 7). Conversely, the data volume of the R100 was approximately half of that of the Insta360, while the point counts obtained with the Mapry and LiGrip were extremely low, at less than \(1/100\) that of the Insta360.
The on-site acquisition time in the orchard was longest for the R100. Because the Mapry and LiGrip collected data by completing a single loop around the tree row, they required the shortest acquisition times. The Insta360 required approximately twice as long as the Mapry and LiGrip because data were acquired by completing two loops around the row. In terms of processing time, although the R100 generated the largest number of images, the SfM/MVS processing time was longest for the Insta360, resulting in a total processing time approximately 1 h longer than that of the other approaches.
In the row-scale survey, the TLS used as the reference was obtained by conducting 19 scans along the row, and the registration error among these scans was 7.9 mm on average, with a maximum error of 14.9 mm recorded.
4.2. Location Error
In the row-scale survey, the Mapry exhibited the largest location error, approximately twice that of the LiGrip (Table 8), with notably large deviations in the \(X\)-direction corresponding to the row orientation. The R100 showed a relatively low location error of approximately 30 mm, with errors remaining within 20 mm for the \(X\)-, \(Y\)-, and \(Z\)-directions, suggesting high positional accuracy. The Insta360 exhibited a location error approximately twice that of the R100; consistent with findings from the span-scale survey, errors in the \(Z\)-direction were relatively large.
Moreover, because instances of data acquisition failure due to SLAM instability were identified for the Mapry, multiple measurement trials were performed for the row-scale survey. Although row-scale data were also collected using the GoPro, 3D reconstruction in Metashape partially failed to complete.
5. Discussion
5.1. Overall Comparison of 3D Measurement Methods
Under outdoor and unstructured conditions in a large-scale orchard, this study provides a comparative evaluation of 3D measurement methods based on handheld LiDAR, SfM/MVS, and 3DGS using TLS as the reference framework. The methods were evaluated in terms of acquisition time, data volume, and measurement accuracy (Table 9). Although row-scale data were also collected using the GoPro, 3D reconstruction in Metashape was only partially achieved, likely due to insufficient sidelap; the short shooting distance likely restricted the ability to maintain adequate sidelap during wide-area acquisition.
From the viewpoint of the target accuracies defined in the Introduction, image-based methods using digital cameras were more suitable for fine-scale phenotyping, such as fruit size estimation, whereas other methods were more suitable for structural characterization and wide-area mapping applications. Moreover, the positional errors observed in this study were not isotropic, and the dominant error direction varied depending on the method.
Table 9. Summary of the 3D data characteristics for each device.

5.2. Characteristics of TLS
TLS can consistently acquire dense 3D point clouds and has therefore been extensively used for fruit-tree phenotyping, including canopy geometry characterization and branch-structure extraction 29,30,31. In this study, TLS was employed as the reference baseline; thus, we did not evaluate the location error of TLS itself. Nevertheless, TLS provided the densest point clouds with the highest geometric fidelity, and previous studies likewise commonly adopted TLS as ground truth for validating other sensing and reconstruction methods 32,33. Although TLS required considerably longer acquisition time, scan registration was performed automatically, enabling us to obtain the dataset without any manual intervention. In contrast, TLS often requires multi-station scanning, leading to extended field time and limiting high-frequency, large-area operation in large-scale orchards. Even so, because TLS point clouds are robust and less prone to reconstruction failures, TLS is valuable as high-quality base data for digital-twin and virtualized (e.g., VR-style) applications, and its practical utility in the field could further improve as data acquisition processes become more automated.
5.3. Comparison of Handheld LiDAR Devices
The comparison between the low-cost handheld LiDAR (Mapry) and the high-end performance device (LiGrip) revealed distinct differences in the characteristics of location error and reconstruction error. For the Mapry, the location error was approximately 40 mm in the span-scale survey and surpassed 100 mm in the row-scale survey. In the present study, the dominant deviation was observed primarily in the depth direction relative to the acquisition trajectory. This indicates that the positional instability was not necessarily a fixed bias toward a specific global coordinate axis but instead represented cumulative SLAM drift along a weakly constrained direction during continuous mapping. Moreover, the complex arrangement of branches, leaves, and fruits may have made it difficult to stably capture depth information, thereby further contributing to the direction-dependent error. In contrast, the LiGrip supports GNSS-based post-processing and exhibits comparatively smaller location error than the Mapry, indicating enhanced positional stability even in row-structured environments. Previous studies have reported that repetitive row environments, such as orchards and vineyards, are susceptible to LiDAR localization instability due to perceptual aliasing and accumulated LiDAR odometry drift 34,35. The LiGrip, which can incorporate GNSS post-processing, is expected to alleviate these effects, consistent with the reduced positional error observed in wide-area continuous mapping during the growing season.
For growing-season phenotyping (e.g., fruit detection and the extraction of detailed traits, including fruit diameter and branch diameters), the Mapry is limited not only by location and reconstruction errors but also—similarly to the LiGrip—by dense and occluded point clouds resulting from the coexistence of branches, leaves, and fruits. Consequently, it is difficult to reliably extract these traits using 3D point clouds alone. This limitation is consistent with previous forestry studies reporting that low-cost LiDAR often demonstrates lower geometric accuracy than high-precision LiDAR or TLS 36,37. Therefore, when using the Mapry for wide-area surveys during the growing season, cumulative errors are likely to increase if data are acquired in a single run; dividing the orchard into smaller sections and acquiring data in multiple passes is thus recommended. Conversely, during the dormant season, occlusion by leaves and fruits is substantially reduced, enhancing visibility and potentially reducing localization difficulty in row-structured environments. Therefore, when the primary objective is to capture spatial relationships, including branch arrangement and branch length, low-cost measurements using the Mapry can be practical—within the range of location errors observed in this study—while leveraging its high acquisition efficiency. However, for wide-area surveys performed during the growing season, the Mapry is more susceptible to acquisition failure and increased error; in such cases, the adoption of the LiGrip, which provides greater positional stability, is expected to enable more reliable operation.
5.4. Comparison of Image-Based Methods
In SfM/MVS processing using the Canon EOS R100, the theoretical resolution closely aligned with the measured accuracy, and millimeter-scale shape accuracy was confirmed in both the span-scale and row-scale surveys. This performance can be largely attributed to the high-resolution sensor, adequate image overlap, and stable acquisition conditions. These results are consistent with previous studies, demonstrating that SfM/MVS can achieve high geometric accuracy when data are acquired under appropriate conditions 38. Accordingly, SfM/MVS with the R100 is highly appropriate for detailed phenotyping, including quantitative measurement of fruit diameter and branch diameters. The R100-based SfM/MVS attained the practical target accuracy for fruit size estimation (approximately 5 mm), with a mean reconstruction error of 1.20 mm and 97.0% of the points falling within a 5 mm error range (Table 6). However, its applicability to continuous operation in large-scale orchard surveys is limited by the substantial burden of acquisition and processing time, as well as the considerable data volumes generated.
Conversely, the 360° camera (Insta360) enables high image overlap through omnidirectional capture, leading to minimal reconstruction failures in SfM/MVS and providing high stability and efficiency in data acquisition. In the row-scale survey, the location error was approximately 60 mm, which is sufficient for applications such as analyzing the spatial distribution of fruits and branches. However, compared with the R100, the resulting point cloud contained fewer points, and a reduction in point density relative to the theoretical resolution was observed. This reduction is likely attributable to geometric characteristics intrinsic to 360° imagery. Spherical images are typically converted to planar representations using projections such as equirectangular projection; during this conversion, pixel density becomes spatially non-uniform and geometric distortion is amplified, particularly along the vertical (\(Z\)) direction 39. Additionally, multi-lens 360° cameras such as the Insta360 often exhibit local geometric inconsistencies near lens-stitching boundaries, which can suppress feature matching in SfM and reduce the generation of reliable high-confidence points in MVS 40. The relatively large \(Z\)-direction positional error observed in both the span-scale and row-scale surveys is largely consistent with these characteristics. In addition, this trend may have been influenced by the acquisition configuration, such as camera height and trajectory. Consequently, despite omnidirectional capture, low-confidence points may be filtered out during 3D reconstruction, resulting in a lower-density point cloud. Similar limitations have been reported in TLS-referenced comparative studies, suggesting that point clouds derived from 360° panoramic images tend to be inferior to those generated using SfM/MVS based on perspective-projection images in terms of point density and local shape reproducibility 41. Consistent with this tendency, the Insta360-based SfM/MVS yielded a mean reconstruction error close to the practical threshold (4.81 mm), but 46.8% of the points exceeded the 5 mm error, indicating reduced suitability for precise fruit size estimation (Table 6).
5.5. Characteristics of 3DGS
As discussed previously, 3DGS is primarily designed for visual rendering rather than explicit geometric reconstruction, and this characteristic should be considered when interpreting its quantitative accuracy. In the current study, 3DGS generated from GoPro data exhibited greater location and reconstruction errors than SfM/MVS. This difference is likely because SfM/MVS performs geometric reconstruction based on an explicit camera model and defined resolution, whereas 3DGS is optimized for rendering quality; thus, the placement and density of Gaussians do not necessarily preserve geometric accuracy in real space. Similar tendencies have been reported in TLS-referenced studies, demonstrating that while SfM/MVS achieves higher geometric accuracy, 3DGS provides superior visual quality but tends to yield larger quantitative discrepancies, including increased C2M distance 42. As shown in Fig. 6, the 3DGS representation provided a more visually continuous depiction of fruits and leaves than the point-cloud-based representations, although its quantitative geometric accuracy remained lower than that of SfM/MVS. This visual continuity is beneficial for intuitive interpretation of orchard structure and fruit distribution. Moreover, learning-based 3D reconstruction methods, including 3DGS, are sensitive to occlusions and texture complexity 43. In the present study, the dominant positional deviation of 3DGS was observed primarily in the depth direction relative to image acquisition. In orchard environments where leaves, branches, and fruits are densely intermingled, the complex textures and overlap may have hindered stable depth estimation, thereby contributing to the larger depth-direction error. Conversely, because 3DGS offers high-quality rendering and high viewpoint control, it is well-suited for visualization tasks such as intuitively interpreting overall orchard structure and fruit distribution 44. In plant phenotyping research, it has also been suggested that 3DGS and related representations should be employed in conjunction with geometry-based methods when quantitative measurements are required 45.
5.6. Applicability to Other Orchard Conditions
Because this study was conducted in a Japanese pear orchard trained under a joint V-trellis system with a regular row structure, the findings should be interpreted within this specific experimental context. Nevertheless, in orchards with similar continuous row structures and practical row spacing for management operations and vehicle movement, the overall trends observed for each measurement method are expected to be generally applicable. When canopy architecture, occlusion conditions, or terrain vary substantially, scanning performance and accuracy may differ accordingly, and additional validation would be required before direct application of the present findings. In addition, the present evaluation was conducted using a cubic target, which was selected because it allowed a straightforward definition of positional error and stable placement under outdoor orchard conditions. However, major orchard objects such as fruits differ in shape and are generally closer to spherical forms than to cubes. Therefore, the error characteristics obtained in this study may not fully represent those for fruit-like objects, because object geometry and surface characteristics can affect reconstruction behavior and local error distributions 45,46. Future validation using spherical targets should therefore be conducted.
5.7. Future Prospects for Orchard Sensing
From an operational standpoint, replacing operator-carried measurements with robotic patrols is being explored to reduce field labor requirements. For instance, spot equipped with LiDAR has been tested for autonomous sensing in an olive orchard 47. In addition, spot-mounted TLS has also been evaluated for robot-assisted scanning 48, suggesting a viable pathway toward automated and repeatable data acquisition.
6. Conclusions
This study compared LiDAR-, SfM/MVS-, and 3DGS-based 3D measurement techniques in a large-scale Japanese pear orchard trained under a joint V-trellis system, assessing their acquisition efficiency, positional and geometric accuracy, and suitability for various applications. The results revealed clear differences among methods in terms of practical applicability for orchard phenotyping.
For LiDAR-based measurements, both Mapry and LiGrip were effective for rapid, wide-area acquisition; however, LiGrip provided greater positional stability, while Mapry was more suitable under lower-occlusion conditions, such as during the dormant season.
For image-based reconstruction, the Canon EOS R100 was most suitable for detailed phenotyping requiring high geometric accuracy, whereas the Insta360 was more practical for efficient large-scale structural characterization.
GoPro-based 3DGS was less suitable for quantitative analysis but effective for the visualization of orchard structure and fruit distribution.
Overall, 3D phenotyping in large-scale orchards should rely on the selective, complementary integration of LiDAR, SfM/MVS, and 3DGS, depending on measurement objectives and seasonal conditions.
Acknowledgments
We thank Dr. Hayashi (National Agriculture and Food Research Organization, NARO) for assistance with 3DGS reconstruction and data processing, and Mr. Yamaguchi (NARO) for support during field investigations. We also thank the staff of Farmind Ibaraki Orchard for granting access to the orchard and for their support during data acquisition.
- [1] S. A. Bound, “Crop load management in nashi pear—A review,” Horticulturae, Vol.8, No.10, Article No.923, 2022. https://doi.org/10.3390/horticulturae8100923
- [2] J. E. Kim et al., “A pruning criterion for dormant ‘Niitaka’ pear trees that uses a decision tree model based on the basal diameter of bearing branches,” Horticultural Science and Technology, Vol.43, No.6, pp. 673-684, 2025. https://doi.org/10.7235/HORT.20250059
- [3] Y. Huang, Z. Ren, D. Li, and X. Liu, “Phenotypic techniques and applications in fruit trees: A review,” Plant Methods, Vol.16, Article No.107, 2020. https://doi.org/10.1186/s13007-020-00649-7
- [4] T. L. Robinson, S. A. Hoying, and G. H. Reginato, “The tall spindle apple production system,” New York Fruit Quarterly, Vol.14, No.2, pp. 21-28, 2006.
- [5] K. Shibata, K. Koizumi, T. Seki, I. Kitao, and K. Matsushita, “A ‘joint tree’ training system enables early returns on Japanese pear orchards,” Acta Horticulturae, Vol.800, pp. 769-776, 2008. https://doi.org/10.17660/ActaHortic.2008.800.105
- [6] T. Seki, K. Hirose, and K. Shibata, “Yield and fruit quality of Japanese pear in ‘joint V-shaped trellis’,” Acta Horticulturae, Vol.1303, pp. 171-176, 2021. https://doi.org/10.17660/ActaHortic.2021.1303.25
- [7] T. Seki, K. Katayama, T. Soneda, and K. Shibata, “Productivity and labor saving effect of Japanese pear in ‘joint V-shaped trellis’,” Acta Horticulturae, Vol.1404, pp. 47-54, 2024. https://doi.org/10.17660/ActaHortic.2024.1404.7
- [8] Japan Fruit Association, “Report on the dissemination and adoption of labor-saving training systems in 2023,” 2024. https://www.japanfruit.jp/Portals/0/resources/JFF/kokunai/r05chosa_siryo/R5Shouryoku.pdf [Accessed March 9, 2026]
- [9] N. Yan et al., “Estimation of pear tree leaf area index using fused UAV multispectral and RGB imagery,” Smart Agricultural Technology, Vol.13, Article No.101717, 2026. https://doi.org/10.1016/j.atech.2025.101717
- [10] A. I. B. Parico and T. Ahamed, “Real time pear fruit detection and counting using YOLOv4 models and Deep SORT,” Sensors, Vol.21, No.14, Article No.4803, 2021. https://doi.org/10.3390/s21144803
- [11] K. Itakura, Y. Narita, S. Noaki, and F. Hosoi, “Automatic pear and apple detection by videos using deep learning and a Kalman filter,” OSA Continuum, Vol.4, No.5, pp. 1688-1695, 2021. https://doi.org/10.1364/OSAC.424583
- [12] B. Lavaquiol, R. Sanz, J. Llorens, J. Arnó, and A. Escolà, “A photogrammetry-based methodology to obtain accurate digital ground-truth of leafless fruit trees,” Computers and Electronics in Agriculture, Vol.191, Article No.106553, 2021. https://doi.org/10.1016/j.compag.2021.106553
- [13] H. F. Murcia, S. Tilaguy, and S. Ouazaa, “Development of a low-cost system for 3D orchard mapping integrating UGV and LiDAR,” Plants, Vol.10, No.12, Article No.2804, 2021. https://doi.org/10.3390/plants10122804
- [14] A. Hayashi, N. Kochi, K. Kodama, S. Isobe, and T. Tanabata, “CLCFM3: A 3D reconstruction algorithm based on photogrammetry for high-precision whole plant sensing using all-around images,” Sensors, Vol.25, No.18, Article No.5829, 2025. https://doi.org/10.3390/s25185829
- [15] J. Gené-Mola, R. Sanz-Cortiella, J. R. Rosell-Polo, A. Escolà, and E. Gregorio, “In-field apple size estimation using photogrammetry-derived 3D point clouds: Comparison of 4 different methods considering fruit occlusions,” Computers and Electronics in Agriculture, Vol.188, Article No.106343, 2021. https://doi.org/10.1016/j.compag.2021.106343
- [16] Q. Bing, R. Zhang, L. Zhang, L. Li, and L. Chen, “UAV-SfM photogrammetry for canopy characterization toward unmanned aerial spraying systems precision pesticide application in an orchard,” Drones, Vol.9, No.2, Article No.151, 2025. https://doi.org/10.3390/drones9020151
- [17] N. Kochi, S. Isobe, A. Hayashi, K. Kodama, and T. Tanabata, “Introduction of all-around 3D modeling methods for investigation of plants,” Int. J. Automation Technol., Vol.15, No.3, pp. 301-312, 2021. https://doi.org/10.20965/ijat.2021.p0301
- [18] B. Lavaquiol-Colell et al., “A methodology for the realistic assessment of 3D point clouds of fruit trees in full 3D context,” Computers and Electronics in Agriculture, Vol.232, Article No.110082, 2025. https://doi.org/10.1016/j.compag.2025.110082
- [19] B. Mildenhall et al., “NeRF: Representing scenes as neural radiance fields for view synthesis,” Proc. of the 16th European Conf. on Computer Vision, pp. 405-421, 2020. https://doi.org/10.1007/978-3-030-58452-8_24
- [20] B. Kerbl, G. Kopanas, T. Leimkuehler, and G. Drettakis, “3D Gaussian splatting for real-time radiance field rendering,” ACM Trans. on Graphics, Vol.42, No.4, Article No.139, 2023. https://doi.org/10.1145/3592433
- [21] M. Li et al., “Apple fruit diameter and length estimation by using the thermal and sunshine hours approach and its application to the digital orchard management information system,” PLOS ONE, Vol.10, No.4, Article No.e0120124, 2015. https://doi.org/10.1371/journal.pone.0120124
- [22] Z. Su et al., “Design of an autonomous orchard navigation system based on multi-sensor fusion,” Agronomy, Vol.14, No.12, Article No.2825, 2024. https://doi.org/10.3390/agronomy14122825
- [23] D. Tiozzo Fasiolo, L. Scalera, E. Maset, and A. Gasparetto, “Towards autonomous mapping in agriculture: A review of supportive technologies for ground robotics,” Robotics and Autonomous Systems, Vol.169, Article No.104514, 2023. https://doi.org/10.1016/j.robot.2023.104514
- [24] S. Rusinkiewicz and M. Levoy, “Efficient variants of the ICP algorithm,” Proc. 3rd Int. Conf. on 3-D Digital Imaging and Modeling, pp. 145-152, 2001. https://doi.org/10.1109/IM.2001.924423
- [25] P. Cignoni, C. Rocchini, and R. Scopigno, “Metro: Measuring error on simplified surfaces,” Computer Graphics Forum, Vol.17, No.2, pp. 167-174, 1998. https://doi.org/10.1111/1467-8659.00236
- [26] N. Aspert, D. Santa-Cruz, and T. Ebrahimi, “MESH: Measuring errors between surfaces using the Hausdorff distance,” Proc. of 2002 IEEE Int. Conf. on Multimedia and Expo, Vol.1, pp. 705-708, 2002. https://doi.org/10.1109/ICME.2002.1035879
- [27] M. Ingman, J.-P. Virtanen, M. T. Vaaja, and H. Hyyppä, “A comparison of low-cost sensor systems in automatic cloud-based indoor 3D modeling,” Remote Sensing, Vol.12, No.16, Article No.2624, 2020. https://doi.org/10.3390/rs12162624
- [28] N. Kochi, T. Tanabata, A. Hayashi, and S. Isobe, “A 3D shape-measuring system for assessing strawberry fruits,” Int. J. Automation Technol., Vol.12, No.3, pp. 395-404, 2018. https://doi.org/10.20965/ijat.2018.p0395
- [29] J. Li et al., “Structural parameter determination and pruning pattern analysis of pear tree shoots for dormant pruning,” Plant Phenomics, Vol.7, No.4, Article No.100136, 2025. https://doi.org/10.1016/j.plaphe.2025.100136
- [30] T. Kawai et al., “Estimation of the amount of pruning in peach using 3D point cloud data,” Horticultural Research (Japan) Supplement, Vol.23, No.1, p. 69, 2024 (in Japanese).
- [31] J. Lee, E. Morimoto, K. Nonami, A. Tanino, and T. Yamaguchi, “Development of tree vigor evaluation method for Japanese pear by 3D point cloud data,” J. of Japanese Society of Agricultural Technology Management, Vol.29, No.2, pp. 41-46, 2022 (in Japanese).
- [32] C. Zhang et al., “Apple tree branch information extraction from terrestrial laser scanning and backpack-LiDAR,” Remote Sensing, Vol.12, No.21, Article No.3592, 2020. https://doi.org/10.3390/rs12213592
- [33] L. Ferreira et al., “Comparative analysis of TLS and UAV sensors for estimation of grapevine geometric parameters,” Sensors, Vol.24, No.16, Article No.5183, 2024. https://doi.org/10.3390/s24165183
- [34] R. de Silva et al., “Semantic-aware particle filter for reliable vineyard robot localisation,” arXiv:2509.18342, 2025. https://doi.org/10.48550/arXiv.2509.18342
- [35] Y. Li, Q. Feng, C. Ji, J. Sun, and Y. Sun, “GNSS and LiDAR integrated navigation method in orchards with intermittent GNSS dropout,” Applied Sciences, Vol.14, No.8, Article No.3231, 2024. https://doi.org/10.3390/app14083231
- [36] M. Hrdina et al., “Obtaining the highest quality from a low-cost mobile scanner: A comparison of several pipelines with a new scanning device,” Remote Sensing, Vol.17, No.15, Article No.2564, 2025. https://doi.org/10.3390/rs17152564
- [37] M. Balestra et al., “Advancing forest inventory: A comparative study of low-cost MLS lidar device with professional laser scanners,” The Int. Archives of the Photogrammetry, Remote Sensing and Spatial Information Sciences, Vol.XLVIII-2/W8-2024, pp. 9-15, 2024. https://doi.org/10.5194/isprs-archives-XLVIII-2-W8-2024-9-2024
- [38] M. R. James and S. Robson, “Straightforward reconstruction of 3D surfaces and topography with a camera: Accuracy and geoscience application,” J. of Geophysical Research: Earth Surface, Vol.117, No.F3, Article No.F03017, 2012. https://doi.org/10.1029/2011JF002289
- [39] S. Jiang, K. You, Y. Li, D. Weng, and W. Chen, “3D reconstruction of spherical images: A review of techniques, applications, and prospects,” Geo-spatial Information Science, Vol.27, No.6, pp. 1959-1988, 2024. https://doi.org/10.1080/10095020.2024.2313328
- [40] G. Kafataris, D. Skarlatos, M. Vlachos, and A. Agapiou, “Investigating the accuracy of a 360° camera for 3D modeling in confined spaces: 360° panorama vs 25-rig compared to TLS,” ISPRS Annals of the Photogrammetry, Remote Sensing and Spatial Information Sciences, Vol.X-M-2-2025, pp. 139-146, 2025. https://doi.org/10.5194/isprs-annals-X-M-2-2025-139-2025
- [41] I. Petrovska and B. Jutzi, “3D Gaussian splatting methods for real-world scenarios,” ISPRS Annals of the Photogrammetry, Remote Sensing and Spatial Information Sciences, Vol.X-G-2025, pp. 641-648, 2025. https://doi.org/10.5194/isprs-annals-X-G-2025-641-2025
- [42] I. Petrovska and B. Jutzi, “Impact of rain on 3D reconstruction with multi-view stereo, neural radiance fields and Gaussian splatting,” ISPRS Annals of the photogrammetry, remote sensing and spatial information sciences, Vol.X-4/W6-2025, pp. 169-176, 2025. https://doi.org/10.5194/isprs-annals-X-4-W6-2025-169-2025
- [43] F. Li et al., “CountingFruit: Language-guided 3D fruit counting with semantic Gaussian splatting,” arXiv:2506.01109, 2025. https://doi.org/10.48550/arXiv.2506.01109
- [44] J. Li et al., “A survey on 3D reconstruction techniques in plant phenotyping: From classical methods to Neural Radiance Fields (NeRF), 3D Gaussian Splatting (3DGS), and beyond,” Plant Phenomics, Vol.7, No.4, Article No.100137, 2025. https://doi.org/10.1016/j.plaphe.2025.100137
- [45] P. Tang, B. Akinci, and D. Huber, “Quantification of edge loss of laser scanned data at spatial discontinuities,” Automation in Construction. Vol.18, No.8, pp. 1070-1083, 2009. https://doi.org/10.1016/j.autcon.2009.07.001
- [46] M. S. Nielsen, I. Nikolov, E. K. Kruse, J. Garnæs, and C. B. Madsen, “Quantifying the influence of surface texture and shape on structure from motion 3D reconstructions,” Sensors. Vol.23, No.1, Article No.178, 2023. https://doi.org/10.3390/s23010178
- [47] J. Torres-Sánchez et al., “Configuration and specifications of an autonomous quadruped robot with an embedded LiDAR sensor for characterizing woody crop canopies,” Precision Agriculture ’25 (Proc. of the 15th European Conf. on Precision Agriculture), pp. 481-487, 2025. https://doi.org/10.1163/9789004725232_062
- [48] E. Wetzel, J. Liu, T. Leathem, and A. Sattineni, “The use of Boston Dynamics SPOT in support of LiDAR scanning on active construction sites,” Proc. of the 39th ISARC, pp. 86-92, 2022. https://doi.org/10.22260/ISARC2022/0014
This article is published under a Creative Commons Attribution-NoDerivatives 4.0 Internationa License.