
Paper:
Development of Invisible QR Code Using Watermarking Technology
Souma Kawanishi and Kazuyoshi Wada

Graduate School of Systems Design, Tokyo Metropolitan University
6-6 Asahigaoka, Hino, Tokyo 191-0065, Japan

The decline in the working population due to falling birth rates and an aging population is a pressing issue. Convenience stores, in particular, have become part of the social infrastructure; however, their operations are diverse, and labor shortages are becoming increasingly acute. Therefore, automating display operations is necessary to reduce workloads. However, existing methods pose several challenges, such as loss of visual appeal and the high costs associated with developing deep learning models. This study focuses on information-hiding technology and proposes an invisible QR code that embeds information into product packaging in an imperceptible manner. Because it is invisible, it does not detract from the package’s appearance and can be detected by image processing, thereby eliminating computational learning costs. In this study, we evaluated the proposed method through experiments on image quality degradation, recognition accuracy, and the position and orientation estimation accuracy of the invisible QR codes.
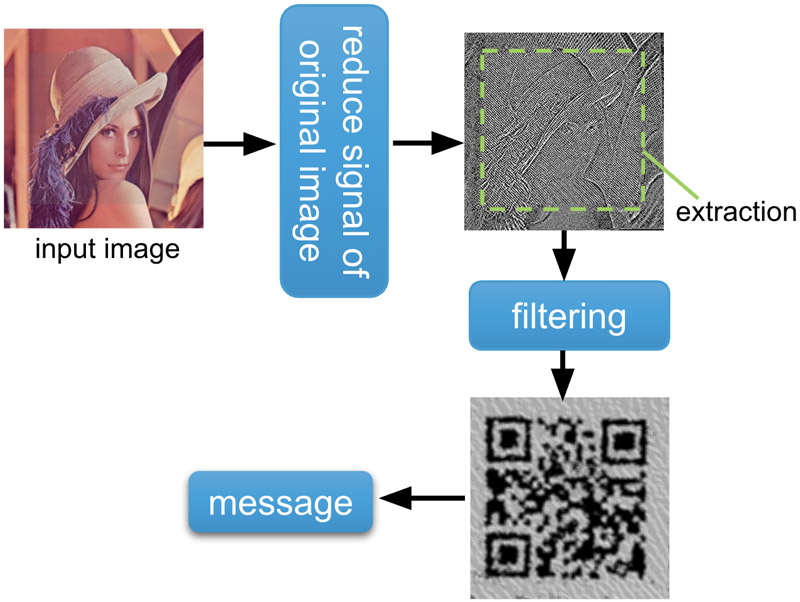
Decoding flow of invisible QR codes
1. Introduction
Japan is currently facing a declining birthrate and an aging population, and the resultant shrinking workforce is becoming a significant issue 1. Convenience stores, in particular, are facing a serious labor shortage due to a wide variety of tasks such as accounting and cleaning. Therefore, to alleviate the labor shortage, the automation of one of the most time-consuming tasks 2, displaying, is required, and several research institutes are working on automating this task. The first approach involves attaching two-dimensional codes 3, such as ArUco markers, to products. These markers allow for position and orientation estimation from 2D camera images. By identifying the type and surface of the product from the marker and converting it to a reference posture, it is possible to obtain the necessary information to pick up and handle the product 4,5,6,7. However, ArUco markers feature four grid sizes, from \(4 \times 4\) to \(7 \times 7\), and the maximum number of markers that can be created for each grid size is 1,000. Therefore, the maximum number of products that can be identified with ArUco markers is 4,000, which is insufficient for the 3,300 products typically available per convenience store a, especially when taking into account the identification of expiration dates. Another approach is product recognition using deep learning, which identifies products by using training data for each product package to create a specific model for each product 8. However, in addition to the 3,300 products per convenience store, convenience stores are unique in that they frequently develop new products to increase sales. Therefore, the training data for product packages must be frequently updated, and the training models must be re-created, which is both costly and time-consuming 9.
To address the limitations of existing methods, it is necessary to embed the information required for display operations into packaging in a manner that is imperceptible to humans. Therefore, this study focuses on information hiding technology, which is a generic term for techniques that embed information into a medium, such as an image or other content, while remaining imperceptible to humans. Numerous studies have explored applications including content protection, security, and secret-information transmission 10. However, existing information-hiding techniques cannot accommodate the large volume of data or the position and orientation information necessary for display operations. Therefore, the purpose of this study is to develop a method for visually embedding and detecting three types of information (text, position, and orientation) on packaging to enable its use in product recognition for automated displays.
The remainder of this study is organized as follows. Section 2 reviews related work and case studies. Section 3 describes the embedding, detection, and pose estimation methods. In Section 4, we evaluate the proposed method in terms of image quality degradation, recognition accuracy, and pose-estimation accuracy. Finally, Section 5 presents the conclusions of this study and outlines future work.
2. Related Work
In this section, we present related research on information-hiding techniques. Embedding methods for watermarked images are generally classified into two domains: spatial and frequency. Spatial-domain embedding involves directly manipulating the pixel values of an image. Conversely, frequency-domain embedding utilizes transforms such as the discrete cosine transform, discrete Fourier transform, and discrete wavelet transform. Compared with spatial-domain techniques, frequency-domain methods embed information in a way that is more imperceptible to humans. However, frequency-domain embedding is primarily applicable to electronic files and is typically used to prevent image reproduction, replacement, and malicious attacks. Therefore, it is difficult to apply this method to printed watermarked images. Additionally, research specifically focused on watermarking printed images remains limited 11,12.
Because spatial-domain embedding directly modifies pixel values, robustness for detection in diverse environments, imperceptibility to humans, and a high capacity for embeddable information are important. Kim et al. 13 proposed a method for capturing printed images and extracting 64-bit embedded ID information from recurrent tiling patterns. This method leverages the human visual system for coding, emphasizes luminance, and embeds a 64-bit code as a watermark in the form of a rectangular tiling pattern. During detection, the signal is estimated by finding frequency peaks based on an autocorrelation function, compensating for image scaling and rotation, and applying a Wiener filter to the image. However, the volume of information that can be embedded is limited to 64-bits, which constrains its practical application.
Pramila et al. 12,14 also proposed a watermarking method based on autocorrelation and directed periodic patterns. This method calculates embedding intensity using the just noticeable difference to ensure the watermark remains invisible to the naked eye but detectable by a camera. The resulting pseudo-random 2D pattern is then binarized, and the Hamming-coded message is matched to the 4-bit information and rotated. Essentially, four bits of information are represented by each angle of rotation. An autocorrelation function is then computed on this watermark to determine the pattern peaks; subsequently, lines are detected by binarizing the peaks, forming a grid, and performing a Hough transform. The 4-bit information is then extracted by determining the rotation angles of these lines. The method is designed to be robust to lateral camera rotation, as it can compensate for this using an autocorrelation function. Although this method achieves invisibility with a high embedding rate, it presents significant challenges: it requires precise camera positioning to align nine segmented blocks within the shooting range and cannot accommodate more than 36 bits of information.
Nakamura et al. 15,16 proposed a watermarking scheme in which data are converted into a sine wave and a 2D pattern is superimposed onto an image. The 2D pattern is generated by mapping error-detection-encoded binary data to a 2D sine curve \(P^{-}=\{P^{-}_{x,y}\}\), \(P^{+}=\{P^{+}_{x,y}\}\) subjected to a 90° rotation whose frequencies are \((\mathrm{Freq}, \mathrm{Freq})\) and \((\mathrm{Freq}, -\mathrm{Freq})\) relative to the content image size. Watermarking is implemented by amplifying the amplitude of the pattern \(P\) using the embedding strength \(\alpha\) and adding it to the content image. Regarding the decoding method, the absolute sum of all elements in a block of pixel values raster-scanned into an image with edge enhancement and the application of two convolution operators is considered as the frequency energy. This method facilitates synchronization recovery. Although this method offers the advantage of rapid and accurate watermark detection provided that synchronization recovery is successful, it is limited by the fact that watermark detection becomes difficult if synchronization recovery fails. Synchronization recovery refers to the calibration to cope with the geometric distortion, movement, and rotation that occur during camera image acquisition [17–19, b].
3. Proposed Method “Invisible QR Code”
3.1. Proposal Summary
As mentioned above, the existing information hiding techniques listed in the related research have the disadvantages of requiring a camera to be positioned in close proximity to the medium. Furthermore they offer limited data capacity owing to the subtle nature of the embedding method. To address these limitations, this study proposes a method for significant volumes of information by utilizing QR codes as watermarks in images and leveraging their inherent error-correction capabilities. The embedding, detection, and the position- and orientation-estimation methods are described below.
3.2. Embedding Method
The embedding method follows the approach described by Nakamura et al. 15,16, with the modification that the binary code is replaced with a QR code (Fig. 1). The embedding process is presented as follows. First, the text data to be embedded was converted into a QR code. A QR code consists of a two-dimensional matrix of black and white cells representing binary code 1 and 0, respectively. In this method, binaries 1 and 0 in the QR code are mapped to a 2D sine curve \(p^{+}=\{p^{+}_{x,y}\}\), the frequency of which is \((\mathrm{Freq}, \mathrm{Freq})\), and its 90°-rotated counterpart \(p^{-}=\{p^{-}_{x,y}\}\) of \((\mathrm{Freq}, -\mathrm{Freq})\). Thus, a QR code composed of sine-wave patterns was generated. For this study, the QR codes were created with a spatial frequency of 64 Hz. This resulting structure is referred to as a “sine curve pattern.” The sine-curve pattern is imperceptibly embedded into an arbitrary rectangular region of the content image using an embedding strength \(\alpha\), as in Eq. (1).
The operation in Eq. (1) is applied independently to each RGB channel.
3.3. Detection Method
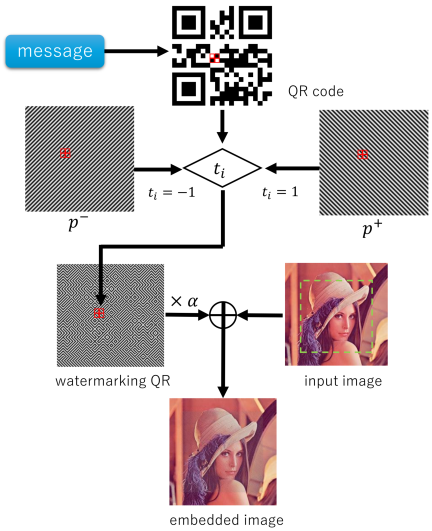
Fig. 1. Flowchart for embedding the invisible QR code.
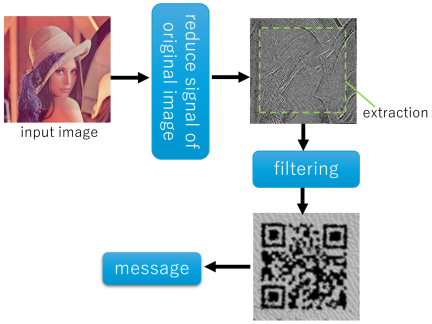
Fig. 2. Flowchart of invisible marker detection.
Although invisible QR codes are difficult for the human eye to detect, they can be reconstructed through image processing. Fig. 2 shows a flowchart of the detection method. First, a printed invisible QR code is captured by an RGB camera, or an electronic image file of an invisible QR code is loaded. The invisible QR code comprises a pair of orthogonal sine curves. Therefore, after the image is converted to grayscale, an image filter is applied to emphasize the edges (Eq. (2)), and the pixel values are binarized into positive and negative values to highlight the sine-curve pattern and attenuate the background content image.
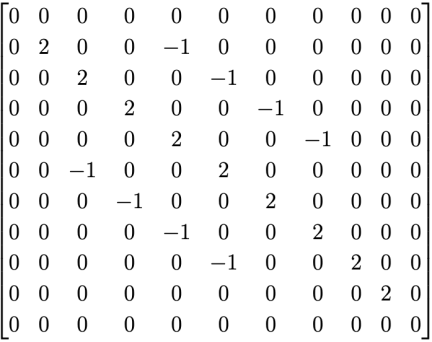
Fig. 3. The original filter matrix.
The watermarked area is then extracted from the image containing the attenuated content. The binarized invisible QR code exhibits a characteristic sinusoidal pattern. This feature is trained using YOLOv8 c segmentation to estimate the watermarked area. The detected region is then contoured into a rectangle, and a projective transformation is performed. This supports robust decoding even for the images captured at an oblique angle. A custom filter, shown in Fig. 3, is then applied to the projectively transformed square image. This filtering process emphasizes \(P^+\) corresponding to binary 1. This filter was selected by the authors as the most accurate one, featuring the ability to enhance and attenuate the diagonal component, that is, the sine curve. The filtered image is shown in Fig. 4(a). Subsequently, horizontal and a vertical Roberts filters are applied to the \(3\times3\) kernel 20, and the gradient magnitude (the square root of the sum of the squares of each component) is obtained. The results are presented in Fig. 4(b). Finally, the image is binarized, and an averaging filter is applied to remove noise. The invisible QR code decoded by this process is shown in Fig. 4(c).
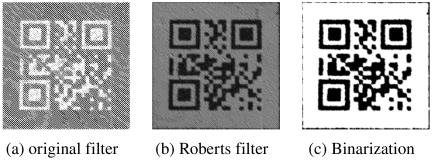
Fig. 4. QR code recovery.
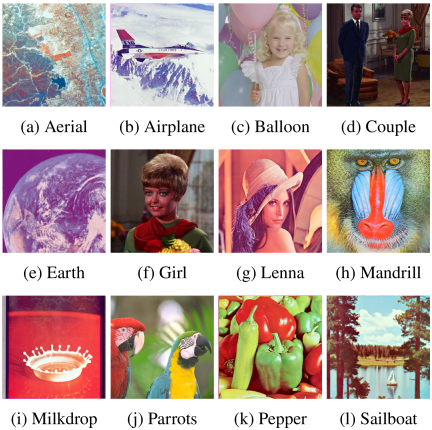
Fig. 5. Image before watermark embedding d.
3.4. Position and Orientation Estimation Method
Finally, the estimation of position and orientation is described. First, coordinates for the four corners of the invisible QR code are obtained by approximating the quadrilateral watermarked area by segmentation. The perspective-n-point (PnP) algorithm is then applied to the coordinates of these four corners to obtain the translation and rotation vectors 21,22,23,24.
However, even following a projective transformation of the watermarked area, the yaw angle cannot be corrected when the vertical direction is defined as the \(Z\)-axis relative to the printed. Therefore, in addition to applying the PnP algorithm to the segmentation area, the rotation angle of the QR code, which can be detected by applying image filter processing, was used to estimate the correct angular information.
4. Evaluation Experiment
4.1. Method
In this section, we describe the evaluation of invisible QR codes through three primary experiments: image quality, recognition accuracy, and position- and orientation-estimation accuracy. The target images used for embedding the invisible QR code in the image quality evaluation and recognition accuracy experiments are shown in Fig. 5. To ensure valid performance comparisons, we selected standard images commonly used in image-processing literature; their names are defined in the respective captions of Fig. 5. For these targets, the watermark was embedded across the entire image and printed on \(100\times100\) mm paper. Experiments were conducted using two embedding strengths (\(\alpha = 0.1\) and 0.2) and two encoding contents (48 bits and 400 bits) as defined in Eq. (1), with 50 trials performed for each parameter set. Fig. 6 shows a standard QR code prior to its conversion into an invisible QR code. Finally, for the position- and orientation-estimation experiments, only the “Balloon” image was used as the target with an embedding strength of 0.2, as this estimation process is independent of the image content. Fig. 7 displays a 400-bit invisible QR code embedded with \(\alpha = 0.1\) and 0.2.
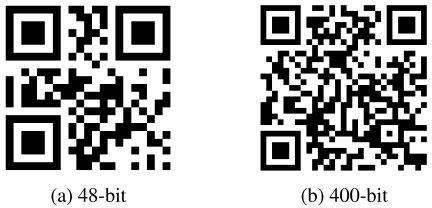
Fig. 6. Standard QR code.
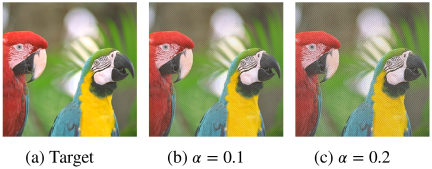
Fig. 7. Example of 400-bit invisible QR code. \(\alpha\) refers to \(\alpha\) in Eq. (1).
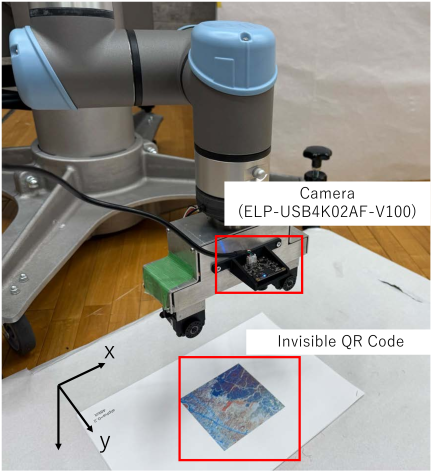
Fig. 8. Photographs taken during the experiment. The roll, pitch, and yaw angles are centered on the \(X\)-, \(Y\)-, and \(Z\)-axes, respectively. The coordinate origin is the center of the invisible QR code.
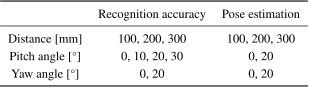
Next, we describe the camera specifications and the image-acquisition process. The resolution of the camera (SONY ELP-USB4K02AF-V100) e was set to Full HD (\(\textrm{1,920} \times \textrm{1,080}\)). The experimental setup, including the coordinate axis configuration, is shown in Fig. 8. Rotations around the \(X\)-, \(Y\)-, and \(Z\)-axes are defined as the roll, pitch, and yaw angles, respectively. The distance (hereafter referred to as “shooting distance”) and the angle (hereafter referred to as “shooting angle”) between the camera and the printed paper surface are adjusted using a robotic arm with the camera mounted at its end. The shooting distances and angles for each experiment are summarized in Table 1.
Table 1. Shooting distance and angle for each experiment.
Finally, we describe the development of the YOLOv8-based segmentation model used to estimate the watermarked regions. To create the model, we utilized the following configuration parameters:
-
Training sets: 437
-
Validation sets: 49
-
Image size: 960
-
Epoch: max 100
-
Number of batch: 4
-
Learning rate: 0.01
4.2. Image Quality Evaluation
An image quality evaluation experiment was conducted to determine the extent of image degradation following watermark embedding. We utilized the structural similarity index measure (SSIM) as an indicator 25. SSIM is based on the assumption that structural information is highly correlated with human perception; consequently, it effectively quantifies image quality degradation in a manner consistent with human visual characteristics.
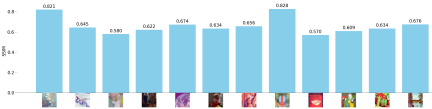
Fig. 9. SSIM at \(\alpha=0.1\).
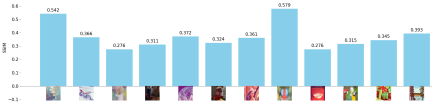
Fig. 10. SSIM at \(\alpha=0.2\).
Each invisible QR code was read from an electronic file to calculate the SSIM. As shown in Figs. 9 and 10 the average SSIM values were 0.66 for \(\alpha = 0.1\) and 0.37 for \(\alpha = 0.2\). The results confirm that the SSIM is primarily determined by the target image content and the embedding strength while remaining independent of the encoding capacity. Specifically, an average SSIM of 0.66 (\(\alpha = 0.1\)) is equivalent to Gaussian noise with levels ranging from 0.3 to 0.6 26,27, whereas an average SSIM of 0.37 (\(\alpha = 0.2\)) is equivalent to the effect of salt-and-pepper noise at a pixel-inversion probability of \(p = 0.1\) 28.
4.3. Recognition Accuracy Experiments
The average recognition accuracies for various shooting angles are listed in Table 2. The results indicate that shorter shooting distances yield higher recognition accuracy. Similarly, performance improves as the embedding strength \(\alpha\) increases. When \(\alpha\) is set to 0.1, the sine-curve pattern signal is canceled by the image signal to be embedded, as shown in Fig. 11; this interference acts as noise, thereby inhibiting QR code detection. Furthermore, the overall average recognition accuracy was 42.56% for the 48-bit QR code and 45.24% for the 400-bit QR code. The superior performance of the 400-bit invisible QR code is attributed to its higher redundancy and more robust error-correction capability.
Table 2. Recognition accuracy of invisible QR code.
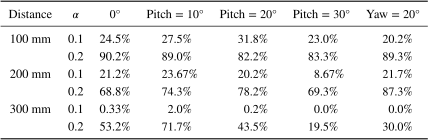
When the embedding strength \(\alpha\) was set to 0.2, the experimental results for varying the shooting pitch angle showed that the recognition accuracy remained relatively consistent compared to the 0° baseline. The relative reduction ratios were calculated as follows:
When the shooting yaw angle was set to 20°, the recognition accuracy remained stable at distances of 100 and 200 mm; however, a decline in accuracy was observed at distances of up to 300 mm. This is attributed to noise within both the sinusoidal pattern and the filtered QR code, particularly when the shooting angle is increased to 30°. To address this, it is necessary to apply appropriate image filters tailored to each yaw angle. The details of this method have been reported in a separate study.
Finally, the embedding and detection of the invisible QR code for the image with the characters were performed as shown in Fig. 13(a), with the embedding strength set to 0.2.
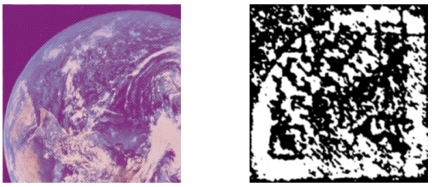
Fig. 11. Detection when the embedding strength is set to 0.1.
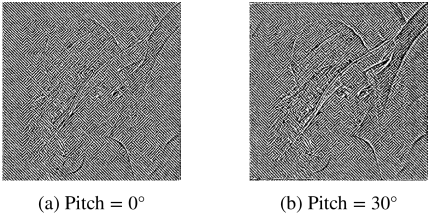
Fig. 12. Differences in edge-enhanced invisible QR codes when changing the pitch angle. Increasing the pitch angle amplifies the original image signal.
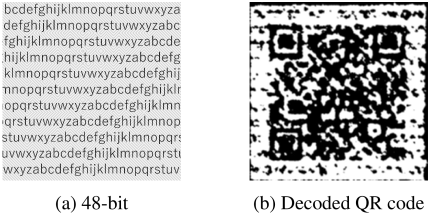
Fig. 13. Invisible QR code with noise generated by characters.
When detection experiments were performed on the character-based image, with pitch and yaw angles set to 0° and the shooting distance at 200 mm, neither the 48-bit nor 400-bit codes were successfully recognized, resulting in 0% recognition accuracy. As shown in Fig. 13, the edges of the characters interfered with the sinusoidal pattern, rendering the embedded information unreadable as a QR code.
To solve this problem, a new feature was added to embedded invisible QR codes. Typically, a sinusoidal QR pattern is superimposed onto an arbitrary rectangular area of the image with a uniform embedding strength \(\alpha\). However, because the sine curve is a dark pattern, it is nullified by the edges of dark characters, rendering the code unreadable. To resolve this, we increased the embedding strength only for textual regions. Specifically, the RGB value of the embedded image is evaluated to determine whether it is dark or not, and when the RGB value exceeds a certain threshold, the embedding strength \(\alpha\) is adjusted to a value higher than the initial setting. The QR codes that are recognizable after these improvements are shown in Fig. 14.
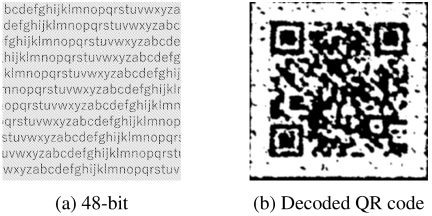
Fig. 14. Invisible QR Code with reduced character noise by modifying the embedding strength \(\alpha\) only on text regions.
The recognition experiments were repeated using the proposed improvement. Under the same conditions as before, the recognition rates for the 48- and 400-bit codes were 70% and 16%, respectively. This is attributed to increasing the embedding intensity in textual regions, which suppressed the original image signal that previously impeded recognition. In addition, the recognition accuracy of the 400-bit invisible QR code was lower than that of the 400-bit QR code in this experiment, even though the 400-bit invisible QR code had higher recognition accuracy in the experiment for Fig. 5. This is likely because of the higher number of cells in the 400-bit version, which makes the code more susceptible to residual noise.
Table 3. Error mean and standard deviation of position and orientation estimation.
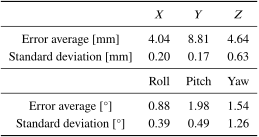
Table 4. Comparison with existing studies.
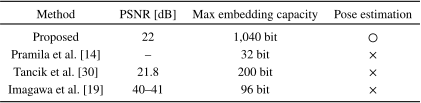
Table 5. Comparison with existing studies using watermarked images.
4.4. Position and Orientation Estimation
The experimental setup involved mounting the camera at the end of the robotic arm as shown in Fig. 8. Ground truth values for position and orientation were obtained directly from the robotic arm’s control display. The results of the estimation experiments are listed in Table 3. The average position estimation error in the \(X\)- and \(Z\)-directions was suppressed to within 5 mm; however the error in the \(Y\)-direction reached approximately 10 mm. Additionally, the average orientation estimation error for each axis remained within 5°, though the standard deviation for the yaw angle was as high as 1.26° because of the variations in the region estimation. To solve this problem, it is necessary to expand the training dataset to develop a more robust segmentation model capable of accurately estimating the watermarked region.
4.5. Comparison with Existing Studies
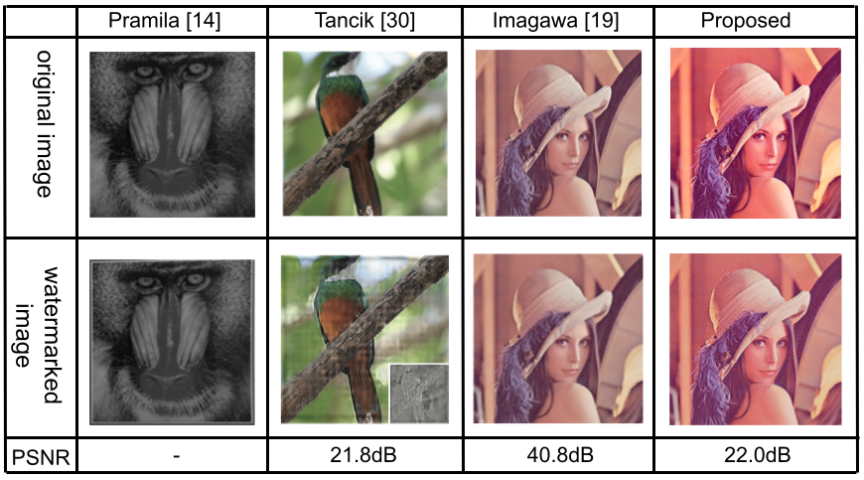
In this section, we benchmark the proposed method against existing techniques. Invisibility and information capacity are critical performance metrics for print-based watermarking system. To evaluate invisibility, we utilized the peak signal-to-noise ratio (PSNR) 29 while information capacity was assessed by comparing the number of bits successfully embedded and detected. The comparative results are summarized in Table 4, and visual comparisons based on the watermarked images are presented in Table 5. Here, the amount of information embedded in each watermark was set to the maximum embedding capacity.
The results demonstrate a PSNR of 22 dB at \(\alpha =0.2\). While this indicates a higher degree of image quality degradation compared to the finding of Imagawa et al. 19, our method achieves a larger maximum embedding capacity than existing studies, alongside an unprecedented position and orientation estimation capability.
4.6. Product Recognition Convenience Store Display and Disposal
Table 6. Product and watermark size.

In this experiment, invisible QR codes were applied to convenience store products to evaluate the accuracy of recognition, as well as position and orientation estimation. Using these results, we verified the operational feasibility of the system for automated display and disposal tasks. Packaged juices f (flat surfaces) and yogurt g (curved surfaces) were selected as representative products. Table 6 details these products along with their corresponding watermark dimensions at an embedding strength \(\alpha = 0.2\). As shown in Fig. 15, these mock-up products were constructed from craft paper to simulate actual packaging, with invisible QR codes embedded on both the top and side surfaces.
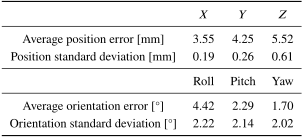
At a shooting distance of 100 mm, experimental results showed an average recognition accuracy of 94% for the flat surfaces of both the packaged juice and yogurt containers. However, for smaller embedding area of juice packaging, increasing the distance to 200 mm resulted in the average accuracy reduction of 44%. Additionally, the estimated watermark outline was distorted because the invisible QR code printed on the side surface of the yogurt container was curved. Consequently, the approximated outline could not be fitted to a rectangle. This suggests the need for a new decoding method to address this issue. The results for position and orientation estimation are listed in Table 7. Compared to the experiments described in Section 4.4, the position estimation errors in the \(XY\)-plane showed improvement; however the errors across all orientation parameters increased. This was probably owing to variations in the segmentation area, which caused distortion in the contour-approximated quadrangle.
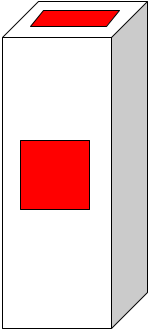
Fig. 15. Schematic of a packaged juice drink with an added QR code. The white rectangular prism represents the packaged juice drink, whereas the red square indicates the invisible QR code.
Table 7. Error mean and standard deviation of position and orientation estimation for convenience store products.
5. Conclusion
In this study, we proposed an information hiding technology optimized for product recognition in display environments. This method enables the embedding of high-capacity data without significantly compromising the aesthetic design of the target. The experimental results demonstrated that, while our method presents a trade-off in terms of invisibility compared to existing techniques, it offers a significantly higher embedding capacity. Additionally, it introduces an unprecedented position and orientation estimation functionality that is absent in conventional watermarking methods. Evaluations using life-size mock-ups of convenience store products confirmed that the invisible QR codes could be successfully detected at shooting distances close to 100 and 200 mm, facilitating accurate spatial estimation. However, at greater distances, detection became challenging as the sinusoidal watermark pattern, although recoverable through image filtering, became undetectable because the relative spatial area of the watermark was insufficient for recognition. Furthermore, decoding errors occurred in cases where the original image signal could not be effectively suppressed within frequency ranges overlapping with the sinusoidal pattern.
Future research will focus on developing a more robust detection method for invisible QR codes, particularly for those captured at extended distances or within limited surface areas. Furthermore, to enhance the precision of position and orientation estimation, it is essential to expand the training dataset and develop a learning model capable of more reliably segmenting the watermarked regions.
Acknowledgments
This work was supported by the Tokyo Metropolitan University local 5G research support.
- [1] N. Muramatsu and H. Akiyama, “Japan: Super-Aging Society Preparing for the Future,” The Gerontologist, Vol.51, Issue 4, pp. 425-432, 2011. https://doi.org/10.1093/geront/gnr067
- [2] K. Miwa, “Study of Operations and Staff Scheduling in Retail Store,” J. of Nagoya Gakuin University, Vol.51, No.4, pp. 143-158, 2015 (in Japanese).
- [3] M. Alghamdi, A. Al-Marakeby, and S. Abdel-Mageid, “Mobile Robot Navigation Based on Artificial Markers: A Systematic Mapping Study,” J. Robot. Mechatron., Vol.37, No.3, pp. 762-778, 2025. https://doi.org/10.20965/jrm.2025.p0762
- [4] G. A. Garcia Ricardez, S. Okada, N. Koganti, A. Yasuda, P. M. U. Eljuri, T. Sano, P.-C. Yang, L. El Hafi, M. Yamamoto, J. Takamatsu, and T. Ogasawara, “Restock and straightening system for retail automation using compliant and mobile manipulation,” Advanced Robotics, Vol.34, Issues 3-4, pp. 235-249, 2020. https://doi.org/10.1080/01691864.2019.1698460
- [5] M. Seki, K. Wada, Y. Kitajima, M. Hashimoto, and T. Tomizawa, “Development of XYZ stage-type display robot system for stock and disposal tasks in convenience stores,” Advanced Robotics, Vol.36, Issue 23, pp. 1252-1272, 2022. https://doi.org/10.1080/01691864.2022.2134736
- [6] T. Takubo, T. Nakamura, R. Sugiyama, and A. Ueno, “Multifunctional Shelf and Magnetic Marker for Stock and Disposal Tasks in Convenience Stores,” J. Robot. Mechatron., Vol.35, No.1, pp. 18-29, 2023. https://doi.org/10.20965/jrm.2023.p0018
- [7] A. Jain, M. Singhal, and M. Jhamb, “ArUco Marker-Based Pick and Place Approach Using a UR5 Robotic Arm and Vacuum Gripper,” H. Sharma et al. (Eds.), “Artificial Intelligence: Theory and Applications,” Lecture Notes in Networks and Systems, Vol.843, pp. 365-379, 2024. https://doi.org/10.1007/978-981-99-8476-3_30
- [8] Y. Wei, S. Tran, S. Xu, B. Kang, and M. Springer, “Deep Learning for Retail Product Recognition: Challenges and Techniques,” Computational Intelligence and Neuroscience, Article No.8875910, 2020. https://doi.org/10.1155/2020/8875910
- [9] S. Kawanishi, K. Wada, and Y. Kikutake, “Packaging Design for Product Recognition Using Deep Learning,” J. Robot. Mechatron., Vol.37, No.2, pp. 535-543, 2025. https://doi.org/10.20965/jrm.2025.p0535
- [10] A. Keskinarkaus, “Digital Watermarking Techniques for Printed Images,” University of Oulu, 2012.
- [11] A. Keskinarkaus, A. Pramila, and T. Seppänen, “Image watermarking with a directed periodic pattern to embed multibit messages resilient to print-scan and compound attacks,” J. of Systems and Software, Vol.83, Issue 10, pp. 1715-1725, 2010. https://doi.org/10.1016/j.jss.2010.04.073
- [12] A. Pramila, A. Keskinarkaus, and T. Seppänen, “Toward an interactive poster using digital watermarking and a mobile phone camera,” Signal, Image and Video Processing, Vol.6, No.2, pp. 211-222, 2012. https://doi.org/10.1007/s11760-011-0211-2
- [13] W.-G. Kim, S. H. Lee, and Y.-S. Seo, “Image Fingerprinting Scheme for Print-and-Capture Model,” Y. Zhuang et al. (Eds.), “Advances in Multimedia Information Processing – PCM 2006,” Lecture Notes in Computer Science, Vol.4261, pp. 106-113, 2006. https://doi.org/10.1007/11922162_13
- [14] A. Pramila, A. Keskinarkaus, and T. Seppänen, “Increasing the capturing angle in print-cam robust watermarking,” J. of Systems and Software, Vol.135, pp. 205-215, 2018. https://doi.org/10.1016/j.jss.2017.10.029
- [15] T. Nakamura, A. Katayama, M. Yamamuro, and N. Sonehara, “High-speed watermark detection method from analog images using camera-equipped cell phones,” IEICE Trans. (Japanese Edition), Vol.J87-D-II, No.12, pp. 2145-2155, 2004 (in Japanese).
- [16] T. Nakamura, A. Katayama, M. Yamamuro, and N. Sonehara, “Fast watermark detection scheme for camera-equipped cellular phone,” Proc. of the 3rd Int. Conf. on Mobile and Ubiquitous Multimedia (MUM’04), pp. 101-108, 2004. https://doi.org/10.1145/1052380.1052395
- [17] M. Iwata, K. Yamanaka, and K. Kise, “Digital Watermarking Method to Extract Watermarks from Printed Matters with Cell Phone by Using Finder Patterns and Alignment Pattern of QR Code,” 2013 2nd IAPR Asian Conf. on Pattern Recognition, pp. 391-395, 2013. https://doi.org/10.1109/ACPR.2013.79
- [18] H. Ogawa, M. Iwata, and K. Kise, “Watermarking method that can extract watermarks from printed materials without positional markers using image search,” 2016 Symp. on Cryptography and Information Security, 2016.
- [19] H. Imagawa, M. Iwata, and K. Kise, “Digital Watermarking Method for Printed Matters Using Deep Learning for Detecting Watermarked Areas,” IEICE Trans. on Information and Systems, Vol.E104.D, Issue 1, pp. 34-42, 2021. https://doi.org/10.1587/transinf.2020MUP0004
- [20] R. C. Gonzalez and R. E. Woods, “Digital Image Processing,” Pearson Education Limited, 2018.
- [21] R. Hartley and A. Zisserman, “Multiple View Geometry in Computer Vision,” Cambridge University Press, 2003. https://doi.org/10.1017/CBO9780511811685
- [22] C.-P. Lu, G. D. Hager, and E. Mjolsness, “Fast and globally convergent pose estimation from video images,” IEEE Trans. on Pattern Analysis and Machine Intelligence, Vol.22, Issue 6, pp. 610-622, 2000. https://doi.org/10.1109/34.862199
- [23] J. A. Hesch and S. I. Roumeliotis, “A direct least-squares (DLS) method for PnP,” 2011 Int. Conf. on Computer Vision, pp. 383-390, 2011. https://doi.org/10.1109/ICCV.2011.6126266
- [24] Y. Zheng, Y. Kuang, S. Sugimoto, K. Åström, and M. Okutomi, “Revisiting the PnP Problem: A Fast, General and Optimal Solution,” 2013 IEEE Int. Conf. on Computer Vision, pp. 2344-2351, 2013. https://doi.org/10.1109/ICCV.2013.291
- [25] Z. Wang, A. C. Bovik, H. R. Sheikh, and E. P. Simoncelli, “Image quality assessment: From error visibility to structural similarity,” IEEE Trans. on Image Processing, Vol.13, Issue 4, pp. 600-612, 2004. https://doi.org/10.1109/TIP.2003.819861
- [26] Z. Liu, “What is Wrong with SSIM Quality Metric,” The 77th National Convention of IPSJ, pp. 35-36, 2015.
- [27] U. Sara, “Comparative Study of Different Quality Assessment Techniques on Color Images,” Iconic Research and Engineering J., Vol.2, Issue 11, pp. 127-133, Article No.1701217, 2019.
- [28] Y. Reznik, “Another look at SSIM image quality metric,” Electronic Imaging, Vol.35, Article No.IQSP-305, 2023. https://doi.org/10.2352/EI.2023.35.8.IQSP-305
- [29] D. R. I. M. Setiadi, “PSNR vs SSIM: Imperceptibility quality assessment for image steganography,” Multimedia Tools and Applications, Vol.80, No.6, pp. 8423-8444, 2021. https://doi.org/10.1007/s11042-020-10035-z
- [a] M. Tancik, B. Mildenhall, and R. Ng, “StegaStamp: Invisible Hyperlinks in Physical Photographs,” 2020 IEEE/CVF Conf. on Computer Vision and Pattern Recognition (CVPR), pp. 2114-2123, 2020. https://doi.org/10.1109/CVPR42600.2020.00219
- [b] Seven-Eleven Japan Investor Relations Report (in Japanese). https://www.7andi.com/ir/file/library/co/pdf/2024_03.pdf [Accessed October 28, 2024]
- [c] S. Ando, I. Igarashi, T. Kinebuchi, T. Nakamura, D. Namikawa, R. Yamashita, Y. Yao, Y. Kusachi, and N. Takei, “Image recognition watermark embedding and detection technology for product information presentation service for convenience stores,” 2017 (in Japanese). https://journal.ntt.co.jp/backnumber2/1706/files/JN20170610.pdf [Accessed March 17, 2025]
- [d] Ultralytics Repository. https://github.com/ultralytics/ultralytics [Accessed December 16, 2024]
- [e] Kanagawa Institute of Technology Standard Image / Sample Data (in Japanese). http://www.ess.ic.kanagawa-it.ac.jp/app_images_j.html [Accessed September 8, 2025]
- [f] SONY ELP-USB4K02AF-V100. https://www.elpcctv.com/elp-128-sony-imx415-color-cmos-sensor-4k-autofocus-usb-camera-elpusb4k02afv100-p-162.html [Accessed March 9, 2025]
- [g] Seven Premium fruit juice 100% orange and mandarin oranges 200 mL (in Japanese). https://7premium.jp/product/search/detail?id=43l [Accessed May 3, 2025]
- [h] Meiji Probio Yogurt R-1 (in Japanese). https://www.meiji.co.jp/dairies/yogurt/meiji-r1/product/ [Accessed May 3, 2025]
This article is published under a Creative Commons Attribution-NoDerivatives 4.0 Internationa License.