
Paper:
High Spatial Resolution Tactile Image Sensor Employing Strain-Sensing Polymer
Daiki Ishida*, Osamu Tsutsumi**
 , and Kazuhiro Shimonomura*
*Department of Robotics, Ritsumeikan University
1-1-1 Nojihigashi, Kusatsu, Shiga 525-8577, Japan
**Department of Applied Chemistry, Ritsumeikan University
1-1-1 Nojihigashi, Kusatsu, Shiga 525-8577, Japan

High spatial resolution tactile sensors are essential for robots to perform delicate and highly accurate tasks. To achieve sub-millimeter-order high spatial resolution, a tactile image sensor using mechanical-optical materials was fabricated using strain-sensing polymers. Strain-sensing polymers are polymer materials whose light reflection wavelength characteristics change depending on the magnitude of the applied strain. This tactile image sensor has a structure in which a strain-sensing polymer sheet is placed on a transparent acrylic substrate, and the sheet is photographed from the back with a color camera. By mapping the hue value to the pressure at each pixel using the color image of the strain-sensing polymer acquired by the camera, the pressure distribution on the sensor surface was estimated with sub-millimeter-order high spatial resolution. The developed sensor was able to estimate the pressure distribution with a spatial resolution of at least 0.4 mm and a measurement range of up to approximately 0.7 MPa. Furthermore, experiments confirmed that the high spatial resolution of the proposed tactile image sensor is also effective in accurately estimating the orientation of the object being contacted. This sensor is useful for robot hand to estimate the gripping state of minute or thin objects and perform manipulation tasks with high precision.
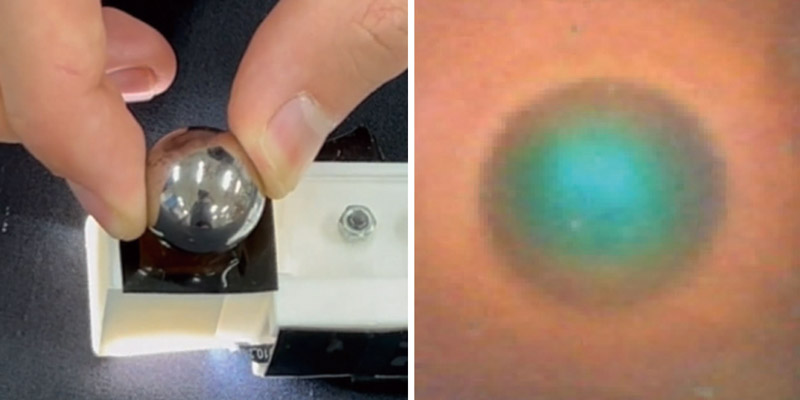
Tactile image sensor with strain-sensing polymer
1. Introduction
Tactile sensors can observe the mechanical interaction between a robot and an object, and it is an important elemental technology to expand the range of tasks performed by robots, such as assembling mechanical and electronic parts, handling food, and assisting with housework 1. In particular, high spatial resolution tactile sensors are essential for robot hands to estimate the gripping state of small or thin objects and perform delicate and highly accurate tasks. Tactile image sensors using cameras acquire images of changes in the sensor surface caused by physical contact 2,3,4, and can extract a variety of tactile information with high spatial resolution through image analysis. They are being applied to manipulation 5,6,7,8,9, inspection tasks 10,11 and human-robot interaction 12. In the tactile image sensors, converting the physical contact with the sensor surface into light information is the most important part for detecting tactile information from the camera image, and there are several typical methods that have been used in the studies reported so far 2. For example, in a light conductive plate method, the camera captured a scattering light caused by contact of object with the surface of the light conductive plate, in which the illumination light is introduced 13. A marker displacement method measures displacement of markers embedded in a transparent flexible material on the sensor surface, and is suitable for estimating the contact area and pressure distribution 14. A reflective membrane method visualizes small deformation on the sensor surface, which is caused by contact, using a reflective membrane and side illumination, and is suitable for visualizing the minute irregularities on the surface of the contact object 15. In terms of spatial resolution, the resolution of the marker displacement method-based sensors basically depends on the pitch of the marker arrangement, which is the measurement point. Some recent sensors have used random dots to achieve higher spatial resolution that is independent of individual marker pitch, and achieved approximately 1 mm of the spatial resolution 16,17. In the reflective membrane method-based sensors, since it is difficult to directly estimate the force from the reflective membrane image, additional markers are often installed when measuring force distribution, in which case the spatial resolution is basically equivalent to that of the marker displacement method 18.
If pressure distribution can be estimated with even higher spatial resolution than previously proposed tactile image sensors—that is, sub-millimeter-order spatial resolution—the position and orientation of the contacting object can be estimated with greater accuracy. Moreover, if image processing for this can be realized with simple processing, it will lead to high-speed tactile sensing and real-time robotic control applications. In this study, a novel mechano-optical material-based tactile image sensor using a “strain-sensing polymer” whose spectral reflectance property changes according to the magnitude of strain is fabricated (Fig. 1). By finding the relationship between pressure and pixel value on a color image, applied force is estimated at each pixel on the image by simple pixel value conversion. The actual spatial resolution and orientation estimation accuracy of the prototype tactile image sensor were evaluated.
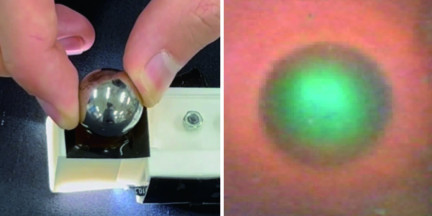
Fig. 1. Tactile image sensor with strain-sensing polymer. When pushing the sensor surface (left), color in the pressed region of the strain-sensing polymer changes in the image obtained from the camera installed in the sensor (right).
2. Proposed Tactile Image Sensor
2.1. Strain-Sensing Polymer
A strain-sensing polymer is a thin elastic film fabricated by sandwiching a cholesteric liquid crystal (CLC) elastomer film between a pair of elastic polydimethylsiloxane (PDMS) films, and its spectral reflectance properties shift with the magnitude of strain due to the mechano-optical effect of CLC elastomers 19 and are being investigated as flexible sensor materials 20. The CLC elastomers have a helical molecular orientation, and this helical structure causes wavelength-selective reflection (Bragg reflection). When the pitch of this helical structure is changed by strain, the reflection wavelength shifts. According to 19, the peak reflectance wavelength of this material is observed at 620 nm without tensile strain, whereas it shifts to a shorter wavelength of 514 nm at 50\(\%\) of tensile strain.
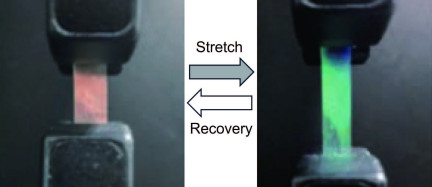
Fig. 2. Photographs of a strain-sensing polymer sheet during a tensile test. The color of the sheet without tensile strain is orange (left), and it changes to bluish-green when 50\(\%\) tensile strain is applied (right) 19.
Figure 2 shows how a sheet of the strain-sensing polymer is pulled in a direction parallel to its surface, resulting in a shift of the reflection wavelength toward shorter wavelengths due to lateral strain, and how the entire sheet appears to change color from uniformly reddish to blue in the color image. While these pictures show the change in color caused by transverse strain caused by pulling parallel to the surface of the sheet, the same principle is applied to a load perpendicular to the surface of the sheet, where the sheet is compressed and strained, resulting in a change in the reflected wavelength.
2.2. Structure of the Sensor
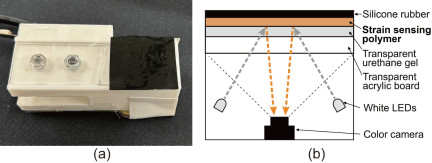
Fig. 3. Picture of the tactile image sensor with strain-sensing polymer (a), and the cross sectional structure of the sensor (b). From the top of the sensor, silicone rubber (\(t=0.1\) mm), a strain-sensing polymer sheet (\(t=0.275\) mm), and transparent urethane gel (Asker C23, \(t=1.0\) mm) are layered on top of a transparent acrylic plate (\(t=2\) mm). A color camera is mounted to cover an about 15 mm square measuring area, and white LEDs illuminate the back of the acrylic plate.
Figure 3 shows the structure of the prototype tactile image sensor with strain-sensing polymer sheet. A transparent urethane gel sheet was pasted on a transparent acrylic plate, and a sheet of strain-sensing polymer (thickness 0.275 mm) was placed on top of it. The strain-sensing polymer sheet consists of a CLC elastomer film (0.055 mm in thickness) sandwiched between PDMS films (0.11 mm each in thickness). The surface of the sensor that contacts the object is covered with a black silicone rubber sheet for protection. The strain-sensing polymer was illuminated with white LED light from behind a transparent acrylic plate, and a small color camera (DCT CS-1910-512D-USB) was used to capture images. The camera and the illumination LED are covered with a plastic case to protect it from ambient light. The size of the sensor surface is 15 mm \(\times\) 15 mm.
2.3. Output Images
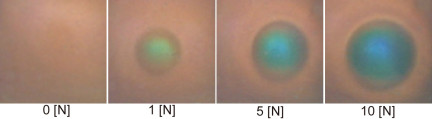
Fig. 4. Output images of the tactile image sensor. A metal ball was pressed against the sensor surface to apply force.
Figure 4 shows the output color images from the sensor when a hard metal sphere contacts the sensor surface. Before contact (0 N), the color is uniformly reddish. When the sphere is pressed against the sensor surface, the area of contact turns bluish color, and as the force increases (1 N, 5 N, 10 N), the blue color becomes darker and the area of such a bluish region expands. This color change can be detected pixel-by-pixel, allowing the contact area to be detected with high spatial resolution. In order to estimate the pressure distribution, it is necessary to associate the pixel values of a color image composed of RGB values with pressure value.
3. Estimation of Pressure Distribution
3.1. Estimating Pressure from Pixel Value in Color Image
It is known that the peak reflection wavelength of the strain-sensing polymer sheet shifts linearly with strain 19. Therefore, by measuring the reflected light spectrum, the strain can be accurately determined. On the other hand, to realize a small tactile sensor for robotic applications, it is preferable to use a small color camera rather than a spectral measurement instrument. Here, the RGB value obtained from the color image obtained by the small color camera was converted to HSV color representation, and the pressure was estimated using the hue (H) value. The hue value is calculated based on color difference of RGB, so it has larger changes and is more stable. By using the following procedure, the hue value of each pixel is mapped to pressure applied on it.
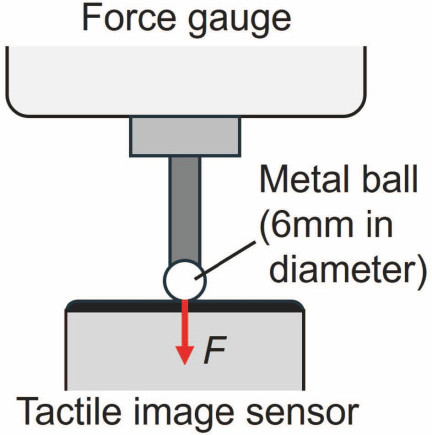
Fig. 5. Experimental setup. A 6-mm diameter metal ball is attached to the tip of a force gauge and moved vertically downwards, pressing it against the surface of a tactile image sensor. The force \(F\) measured by the force gauge and the output image from the tactile image sensor are acquired.
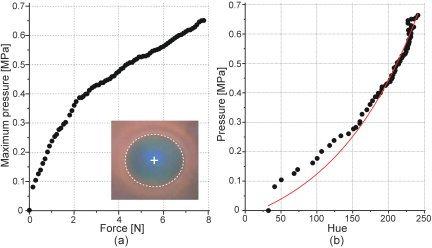
Fig. 6. Pressure estimation curve obtained through experiments. (a) Relation between the force and maximum pressure. Maximum pressure occurs at the center of the contact area shown by the white \(+\), according to the Hertz contact theory. (b) Relationship between the hue and pressure.
First, a hard metal sphere (6 mm in diameter) was pressed against the sensor surface, and color images were acquired while varying the vertical force \(F\) from 0 N to approximately 8 N in approximately 0.1 N steps (Fig. 5). In each image, the pixels whose hue changed from the initial no-load condition were extracted, and the corresponding area \(S\) [mm\(^2\)] on the sensor surface was calculated based on the area in pixel on the image. The average pressure in the contact area \(\bar{P}\) is calculated as follows:
3.2. Experimental Results
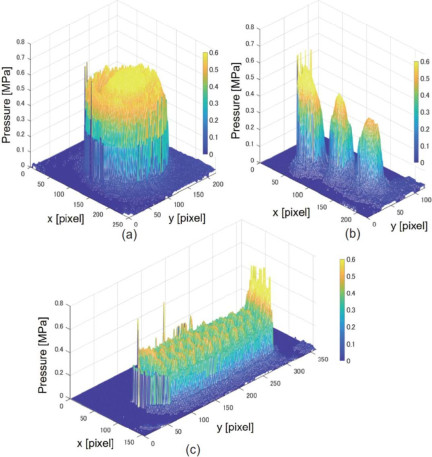
Fig. 7. Results of the estimation of the pressure distribution. (a) Metal spherical object, (b) the tips of the three terminals of a TO-92 package transistor, (c) threaded part of a M3 bolt.
Several different objects were pressed against the proposed sensor to estimate the pressure distribution on the sensor surface. The RGB color image obtained from the sensor was converted to HSV, and the pressure of each pixel was estimated according to the method described in the previous section. Fig. 7 shows the results of the pressure distribution estimation for three different objects, a metal ball, a discrete transistor with TO-92 package, and an M3 bolt. These objects were pressed against the sensor surface with forces of 7.6 N, 4.8 N, and 1.3 N, respectively.
The pressure distribution estimation results for the metal ball (a) showed a hemispherical pressure distribution as predicted by the Hertz contact stress. In (b), the pitch of three terminals of TO-92 package is 1.27 mm, and these three terminals can be clearly distinguished from the result. Also, the thread pitch of M3 bolt is 0.5 mm, and each thread can be distinguished in (c). Single pixel on the image corresponds to 0.0283 mm \(\times\) 0.0283 mm on the sensor surface, and the pressure value for each pixel ranges up to approximately 0.7 MPa.
3.3. Validation of the Estimated Pressure Distribution
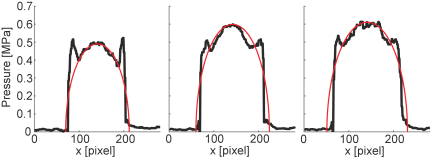
Fig. 8. Comparison with the estimated pressure distribution and the expected one from Hertz’s contact theory (red line). Applied force was 4.2 (left), 6.2 (middle), and 7.6 N (right).
To verify the validity of the estimated pressure distribution, the results of the pressure distribution estimation for the spherical object, shown in Fig. 7(a), were compared with the pressure distribution expected from Hertz’s contact theory. Fig. 8 shows the comparison of the profile of the pressure estimation results (black line) with that expected from Hertz’s contact theory (red line) in 4.2, 6.2, and 7.6 N of the applied force. As the applied force increases, the pressure distribution becomes larger and wider. In all cases, the overall shape was close to the hemispherical pressure distribution as predicted by the Hertz contact stresses. At the edge of the contact area, the estimated pressure is locally high, which is particularly noticeable when the load is 4.2 N. Regarding this, at the edge of the contact area, the strain-sensing polymer sheet may be subjected to not only normal but also shear strain, enhancing the color change of the sheet. CLC elastomers exhibiting a mechanical-optical response have a helical molecular orientation, which causes wavelength-selective reflection. When the pitch of this helical structure changes due to mechanical deformation, the reflected wavelength changes 19. Based on this, it can be inferred that the shear strain generated at the edge of the contact region contributes to the change in optical properties.
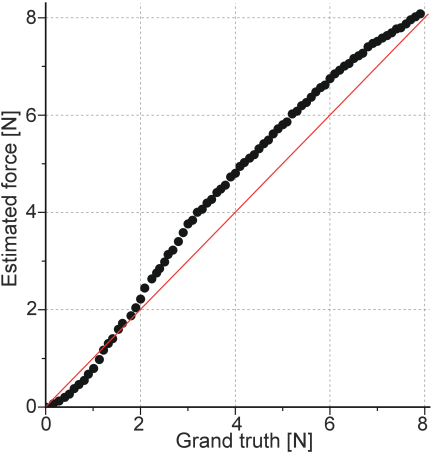
Fig. 9. Results of total force estimation. The estimated force is obtained by integrating estimated pressure of each pixel, and compared with grand truth measured by a force gauge.
As another verification, the applied force was calculated from the estimated pressure distribution, and compared with true value, which was measured by force gauge (Fig. 5). The estimated force was obtained by integrating the pressure value of pixels whose hue value changed from initial state. Fig. 9 shows the results of comparing the estimated force with the true value measured by the force gauge. The estimated force was generally correct ranging from 0 N to 8 N, and the largest error was approximately 20\(\%\). One possible cause of this error is the error in the estimated pressure value at individual pixels. As shown in Fig. 6, the hue-to-pressure conversion curve used in this study has some errors compared to the pressure calculated from measured force. It is possible that cumulative errors occurred as a result of integrating these to estimate the overall force. Another cause is the influence of the large pressure response shown in Fig. 8, which is presumed to be caused by shear strain appearing at the edge of the contact region. It is possible that the force was overestimated as a result of these responses being included in the integration.
3.4. Spatial Resolution of the Pressure Distribution Sensing
Major advantage of the proposed tactile image sensors is their high spatial resolution in pressure distribution estimation. The size of the sensor surface corresponding to one pixel in the acquired image is 0.0283 mm \(\times\) 0.0283 mm. However, the actual spatial resolution is lower than estimated from this due to the mechanical characteristics of the soft sensor surface material. That is, on an elastomer sensor surface, the deformation at a measurement point is affected by the deformation in its surrounding points. Therefore, we investigated the spatial resolution of the fabricated tactile image sensor through experiments.
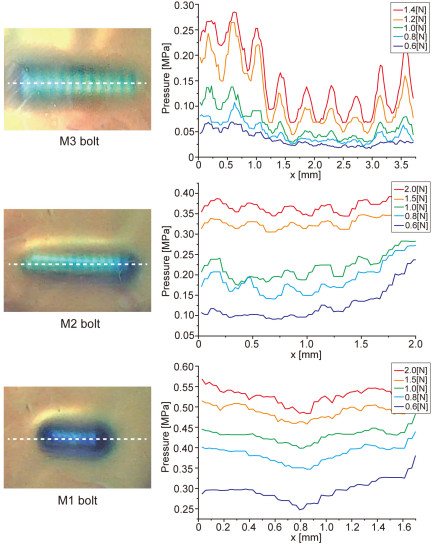
Fig. 10. Response to the bolt of M3, M2, and M1. Color images from the sensor (left) and the estimated pressure profiles along the white dashed lines for different pushing force (right).
The spatial resolution can be evaluated as the minimum distance at which the two points can be distinguished by applying a force to two different points on the sensor surface. Here, we investigated whether the pitch of the threads could be detected correctly in the acquired images when the threads of several bolts with different pitch were pressed against the sensor surface. M3 (pitch 0.5 mm), M2 (pitch 0.4 mm), and M1 (pitch 0.25 mm) bolts were used in the experiment. Fig. 10 shows the pressure distribution for these bolts for different pushing force. For M3 and M2 bolts, the pressure distribution corresponds correctly to the thread pitch when the pressing force is greater than 0.6 N and 0.8 N, respectively, but when the pressing force was lower than that, the thread pitch cannot be identified. As expected from Fig. 6(b), a response corresponding to the pitch of the thread was observed when the pressure exceeded approximately 0.1 MPa. As for the M1 bolt, no response reflecting the pitch of the bolt was observed even if the pushing force increased. The Fourier transform of these responses and examination of the major frequencies revealed that frequencies corresponding to the pitch of the threads were correctly obtained for the M3 and M2 bolts when the pressing force is greater than 0.8 N, but the correct spatial frequencies were not obtained for the M1 bolt. Therefore, the spatial resolution of this tactile image sensor is estimated between 0.25 mm and 0.4 mm at a minimum pressure of 0.1 MPa.
4. Estimation of Orientation
4.1. Algorithm
The high spatial resolution of the proposed tactile image sensor is also useful for accurately estimating the orientation of contacted objects. When an object is grasped by a gripper equipped with a tactile image sensor as shown in Fig. 11, the object’s orientation within the gripper can be accurately estimated, and this information can be used for handling control.
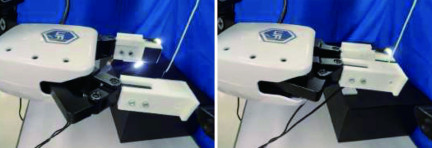
Fig. 11. A two-fingered gripper equipped with a tactile image sensor. It can estimate the position and orientation of the grasped object within the gripper using strain-sensing polymer output images.
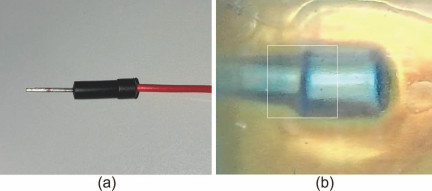
Fig. 12. Target object in the experiment of orientation estimation. (a) Jumper wire used in the experiment, (b) tactile image for the jumper wire placed at angle of 0°. Image of the area surrounded by the white rectangle is used as a template image in the orientation estimation.
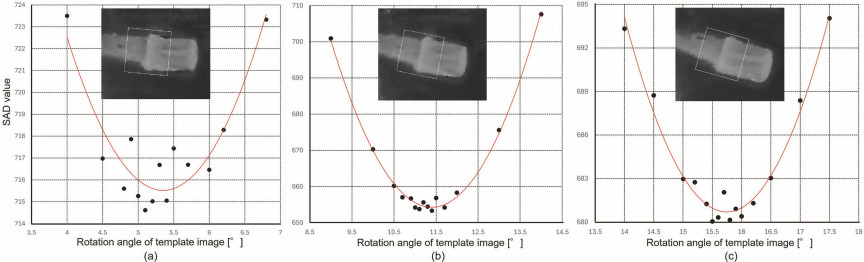
Fig. 13. Experimental results of the orientation estimation based on a template matching. (a), (b), and (c) show the results for the jumper wire placed at angle of 5°, 10°, and 15°, respectively. Estimated orientations were obtained as the angle at which the approximated quadratic curve (red line) takes its minimum value, and were 5.35°, 11.40°, and 15.75°. The inset shows the position and orientation of the template image for the smallest SAD value.
To verify how precisely the orientation can be estimated, we used a thin jumper wire for electronic work as a target object (Fig. 12(a)). Fig. 12(b) shows the output image of the tactile image sensor when the jumper wire was pressed against it with a constant force. Since the black plastic cover of the jumper wire is the thickest part (2.87 mm in diameter), the tactile image sensor primarily responded to that portion. The orientation at this image was defined as 0°, and then the orientation of the jumper wire was varied using a robot arm (UFACTORY xArm 6) to estimate its orientation. For orientation estimation, the template matching method was employed. The image within the white rectangle in Fig. 12(b) was used as the template image, and this template was shifted horizontally and vertically by one pixel and rotated by 0.1° increments while calculating the sum of absolute difference (SAD) value. Both the template and the target images were based on hue images obtained through HSV conversion.
4.2. Experimental Results
Figure 13 shows the experimental results when the jumper wire was placed on the tactile image sensor at orientations of 5°, 10°, and 15°. The template image was rotated, and the minimum SAD value obtained at each angle was plotted. The SAD value reaches its minimum at the region that best matches the template image. Around this region, the rotation step size was set small, while in other ranges a larger step size was used. After calculating SAD values until they became sufficiently larger than the minimum value, a quadratic curve was fitted to the data. The angle at which this quadratic curve reached its minimum was taken as the estimated orientation. As a result, the estimated orientations were 5.35°, 11.40°, and 15.75° for the true orientations of 5°, 10°, and 15°, respectively, corresponding to error rates of 7\(\%\), 14\(\%\), and 5\(\%\).
In the experiment, although the overall load was controlled to remain constant based on the output of the tactile image sensor, slight differences in pressure distribution may have occurred at different orientations. This could be a possible cause of the orientation estimation errors. Also, the estimated orientation had a positive error in all three cases. The cause is unknown, as it is not related to the robot’s positioning accuracy or estimation algorithm. However, it is possible that when the jumper wire was grasped by the robot gripper, the soft surface of the tactile image sensor deformed slightly, causing a slight change in the object’s orientation. On the other hand, in some cases the error was less than 1°, indicating that orientation could be estimated with relatively high accuracy. This capability can be useful for estimating the in-hand position and orientation of grasped objects in robotic hands.
5. Conclusions
A tactile image sensor based on mechano-optical materials using strain-sensing polymers was developed. By mapping the hue value in each pixel on the camera image to the pressure, pressure distribution is estimated with a high spatial resolution of at least 0.4 mm in 15 mm \(\times\) 15 mm of sensing area. The measurable pressure range is 0.1 MPa to 0.7 MPa, and it is estimated for each pixel. Furthermore, experiments have confirmed that the high spatial resolution of the proposed tactile image sensor is also useful for accurately estimating the orientation of a contacted object.
Future challenges include evaluating the behavior of the proposed tactile image sensor under repeated loading, its durability during long-term use, and its time response. Since these characteristics are directly influenced by the strain-sensing polymer, we will continue research and development of materials with properties more suitable for tactile sensors, along with improving the sensor structure and image analysis algorithm for extracting tactile information. We plan to apply the developed tactile image sensor to the recognition of small objects and textured surface patterns through tactile sensing, as well as to object handling based on high-precision estimation of in-hand position and orientation.
- [1] S. Luo, N. F. Lepora, W. Yuan, K. Althoefer, G. Cheng, and R. Dahiya, “Tactile robotics: An outlook,” IEEE Trans. on Robotics, Vol.41, pp. 5564-5583, 2025. https://doi.org/10.1109/TRO.2025.3608686
- [2] K. Shimonomura, “Tactile image sensors employing camera: A review,” Sensors, Vol.19, No.18, Article No.3933, 2019. https://doi.org/10.3390/s19183933
- [3] S. Zhang et al., “Hardware technology of vision-based tactile sensor: A review,” IEEE Sensors J., Vol.22, No.22, pp. 21410-21427, 2022. https://doi.org/10.1109/JSEN.2022.3210210
- [4] S. Li et al., “When vision meets touch: A contemporary review for visuotactile sensors from the signal processing perspective,” IEEE J. of Selected Topics in Signal Processing, Vol.18, No.3, pp. 267-287, 2024. https://doi.org/10.1109/JSTSP.2024.3416841
- [5] A. Yamaguchi and C. G. Atkeson, “Recent progress in tactile sensing and sensors for robotic manipulation: Can we turn tactile sensing into vision?,” Advanced Robotics, Vol.33, pp. 661-673, 2019. https://doi.org/10.1080/01691864.2019.1632222
- [6] H. Sun, K. J. Kuchenbecker, and G. Martius, “A soft thumb-sized vision-based sensor with accurate all-round force perception,” Nature Machine Intelligence, Vol.4, pp. 135-145, 2022. https://doi.org/10.1038/s42256-021-00439-3
- [7] S. Yuan et al., “Tactile-reactive roller grasper,” IEEE Trans. on Robotics, Vol.41, pp. 1938-1955, 2025. https://doi.org/10.1109/TRO.2025.3543324
- [8] W. K. Do, A. K. Dhawan, M. Kitzmann, and M. Kennedy, “DenseTact-Mini: An optical tactile sensor for grasping multi-scale objects from flat surfaces,” 2024 IEEE Int. Conf. on Robotics and Automation (ICRA), pp. 6928-6934, 2024. https://doi.org/10.1109/ICRA57147.2024.10610583
- [9] M. Wang et al., “Large-scale deployment of vision-based tactile sensors on multi-fingered grippers,” 2024 IEEE/RSJ Int. Conf. on Intelligent Robots and Systems (IROS), pp. 13946-13952, 2024. https://doi.org/10.1109/IROS58592.2024.10801566
- [10] K. Shimonomura, T. Chang, and T. Murata, “Detection of foreign bodies in soft foods employing tactile image sensor,” Frontiers in Robotics and AI, Vol.8, Article No.774080, 2021. https://doi.org/10.3389/frobt.2021.774080
- [11] M. A. Mirzaee, H.-J. Huang, and W. Yuan, “GelBelt: A vision-based tactile sensor for continuous sensing of large surfaces,” IEEE Robotics and Automation Letters, Vol.10, No.2, pp. 2016-2023, 2025. https://doi.org/10.1109/LRA.2025.3527306
- [12] Q. K. Luu, D. Q. Nguyen, N. H. Nguyen, N. P. Dam, and V. A. Ho, “Vision-based proximity and tactile sensing for robot arms: Design, perception, and control,” IEEE Trans. on Robotics, Vol.41, pp. 5000-5019, 2025. https://doi.org/10.1109/TRO.2025.3593087
- [13] K. Shimonomura and H. Nakashima, “A combined tactile and proximity sensing employing a compound-eye camera,” Proc. of IEEE SENSORS 2013, pp. 1464-1465, 2013. https://doi.org/10.1149/MA2013-01/44/1465
- [14] B. Ward-Cherrier, N. Pestell, L. Cramphorn, B. Winstone, M. E. Giannaccini, J. Rossiter, and N. F. Lepora, “The TacTip family: Soft optical tactile sensors with 3D-printed biomimetic morphologies,” Soft Robotics, Vol.5, No.2, pp. 216-227, 2018. https://doi.org/10.1089/soro.2017.0052
- [15] W. Yuan, S. Dong, and E. H. Adelson, “GelSight: High-resolution robot tactile sensors for estimating geometry and force,” Sensors, Vol.17, No.12, Article No.2762, 2017. https://doi.org/10.3390/s17122762
- [16] C. Sferrazza and R. D’Andrea, “Sim-to-real for high-resolution optical tactile sensing: From images to three-dimensional contact force distributions,” Soft Robotics Vol.9, No.5, pp. 926-937, 2022. https://doi.org/10.1089/soro.2020.0213
- [17] G. Zhang, Y. Du, H. Yu, and M. Y. Wang, “DelTact: A vision-based tactile sensor using a dense color pattern,” IEEE Robotics and Automation Letters, Vol.7, No.4, pp. 10778-10785, 2022. https://doi.org/10.1109/LRA.2022.3196141
- [18] M. Lambeta et al., “DIGIT: A novel design for a low-cost compact high-resolution tactile sensor with application to in-hand manipulation,” IEEE Robotics and Automation Letters, Vol.5, No.3, pp. 3838-3845, 2020. https://doi.org/10.1109/LRA.2020.2977257
- [19] K. Hisano, S. Kimura, K. Ku, T. Shigeyama, N. Akamatsu, A. Shishido, and O. Tsutsumi, “Mechano-optical sensors fabricated with multilayered liquid crystal elastomers exhibiting tunable deformation recovery,” Adv. Funct. Mater., Vol.31, Article No.2104702, 2021. https://doi.org/10.1002/adfm.202104702
- [20] M. Xie, K. Hisano, M. Zhu, T. Toyoshi, M. Pan, S. Okada, O. Tsutsumi, S. Kawamura, and C. Bowen, “Flexible multifunctional sensors for wearable and robotic applications,” Adv. Mater. Technol., Vol.4, Article No.1800626, 2019. https://doi.org/10.1002/admt.201800626
This article is published under a Creative Commons Attribution-NoDerivatives 4.0 Internationa License.