
Paper:
Two-Stage Recognition Framework Based on YOLO and Siamese Networks for Crack Detection in Cherry Tomatoes
Zhaohui Tan and Masanori Sato
Nagasaki Institute of Applied Science
536 Abamachi, Nagasaki, Nagasaki 851-0193, Japan

Here, we propose a deep learning-based two-stage recognition system for fruit-level crack classification in cherry tomatoes. This targets harvesting and sorting scenarios in real-world cultivation environments where leaves and stems are present. Cherry tomato cracking exhibits substantial visual variability, ranging from clearly split fruits to subtle white linear cracks around the calyx region. Therefore, crack-region-based or bounding-box-driven detection methods are highly susceptible to external noise, such as occlusions caused by leaves and stems, and illumination variations. This can strongly impair their generalization performance in field conditions. The wide diversity of crack appearances makes it difficult to collect sufficiently large and stable annotated datasets for robust training. To alleviate data scarcity, synthetic data generation was used to support model pre-training. Crack recognition in real-world environments was formulated as a two-stage framework comprising fruit detection followed by fruit-level crack classification. In the first stage, cherry tomatoes are detected using a You Only Look Once (YOLO)-based object detector. In the second stage, the detected fruit instances are classified as cracked or non-cracked through image-level classification using a Siamese network. Based on real-world environmental images, the proposed method achieved a crack classification accuracy of approximately 88% for red cherry tomatoes and successfully detected red cherry tomatoes, demonstrating its effectiveness for fruit-level crack differentiation under practical cultivation conditions.
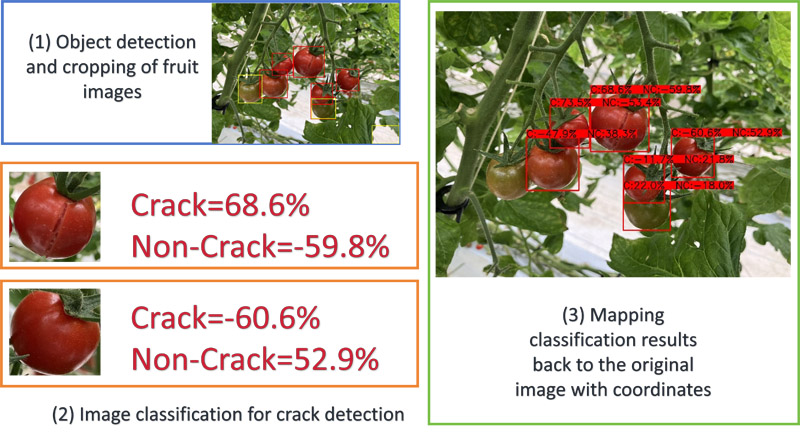
Crack detection via YOLO-Siamese network
1. Introduction
In recent years, Japan’s agricultural sector has faced increasingly severe labor shortages owing to the rapid aging of the farming population and a continuous decline in the number of agricultural workers. According to government forecasts, the total number of farmers is expected to decrease by approximately half by 2030. This poses a serious risk to food production and supply stability. Large-scale greenhouse horticulture, particularly greenhouse tomato cultivation, with planting areas exceeding 1 ha, has steadily expanded to improve productivity and economic efficiency. However, in long-term and multistage cultivation systems, labor costs account for nearly 30% of the total production expenses. This has made labor reduction a critical challenge 1,2,3. Under these circumstances, smart agriculture has been actively promoted as a practical solution for reducing labor dependency and production costs through automation.
Smart agriculture is an agricultural production paradigm that integrates robotics, information and communication technologies, and artificial intelligence to enhance labor efficiency, enable precision management, and achieve high-quality and stable crop production. In recent years, smart agricultural technologies have attracted increasing attention in response to labor shortages and age-related constraints. In tomato production, numerous studies have investigated vision-based fruit detection techniques to support automated harvesting and crop monitoring. These are regarded as essential components of unmanned or minimally manned cultivation systems 4,5,6.
In our previous studies, we developed and experimentally validated an autonomous tomato-harvesting robot using deep learning-based visual detection techniques 7,8,9,10,11. These studies provide the practical background and motivation for the present study. To alleviate the scarcity of annotated training data in agricultural environments, we explored data augmentation using synthetic images generated by compositing transparent tomato images onto farm-scene backgrounds 12. Building on these efforts, in the present study, we adopted a training workflow in which the object detector is first pre-trained on synthetic composite images and then fine-tuned on field-collected samples via transfer learning. This was conducted with the aim of improving the robustness and generalization under diverse real-world conditions.
Cherry tomatoes, which are the focus of this study, are widely cultivated in greenhouse environments. Cracked fruits are one of the major causes of yield loss in cherry tomato production. Sorting of cracked and non-cracked fruits is still largely performed manually, resulting in low efficiency and high labor costs. In our earlier work, You Only Look Once (YOLO) 13-based methods were applied to single-fruit images to localize and recognize crack regions 14. However, crack-centered localization approaches have two limitations. First, cracks are typically small and morphologically irregular, making rectangular bounding-box annotations imprecise. Second, models trained to localize cracks tend to rely on incidental visual cues, such as specular reflections, high-contrast edges, stems, or background textures, rather than the characteristics of the cracks themselves. Consequently, these methods are sensitive to annotation noise and exhibit limited generalizability when applied to field images containing multiple fruits, occlusions, or complex backgrounds. To address data scarcity, we also investigated Siamese-network 15-based few-shot learning for cracked-fruit classification using limited training samples 16.
Motivated by recent studies that used sequential task decomposition strategies 17,18,19, we propose a two-stage recognition framework that combines object detection and image classification for cracked cherry tomato classification. In the first stage, an object detector localizes and crops individual cherry tomatoes from the scene images. In the second stage, an image classification model was used to evaluate each cropped fruit patch to determine whether the fruit had cracked. By formulating cracked-fruit recognition as a fruit-level classification problem rather than a pixel-level crack localization task, the proposed approach leverages global appearance features and contextual information while reducing dependence on unstable crack annotations.
The results show that separating fruit localization and cracked-fruit classification into two sequential tasks enables the proposed framework to effectively and reliably differentiate between cracked and non-cracked cherry tomatoes under real greenhouse conditions. This two-stage strategy supports automated sorting processes and contributes to the development of unmanned and minimally manned tomato cultivation systems.
2. Related Work
In this section, we review prior studies that are relevant to our work, focusing on three key aspects: the use of synthetic data 12, crack detection in tomatoes using YOLO 14, and crack classification based on Siamese networks for few-shot learning 16. These studies form the foundation of our proposed two-stage recognition framework and reflect the limitations of existing approaches under complex real-world conditions.
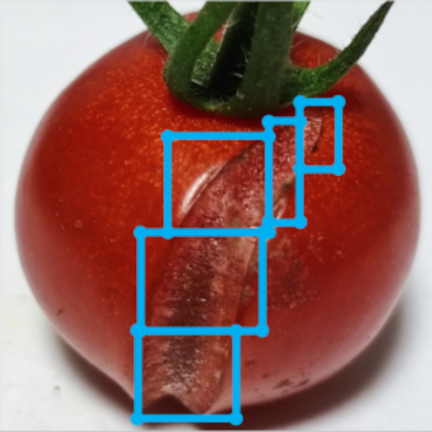
Fig. 1. Multi-part annotation of cracks on a single cherry tomato. The bounding boxes attempt to cover only the crack regions.
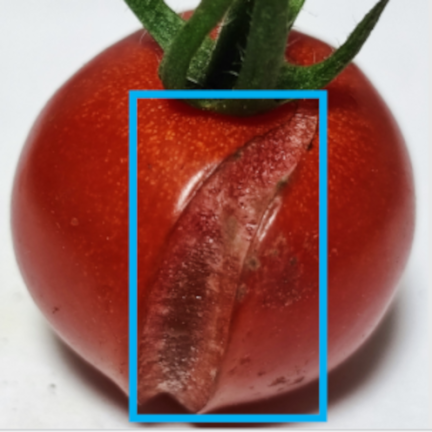
Fig. 2. Whole-crack annotation of a single cherry tomato. The bounding box encompasses the entire crack region.
2.1. Application of Synthetic Data
In deep learning, the model performance is strongly influenced by the quantity and quality of the training data. However, the construction of large-scale high-quality annotated datasets in agricultural environments presents certain challenges. Data acquisition is inherently constrained by seasonal cycles, weather conditions, and field conditions. Agricultural automation requires the recognition of diverse visual targets and attributes, including fruit maturity (such as red and green tomatoes), plant organs (including leaves and stems), and fruit conditions related to quality inspection and crop monitoring, such as normal, abnormal, or defective fruits. Exhaustive annotation of such multi-class and multi-attribute information is labor-intensive and time-consuming, making large-scale manual annotation impractical.
To address these challenges, synthetic data have become increasingly recognized as an effective and practical solution for alleviating annotation bottlenecks. In our previous study, we constructed training datasets for object detection by combining transparent background tomato images with fruit-free farm background images. This approach enables the efficient generation of annotated data and demonstrates initial success in mitigating data scarcity for agricultural object detection tasks.
Nevertheless, reliance on synthetic data alone remains insufficient. Synthetic images often lack adequate diversity in background complexity, illumination variations, and subtle morphological differences between fruits. Therefore, models trained exclusively on synthetic datasets may exhibit degraded performance when deployed in real-world agricultural environments. These limitations motivated the integration of synthetic data with real-field samples through transfer learning, as adopted in this study.
2.2. Crack Detection in Cherry Tomatoes Using YOLO
YOLO is an efficient object detection method widely applied in agricultural scenarios for fruit detection and disease recognition because of its fast and end-to-end detection capability. In our previous study, we explored two approaches for localizing and detecting crack regions in images of a single cherry tomato with a white background. In the first approach, the cracks were divided into multiple parts (Fig. 1), and bounding boxes were used to cover only the cracks. In the second approach, the bounding boxes encompass the entire crack region (Fig. 2). Both methods achieved a high detection accuracy under well-annotated and simple background conditions.
However, these local crack detection methods still have limitations. In the first approach, owing to the irregular shapes of the cracks, the detected parts may not appear in predefined positions, sizes, or counts, making the performance evaluation challenging. In the second approach, cracks occupy only a small portion of the fruit and have irregular shapes. This often leads to imprecise bounding-box supervision and vulnerability to annotation noise. The model may rely on incidental cues, such as reflections, high-contrast edges, stems, or background elements, rather than the cracks themselves. Therefore, the performance deteriorates in real-world images containing multiple fruits, occlusions, or complex backgrounds.
2.3. Cracked-Fruit Classification in Cherry Tomatoes Using Siamese Networks
Few-shot learning methods have attracted considerable attention for scenarios where labeled training data are limited. As a representative few-shot learning architecture, Siamese networks learn differentiated feature embedding and perform classifications based on similarity comparisons, enabling effective learning with a small number of labeled samples.
In our previous work on cherry tomato quality inspection, Siamese networks were applied to the classification of cracked and non-cracked cherry tomatoes using images containing a single fruit placed against a uniform background. The experimental results showed that this approach achieved high classification accuracy under controlled imaging conditions. This confirmed the suitability of Siamese networks for cracked-fruit classification in limited-data settings.
However, the Siamese-based cracked-fruit classification also has limitations. Because the model relies primarily on the global appearance similarity between fruit images, its performance may degrade when cracks are subtle, fruits are partially occluded, or visual interference from stems, calyxes, or neighboring fruits is present. Models trained on single-fruit images with simple backgrounds often fail to generalize to real-world greenhouse scenes containing multiple fruits and complex environmental variations.
Therefore, relying solely on a Siamese network is insufficient to achieve a robust and reliable cracked-fruit classification in practical agricultural environments. This motivates the integration of Siamese-based classification into a two-stage framework in which fruit-level classification is performed only after individual fruits are localized and isolated from complex scene images.
3. Proposed Method
3.1. Problem and Proposed Two-Stage Framework
Object detection and image classification are two complementary approaches for deep visual analysis, each with distinct advantages. Object detection excels at localizing individual objects within complex scenes by providing bounding boxes and coordinates. Meanwhile, image classification focuses on the semantic recognition of cropped images. This often yields a stronger differentiation ability once objects are reliably isolated.
As described in Section 2.2, YOLO-based local crack-detection methods can achieve high accuracy under conditions of sufficient annotations and simple backgrounds. However, in real-world scenarios, cracks typically occupy only a small portion of the fruit and have irregular shapes. Bounding-box supervision may introduce annotation noise, which degrades the detection performance. Models may inadvertently rely on incidental features, such as specular reflections, high-contrast edges, peduncles, or background patterns, thereby limiting their generalization ability in multi-fruit, occluded, or complex environments.
In this study, crack recognition was defined as a fruit-level classification problem, aiming to determine whether a cherry tomato exhibits cracking, that is, cracked or non-cracked fruit, rather than detecting or precisely localizing crack regions on the fruit surface.
For the target application, identifying cracked fruits at the individual fruit level is sufficient, whereas precise crack localization is not a strict requirement.
To address the limitations of local crack detection, as outlined in Section 2.3, Siamese networks enable few-shot learning by modeling the global appearance similarity between fruits. This allowed cracked and non-cracked cherry tomatoes to be distinguished under limited training data conditions. This formulation shifted the focus from unstable pixel-level or local crack annotations to more robust fruit-level visual characteristics.
These global characteristics include visual cues distributed across the entire fruit surface, such as the consistency of the peel texture, global color distribution, and subtle surface deformation patterns that may arise from the internal stress associated with fruit cracking. Contextual cues refer to the spatial relationship between crack-like patterns and the surrounding intact peel; for example, whether such patterns are accompanied by broader texture disruption or color inconsistency rather than appearing as isolated thin lines.
Nevertheless, real-world challenges, including fruit occlusion, complex backgrounds, and multi-fruit scenes, can compromise recognition accuracy when classification is applied to full images without fruit localization.
In our previous study, we applied only object detection for crack recognition. However, its accuracy was insufficient in practical settings. Building on these insights, and inspired by YOLO being commonly applied across diverse scenarios and often being integrated with other models 20,21,22,23, we propose a two-stage recognition framework.
In the first stage, YOLO detects and crops cherry tomatoes from an input image. In the second stage, the cropped fruit patches were classified using the Siamese network, and the classification results were mapped back to the original image (Fig. 3).
By decoupling fruit localization from crack-related decision making, this strategy reformulates crack detection as a whole-fruit classification task rather than relying solely on local crack detection.
By combining object detection with few-shot image recognition, the proposed hierarchical framework improves robustness under complex real-world conditions, while reducing annotation costs and enhancing data efficiency and deployment feasibility.
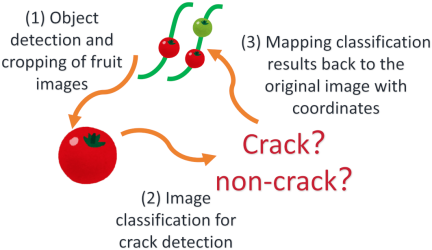
Fig. 3. Workflow of the two-stage recognition framework for cherry tomato crack detection.
3.2. First Stage: Object Detection with YOLO
Object detection was conducted using YOLO, which is a widely used single-stage detector known for its balance between real-time performance and strong feature representation. We used YOLO11l, a large-capacity variant of the YOLO family that retains the end-to-end detection pipeline while providing enhanced representational power. This is advantageous for detecting small objects, such as cherry tomatoes, in cluttered orchard environments.
3.2.1. Training Challenges and the Proposal of Synthetic Data
A major challenge in applying deep learning to cherry tomato detection is the limited availability of annotated field data. In agricultural environments, data collection is constrained by seasonal cycles, weather conditions, and field conditions. Practical agricultural automation requires models to recognize not only the fruits themselves, but also multiple visual attributes, such as fruit maturity (e.g., red and green tomatoes), surrounding plant organs (including leaves and stems), and fruit conditions related to quality inspection and crop monitoring. Constructing large-scale datasets that cover such multi-class and multi-attribute information requires substantial manual effort and is therefore impractical in real-field scenarios.
To alleviate this scarcity, we used synthetic data generation as an effective means of augmenting the training dataset. By generating annotated images in a controlled manner, synthetic data provide sufficient diversity for initial feature learning and form a reliable foundation for model pre-training. However, as discussed in Section 2.1, the models trained exclusively on synthetic data may suffer from domain discrepancies when applied to real-field images.
Transfer learning was employed to address this limitation. Models pre-trained on synthetic data were subsequently fine-tuned using a limited number of real-world samples, enabling effective adaptation to real agricultural environments. Such synthetic pre-training and transfer learning strategies can strongly enhance performance and robustness in agricultural vision tasks, including plant disease recognition and crop inspection 24,25.
3.2.2. Synthetic Data Generation
The synthetic dataset was constructed using a method from our previous study with the primary objective of reducing manual annotation costs and alleviating the limitations of limited real training data. 132 foreground images of cherry tomatoes with transparent backgrounds were prepared, consisting of 60 cracked red cherry tomatoes, 60 uncracked red cherry tomatoes, and 12 green cherry tomatoes. These images were composited into 15 orchard background images to simulate real-field conditions.
The synthesis process was as follows. First, five red and five green cherry tomato foregrounds were selected and overlaid onto orchard background images. The foreground tomatoes were placed at random positions within a fixed spatial range, and random rotation and color saturation adjustments were applied to enhance the appearance diversity. To avoid unrealistic occlusion patterns and preserve visually distinguishable fruit boundaries, the overlapping area between tomatoes was intentionally restricted to less than 20%.
This overlap constraint was designed to reflect the typical observation conditions in real orchard environments, where individual cherry tomatoes within a cluster are usually spatially separated and remain largely visible. During image acquisition, camera viewpoints can often be adjusted to reduce severe occlusions, further limiting extreme fruit overlap.
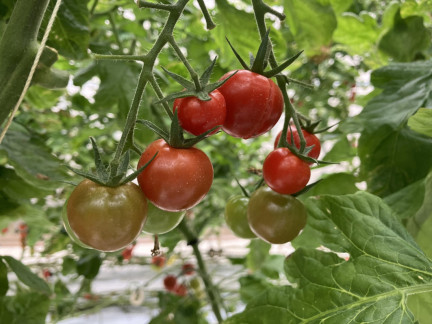
Fig. 4. Example of a real orchard image collected during field data acquisition.
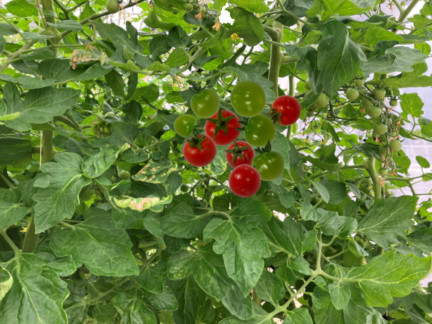
Fig. 5. Examples of synthetic cherry tomato training images.
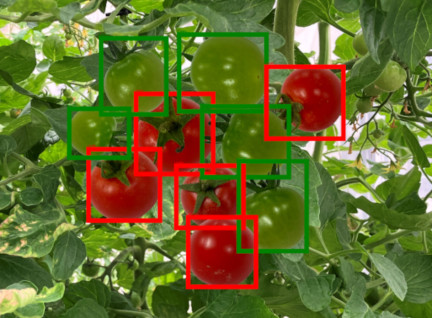
Fig. 6. Annotations corresponding to the synthetic cherry tomato training images.
To support this assumption, a representative real orchard image collected during data acquisition is shown in Fig. 4 as a visual reference. Although partial occlusions occur naturally, most cherry tomatoes maintain discernible boundaries, which are consistent with the overlapping constraints applied in the synthetic data generation process.
To balance the dataset, green tomatoes were reused in cycles until all the red tomato images were exhausted. Through this procedure, 1,800 labeled training samples were generated for each class. Examples of the synthetic images and their corresponding annotations are shown in Figs. 5 and 6, respectively.
The current synthetic data generation strategy primarily models’ fruit-to-fruit overlap and does not simulate complex occlusions caused by stems or leaves. This limitation may reduce the diversity of occlusion patterns compared to real-world conditions. Incorporating stem- and leaf-induced occlusions into synthetic data is expected to enhance realism and improve detector robustness, and is therefore identified as an important direction for future work.
3.2.3. Training Strategy
The training of the YOLO-based cherry tomato detector followed a two-stage strategy consisting of synthetic-data pre-training and real-data transfer learning.
In the first stage, the model was pre-trained exclusively on the synthetic dataset to establish robust initial feature representations for cherry tomato detection. Training was conducted at an initial learning rate of 0.01, following the default configuration of the YOLO framework. The maximum number of training epochs was set to 1,000, and early stopping based on the validation performance prevented overfitting. The training converged early, and the best-performing model checkpoint was automatically saved at epoch 386, which corresponded to the highest validation performance during the synthetic pre-training.
In the second stage, transfer learning was performed using real-world field images to adapt the pre-trained model to real orchard conditions. The pre-trained weights obtained from the synthetic pre-training stage (epoch 386) were used to initialize the model. A lower learning rate of 0.001 was used at this stage to ensure a stable adaptation while reducing the risk of catastrophic forgetting. To further stabilize the optimization process, the backbone network was frozen during the initial 10 epochs, and only the detection head and higher-level layers were updated.
Early stopping was also applied during the transfer learning stage based on the validation performance. The training process was automatically terminated at epoch 203 when the model achieved the best validation results. This checkpoint was selected as the final detection model and used for all subsequent evaluations.
This two-stage training strategy balances rapid feature acquisition from synthetic data with domain adaptation to real-world environments, enabling robust detection performance under limited real-data conditions.
3.3. Second Stage: Image Classification with Siamese Network
3.3.1. Dataset Construction and Preprocessing
In practical agricultural automation systems, visual recognition tasks involve multiple levels of analysis, including fruit maturity assessment, for example, red and green tomatoes, identification of plant organs, such as leaves and stems, and evaluation of fruit conditions related to quality inspection and crop monitoring, such as normal, abnormal, or defective fruits. Classification of fruit condition plays a critical role in automated sorting and postharvest handling.
In this study, we focused on the fruit condition classification and further narrowed the target to the cracked-fruit classification of red cherry tomatoes. All the samples used for Siamese network training and evaluation consisted exclusively of red cherry tomatoes. The classification task was defined at the fruit level rather than at the level of crack regions or crack patterns.
To enable the Siamese network to classify cracked and non-cracked red cherry tomatoes under real-world operating conditions, a few-shot dataset was constructed at the fruit level. Ideally, a large-scale dataset composed entirely of real-field fruit images is preferable for training the classifier. However, owing to the limited availability of annotated real-scene fruit-level samples suitable for Siamese network training, most training samples were derived from the synthetic dataset described in Section 3.2.2, with a small number of real-world samples used as supplementary data.
The pre-trained YOLO-based object detector introduced in Section 3.2 was applied to detect red cherry tomatoes in synthetic images and selected real-scene images. Individual fruit patches were cropped based on the detection results and were used to construct a Siamese training dataset. Ground-truth bounding boxes were not used for cropping the Siamese samples. Instead, all fruit patches were generated based solely on the detection outputs produced by the pre-trained YOLO model. This design choice was made to ensure consistency with the intended deployment scenario in which the classification stage operated only on fruit instances that were successfully detected by the object detector.
The constructed dataset was organized into two categories: cracked and non-cracked red cherry tomatoes (Fig. 7), and further divided into training, validation, and query sets. The training set contained 75 synthetic images and 15 real-world images per class. Meanwhile, the validation set contained 45 synthetic images and five real-world images per class. The query set used the same samples as those in the validation set.
Owing to this dataset construction strategy, the Siamese network inherited the detection bias of the preceding YOLO stage. Fruit instances that were consistently missed by the detector, such as those that were heavily occluded, extremely small, or visually ambiguous, were not included in the Siamese training or evaluation datasets. Therefore, the classification performance of a Siamese network is bounded by the recall in the object detection stage.
This dependency does not constitute a circular training process but rather reflects the system-level constraint of the proposed two-stage framework. In practical operations, fruit condition classification is only required for the detected fruit instances. Therefore, improving the system performance primarily depends on maximizing the detection recall in the first stage. Meanwhile, the Siamese network refines the fruit-condition decisions and suppresses false positives in the second stage.
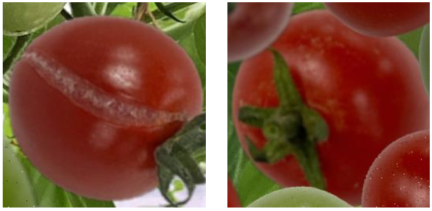
Fig. 7. Cropped image examples of cracked and non-cracked tomatoes used in the Siamese network dataset.
3.3.2. Network Architecture
To extract high-level features from cherry tomato images, ResNet50 pre-trained on ImageNet was used as the backbone network for the initial feature extraction. Based on the output of the backbone, an embedding head was constructed consisting of a global average pooling (GAP) layer, followed by a fully connected dense layer with 512 units, batch normalization, and a dropout layer with a dropout rate of 0.4. Finally, a dense layer was applied to produce a 256-dimensional embedding vector. The resulting embedding representation was used within the Siamese framework and could be directly applied to crack classification or similarity-based retrieval tasks.
3.3.3. Loss Function Design
In the task of classifying cherry tomato cracks under limited sample conditions, the Siamese architecture is a commonly used metric-learning paradigm. A standard Siamese network receives a pair of samples \((x_1, x_2)\), where two weight-sharing branches generate embeddings \(f(x_1)\) and \(f(x_2)\). Using contrastive loss, samples from the same class are pulled closer, while those from different classes are pushed apart. Although intuitive and effective in binary verification tasks, this pairwise constraint is insufficient for complex class boundaries or subtle differences, as it fails to capture relative ordering among samples.
To enhance the embedding differentiation, in this study, we adopted triplet loss. Training is conducted with triplets \((A, P, N)\), where an anchor (\(A\)), a positive (\(P\), same class), and a negative (\(N\), different class) are processed by a shared-weight network (Fig. 8) to obtain embeddings \(f(A)\), \(f(P)\), and \(f(N)\). The triplet loss is defined as
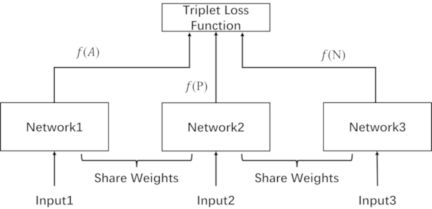
Fig. 8. Triplet-loss–based Siamese network architecture, consisting of three weight-sharing branches (anchor, positive, and negative).
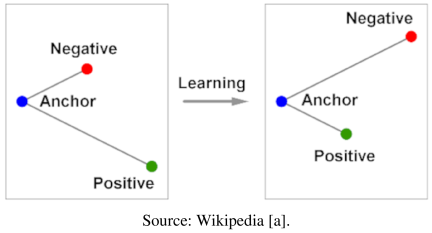
Fig. 9. The triplet loss minimizes the distance between an anchor and a positive, both of which have the same identity, and maximizes the distance between the anchor and a negative of a different identity.
The effectiveness of triplet loss depends heavily on negative sample selection. Easy negatives, where
To balance effectiveness and stability, in this study, we used semi-hard negative mining 26, where the negatives satisfy
The practical procedure is as follows:
-
Compute embeddings for all samples in a batch.
-
For each anchor-positive pair, compute distances to candidate negatives within the batch.
-
Select negatives that satisfy the semi-hard condition, such as the closest one. If none exist, they return to the hardest negative.
-
Construct triplets, compute loss, and backpropagate gradients.
This sampling strategy ensures that each triplet provides meaningful gradients by avoiding trivial samples while mitigating instability from overly difficult samples.
3.3.4. Training Strategy
To ensure that the Siamese network can learn discriminative and robust embeddings with limited real-world data, a staged training strategy was used.
In Stage 1, all the convolutional layers of the ResNet50 backbone were frozen, and only the embedding head (GAP \(\to\) Dense (512) \(\to\) Batch Normalization \(\to\) Dropout \(\to\) Dense (256)) was trained. This stage was designed to rapidly learn task-specific high-level representations, while mitigating overfitting under few-shot conditions. Training was conducted using the Adam optimizer with a learning rate of \(1\times 10^{-4}\), a batch size of 32, and 100 steps per epoch. The maximum number of epochs for this stage was set to ten.
In Stage 2, the latter layers of the ResNet50 backbone are unfrozen and jointly fine-tuned together with the embedding head to further enhance the embedding differentiation and robustness. For stable fine-tuning, the learning rate was reduced to \(1\times 10^{-5}\), while the optimizer configuration remained unchanged. The maximum number of epochs at this stage was set to 90.
Throughout both stages, early stopping based on the validation performance was enabled. The training was automatically terminated when no further improvement was observed. The best-performing model checkpoint was saved at epoch 55, which was selected for all subsequent evaluations.
This two-stage training strategy balances rapid feature adaptation with stable fine-tuning, enabling representation learning and generalization in few-shot crack classification scenarios.
3.3.5. Classification Method
In this study, cracked and non-cracked cherry tomato patches were classified using a Siamese network-based similarity inference framework. During the training stage, the Siamese network is optimized using a distance-based loss function formulated based on the Euclidean distance between the embedding vectors. The Euclidean distance directly measures absolute differences in the feature space and is widely used in metric learning to encourage compact intraclass distributions while enlarging interclass separation. This property makes it well-suited for shaping a stable and discriminative embedding space during representation learning. However, in the inference stage, classification is conducted using cosine similarity rather than Euclidean distance.
The cosine similarity-based decision function is defined as
Cosine similarity ranges from \(-1\) to 1, where 1 indicates identical directions, \(-1\) indicates opposite directions, and 0 indicates orthogonality. Because all the embedding vectors are L2-normalized prior to inference, the cosine similarity evaluates the angular consistency between feature vectors, effectively focusing on semantic similarity rather than feature magnitude.
This distinction is particularly important in real agricultural environments, where variations in illumination, contrast, surface reflectance, and fruit appearance may cause fluctuations in feature magnitudes that are not directly related to crack patterns. In such cases, the Euclidean distance may become overly sensitive to these magnitude variations. Meanwhile, the cosine similarity provides a more robust and stable similarity measure for classification.
The classification procedure is as follows. First, the embedding center vectors for the crack and non-crack classes are precomputed using the query set. Next, each cherry tomato patch detected by YOLO is passed through the trained Siamese network to generate a normalized embedding vector. Finally, the cosine similarity between the input embedding and each class center was calculated, and the class with the highest similarity score was selected as the prediction.
Figure 10 illustrates an example classification result, where the similarity scores for the input sample are crack \(=\) 0.975 and non-crack \(=\) \(-0.328\). Accordingly, the input image is classified as cracked.
Euclidean distance is employed during training to structure the embedding space, whereas cosine similarity is used during inference to achieve robust and semantically consistent classification under real-world appearance variations.
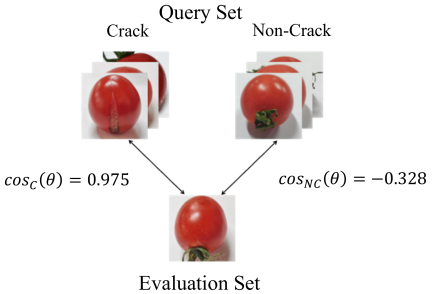
Fig. 10. Example of crack classification using the Siamese network. The similarity scores are 0.975 for the crack class and \(-0.328\) for the non-crack class, resulting in a correct crack prediction.
4. Results
4.1. YOLO Detection Results
An independent test set not used during training was constructed to evaluate the performance of the trained YOLO model under real-world conditions. The test set contained 80 real-world images of 304 annotated red cherry tomatoes and 436 annotated green cherry tomatoes. All the real-world images used in this study were collected at the Nagasaki Agriculture & Forestry Technical Development Center during the same data collection period and captured using the same iPhone camera. The training and test datasets were constructed from distinct images, and no image or fruit instance was shared between the two sets, ensuring strict data independence during the evaluation.
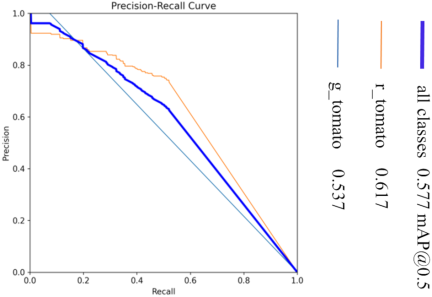
Fig. 11. P–R curves of the YOLO detector trained only on synthetic data, showing limited generalization to real-world test images.
4.1.1. YOLO Detection Results with Synthetic
In this experiment, the YOLO11l model was trained on 360 synthetic images introduced in Section 3.2.2, comprising 1,800 red and 1,800 green cherry tomatoes. The trained model was evaluated using a test set with a confidence threshold of 0.5. According to the P–R curves (Fig. 11), the mean average precision (mAP) was 0.617 for red cherry tomatoes, 0.537 for green cherry tomatoes, and 0.577 overall.
Here, mAP@0.5 follows the standard YOLO/COCO evaluation protocol, where @0.5 denotes a fixed intersection-over-union (IoU) threshold of 0.5. During the mAP computation, the IoU threshold was fixed, whereas the confidence threshold was swept to generate the precision-recall curve.
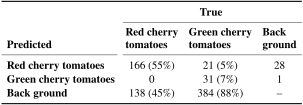
Analysis of the confusion matrix (Table 1) showed that 166 red cherry tomatoes were correctly detected, whereas 138 were missed, corresponding to a detection rate of approximately 55%. Among the green cherry tomatoes, 31 were correctly detected, 21 were misclassified as red, and 384 were missed, resulting in a correct detection rate of approximately 7%. Although the model trained on synthetic data achieved a moderate mAP, its instance-level recall in real-world scenarios was poor, particularly for green cherry tomatoes, highlighting the limitations of generalizing from synthetic to real-world data.
Table 1. Confusion matrix of YOLO detection results trained only on synthetic data (confidence threshold \(=\) 0.5).
4.1.2. YOLO Detection Results with Transfer Learning
Since the model trained solely on synthetic data performed poorly in real-world scenarios, transfer learning was used in this study. Approximately 10% of the original synthetic training data, comprising 1,800 red and 1,800 green cherry tomatoes, were replaced with real-scene images, resulting in 1,620 synthetic and 174 real samples for red cherry tomatoes, and 1,620 synthetic and 206 real samples for green cherry tomatoes. The model was first pre-trained on synthetic data and then fine-tuned using only real-scene samples.
At a confidence threshold of 0.5, the performance of the test set significantly improved. As shown in the P–R curve (Fig. 12), the mAP was 0.886 for red cherry tomatoes, 0.843 for green cherry tomatoes, and 0.864 overall, demonstrating an improvement over the synthetic-only model. The confusion matrix (Table 2) further shows that 275 red cherry tomatoes were correctly detected, with 21 missed tomatoes, comprising an approximately 90% detection rate. Meanwhile, 374 green cherry tomatoes were correctly detected, with 44 missed tomatoes, with an approximately 86% detection rate. Recall and precision were improved for both categories compared with the model trained only on synthetic data.
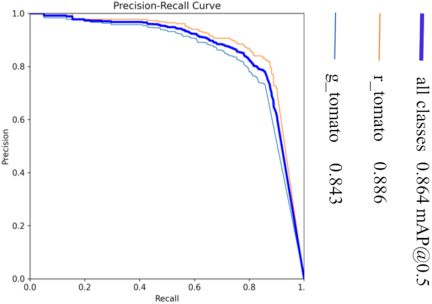
Fig. 12. P–R curves of the YOLO detector with transfer learning, demonstrating significant improvement compared to the synthetic-only model.
Table 2. Confusion matrix of YOLO detection results after transfer learning with partial real-scene data (confidence threshold \(=\) 0.5).
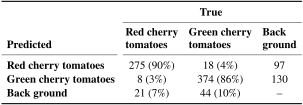
Further analysis using the F1 curve (Fig. 13) showed that optimal performance was achieved when the confidence threshold was set to 0.669. This confidence threshold corresponds to the inference time operating point selected based on the F1 score and is independent of the IoU threshold used for mAP evaluation, which is fixed at 0.5, as described in Section 4.1.1. At this threshold, the P–R curve (Fig. 14) showed mAP values of 0.882 for red cherry tomatoes, 0.816 for green cherry tomatoes, and 0.849 overall. The confusion matrix (Table 3) indicated correct detection rates of approximately 88% and 76% for the red and green cherry tomatoes, respectively. Although the higher threshold slightly reduced the recall compared to the default threshold of 0.5, it filtered out many low-confidence detections, such as blurred fruits, background artifacts, and partially visible objects, leading to more stable detection results under real-world conditions.
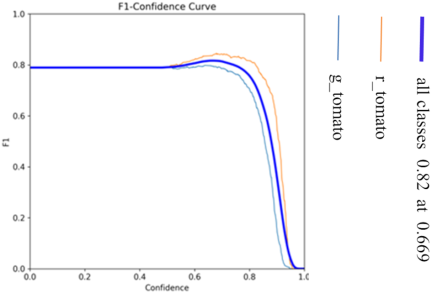
Fig. 13. F1-score curve of the transfer learning model, indicating that the optimal performance is achieved at a confidence threshold of 0.669.
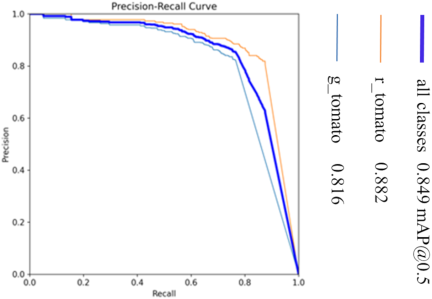
Fig. 14. P–R curves of the transfer learning model at the confidence threshold of 0.669, showing robust performance under real-world conditions.
Table 3. Confusion matrix of YOLO detection results after transfer learning (confidence threshold \(=\) 0.669).
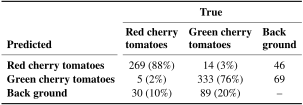
The confidence threshold of 0.669 was determined by maximizing the F1 score on the validation set, which balances precision and recall at a specific operating point. In contrast, the mAP summarizes the detection performance over all confidence thresholds and does not necessarily reflect the suitability of a particular threshold for practical deployment. Although the default threshold of 0.5 yields slightly higher mAP values in Tables 2 and 3, it also introduces a larger number of false-positive detections.
In the context of the proposed two-stage framework, false positives generated at the detection stage are propagated to the subsequent classification stage, increasing unnecessary computational costs and potentially degrading system-level reliability. Therefore, a confidence threshold that balances precision and recall better is more appropriate than one that only maximizes the mAP. By using an optimized threshold of 0.669, the YOLO detector functioned as a more reliable candidate generator, whereas the downstream Siamese network further refined these candidates. This division of roles enables the framework to achieve higher precision and recall at the system level, although the detector alone may not maximize the mAP at this operating point.
4.1.3. YOLO Detection Results with Real-Only Training
To validate the effectiveness of synthetic data pre-training in the proposed transfer learning strategy, an additional baseline experiment was conducted using only real-scene images without any synthetic pre-training. This experiment used the same real-scene training samples as those used in Section 4.1.2, ensuring a fair and controlled comparison. The training set comprised 174 red cherry tomato samples and 206 green cherry tomato samples.
The YOLO model was trained from scratch on this real-only dataset and evaluated using the same independent test set described in Section 4.1. With a confidence threshold of 0.5, the detection performance is summarized by the P–R curves shown in Fig. 15. The resulting mAP was 0.900 for the red cherry tomatoes, 0.798 for the green cherry tomatoes, and 0.845 overall.
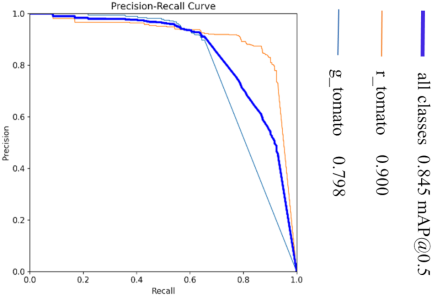
Fig. 15. P–R curves of the YOLO detector trained using real-scene images only.
At first glance, the mAP appears comparable to that achieved by the transfer learning model in Section 4.1.2 (0.864). However, a more detailed examination using confusion matrix-level analysis revealed substantial differences in the class-wise detection behavior.
As shown in Table 4, under the real-only training condition, 284 of 304 red cherry tomatoes were correctly detected, corresponding to a detection rate of approximately 93%. This high performance can be attributed to the strong visual saliency of the red cherry tomatoes, whose color and texture features are distinguishable from those of the background.
By contrast, only 287 of the 436 green cherry tomatoes were correctly detected, yielding a detection rate of approximately 66%. Green cherry tomatoes are visually ambiguous because of their color similarity to the surrounding leaves and stems, making them more difficult to detect under limited training data conditions.
When compared with the transfer learning results in Section 4.1.2, under the same confidence threshold, a clear advantage of synthetic data pre-training becomes evident. Although the detection rate for the red cherry tomatoes remained high and comparable at approximately 90%, the correct detection rate for the green cherry tomatoes increased dramatically from 66% (real only) to 86% (synthetic \(+\) real). This improvement accounts for the higher overall robustness of the transfer learning model, although the difference in the aggregate mAP values appears modest.
Table 4. Confusion matrix of YOLO detection results trained using real-scene images only (confidence threshold \(=\) 0.5).
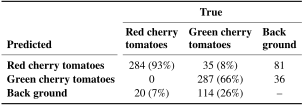
Simultaneously, the influence of synthetic data pre-training on other categories was examined. The recall of the red cherry tomatoes decreased slightly from 93% to approximately 90%. Meanwhile, the confusion between categories was reduced. The proportion of green cherry tomatoes misdetected as red cherry tomatoes decreased from 8% to 4%, indicating an improved differentiation capability between the two classes. Conversely, the proportion of red cherry tomatoes that were misdetected as green cherry tomatoes increased slightly from 0% to 3%. This change was relatively small, and no substantial degradation in the detection performance was observed within the scope of the present experiments.
Although a certain degree of trade-off exists among categories, a substantial improvement in green cherry tomato recall is achieved without an increase in misdetections, and the detection performance across categories remains stable.
Synthetic data pre-training not only affects mAP but also plays a critical role in improving recall and stability for visually challenging categories that are underrepresented or difficult to learn from limited real data alone. Such class-wise improvements are not sufficiently captured by mAP as a single summary metric but are revealed through confusion matrix analysis.
Although training with real images alone can achieve competitive performance for visually salient classes, the incorporation of synthetic data during pre-training substantially enhances the detection reliability for more ambiguous classes, validating the effectiveness of the proposed synthetic-to-real transfer learning strategy.
4.2. Siamese Network Classification Results
This experiment simulated the operation of the proposed two-stage recognition pipeline. First, the YOLO model obtained via transfer learning was used to detect and crop red cherry tomatoes from the test set with a confidence threshold of 0.7. After filtering, 41 crack samples and 273 non-crack samples were obtained, forming the test set for the Siamese network classification.
Table 5. Confusion matrix of crack classification results using the Siamese network.
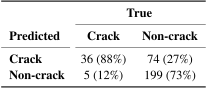
The classification results were as follows (Table 5): 36 out of 41 crack samples were correctly classified, with 5 misclassified (approximately 88% accuracy); for non-crack samples, 199 out of 273 were correctly classified, with 74 misclassified (approximately 73% accuracy). The model demonstrated a strong differentiation performance on crack samples. Meanwhile, non-crack samples exhibited a non-negligible misclassification rate, indicating potential limitations in learning features near class boundaries.
A correct-classification example is shown in Fig. 16, where the similarity score is 71.4% for the crack class and \(-55.2\)% for the non-crack class, leading to a clear correct decision.
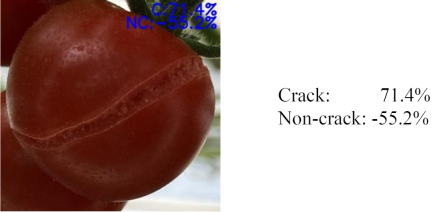
Fig. 16. Example of correct crack classification using the Siamese network. The similarity score for the crack class is 71.4%, while for the non-crack class it is \(-55.2\)%, resulting in a correct crack decision.
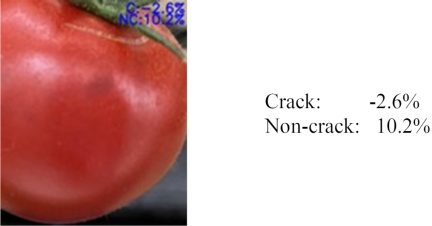
Fig. 17. Example of misclassification caused by overlooked fine calyx-area cracks. The crack score is \(-2.6\)% and the non-crack score is 10.2%, leading to an incorrect non-crack prediction.
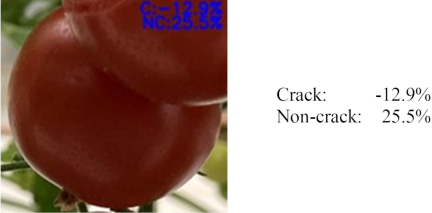
Fig. 18. Example where the main target is non-cracked and peripheral secondary targets are cracked. Theoretically, this image should be classified as cracked, but the model predicts non-crack.
Misclassifications mainly fall into three categories:
-
Fine calyx-area cracks overlooked: As shown in Fig. 17, some crack samples were misclassified as noncracks. In these cases, the crack score is \(-2.6\)% and the non-crack score is 10.2%. Although the non-crack score is not high, the negative crack score indicates the model effectively rejects the crack hypothesis. These errors typically occur when: extremely fine cracks appear around the calyx, suggesting limited sensitivity to subtle features.
-
Interference from edge fruits: As shown in Fig. 18, the main target may appear intact, whereas the peripheral fruits exhibit cracks. Although such images can be considered as crack examples, the model classifies them as noncracks. One possible reason for this is that the training set is predominantly synthetic. Despite some overlaps, most samples ensure the completeness of the main target. Consequently, the model tended to learn whole-target discriminative features and was less sensitive to peripheral interference.
-
Stem/calyx-induced confusions: As shown in Figs. 19 and 20, when stems or calyxes face the camera or partially occlude the fruit, textures or shadows may be mistaken for cracks, causing misclassification. This issue likely arises from insufficient diversity in the training data regarding the stem and calyx appearances.
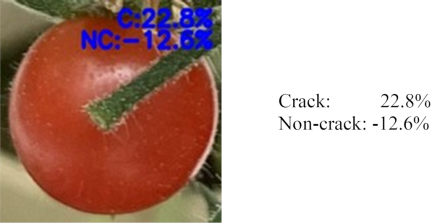
Fig. 19. Example of misclassification caused by a thick stem occluding the fruit.
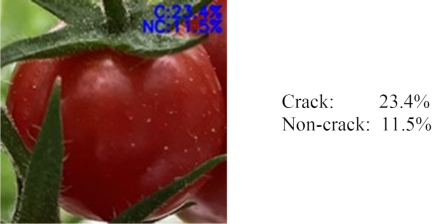
Fig. 20. Example of misclassification caused by occlusion from other calyx parts, where the occlusion was mistakenly identified as a crack.
Because the training dataset is mainly composed of synthetic images that provide relatively complete and centered fruit crops, the Siamese network has learned to focus on whole-fruit discriminative features and, to a certain extent, suppresses edge-based or peripheral interference. This behavior is consistent with the design philosophy of the proposed two-stage, main target-centered recognition framework.
The observed reduction in noncrack accuracy reflects a limitation of the current system rather than a limitation of the whole-fruit classification paradigm itself. This is mainly attributed to the mismatch between the training data distribution and complex real-world visual conditions, particularly those involving stem- or calyx-induced occlusions that are underrepresented in the synthetic dataset.
In the current framework, the system is designed to prioritize the detection of cracked fruits to reduce missed detections, which may negatively affect quality control and market value. However, this design choice leads to a relatively high false-positive rate for non-cracked fruits.
From a practical agricultural perspective, such a high false-positive rate may result in unnecessary economic losses owing to the rejection of healthy fruits. Therefore, this issue should be considered a limitation of the current approach rather than an acceptable trade-off.
Future studies should focus on reducing false positives while maintaining a high recall rate for crack detection. Possible directions include incorporating more diverse real-world training data, improving the feature representation for ambiguous regions, and exploring more advanced classification strategies to enhance the robustness and practicality of the system in real agricultural applications.
4.3. Comparison with Prior Task Formulation
To clarify the motivation for adopting the proposed two-stage pipeline, we provided a comparison with an approach used in our earlier study, in which YOLO was applied to detect crack regions in red cherry tomato images without subsequent fruit-level classification.
This comparison is not intended as a strict model-to-model performance benchmark but rather as an illustration of how different task formulations affect crack recognition outcomes. In the previous approach, crack recognition was treated as a bounding-box detection problem with the aim of localizing the crack regions on the fruit surface.
The results of this formulation are summarized as follows. Of the 41 cracked samples, YOLO detected crack-like regions in 24 cases, producing 27 bounding boxes. However, a considerable portion of these detections correspond to stem textures or specular reflections rather than actual cracks (Fig. 21). YOLO produced 17 false-positive detections for 273 non-cracked samples, most of which were caused by dried stems or surface reflections (Fig. 22). Regional-level crack detection is sensitive to structural artifacts and lighting variations.
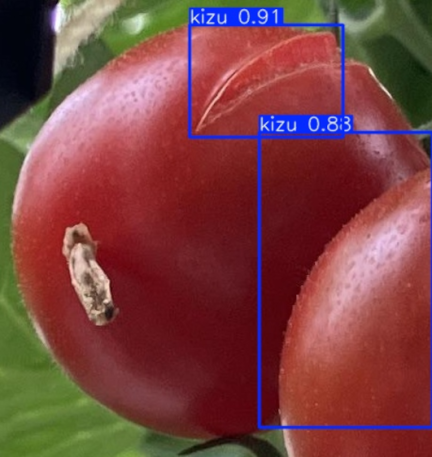
Fig. 21. Examples of false crack detections in cracked samples by YOLO-only (reflections misidentified as cracks).
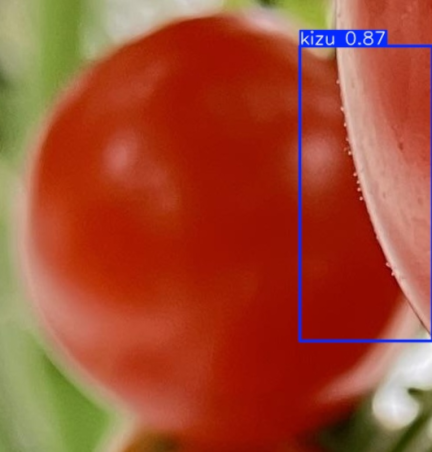
Fig. 22. Examples of false crack detections in non-cracked samples by YOLO-only (dried stems or reflections misidentified as cracks).
This limitation stems from the task formulation itself, rather than from the detection model. In practical applications, precise localization or counting of crack regions is of limited value. The essential requirement is to determine whether a fruit, as a whole, should be regarded as cracked. Therefore, framing crack recognition as a region-detection task introduces unnecessary complexity and increases susceptibility to false positives.
In contrast, the proposed method reformulates crack recognition as a whole-fruit classification problem. YOLO was used solely to ensure reliable fruit detection, after which the Siamese network determined whether the detected fruit was cracked or intact. By shifting the decision from the regional level to the fruit level, the proposed pipeline aligns better with the practical objective of crack inspection and reduces the influence of stem and surface reflections.
This comparison underscores the fact that reformulating crack recognition from region-level detection to fruit-level classification is a key factor in achieving a practical and robust inspection framework for cherry tomatoes.
Although the analysis highlights the limitations of region-based crack detection, it does not provide a direct comparison with standard baseline approaches. Additional experimental comparisons are presented in the following sections.
4.4. Comparison with Single-Stage Baseline Methods
To further validate the effectiveness of the proposed two-stage framework, additional experiments were conducted for comparison with single-stage baseline approaches based on YOLO. All the methods were evaluated on the same test set. The results were reported at the confidence threshold corresponding to the maximum F1-score for each model to ensure a fair comparison.
In this study, two YOLO-only baseline configurations were considered. The first configuration treats crack recognition as a two-class detection problem by directly detecting cracked red cherry tomatoes and non-cracked red cherry tomatoes. The second configuration extended this formulation to a three-class detection problem by including green cherry tomatoes in a separate category.
The inclusion of green cherry tomatoes in Baseline 2 was motivated by the proposed two-stage framework. In the proposed method, the YOLO model was first trained to detect both red and green cherry tomatoes, after which crack classification was applied only to the detected red fruits. Therefore, introducing green cherry tomatoes as an additional class in the YOLO-only baseline ensured that the detection task complexity was comparable, enabling a more consistent and fair evaluation across the different approaches. This design also reflects practical agricultural scenarios, in which multiple fruit types coexist within the same image.
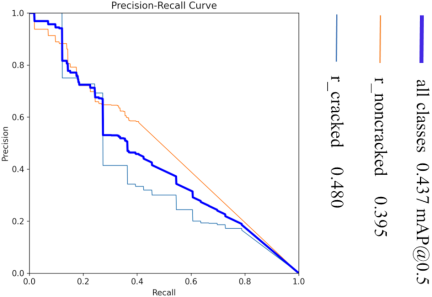
Fig. 23. P–R curves of the YOLO-only baseline (two-class configuration) at the confidence threshold of 0.38, showing performance for cracked and non-cracked red cherry tomatoes.
The following configurations were evaluated:
Baseline 1: YOLO only (cracked red cherry tomatoes and non-cracked red cherry tomatoes).
Baseline 2: YOLO-only (cracked red cherry tomatoes, non-cracked red cherry tomatoes, and green cherry tomatoes).
Proposed method: YOLO (red cherry tomatoes, green cherry tomatoes) \(+\) Siamese network (crack/noncrack classification).
The performance of Baseline 1 is presented in Fig. 23 and Table 6. The detection performance was relatively low (mAP \(=\) 0.437), and severe confusion between the cracked and non-cracked classes was observed. Many non-cracked samples were misclassified as cracked, indicating that the model struggles to learn fine-grained differentiation features when crack recognition is directly formulated as a detection problem.
Table 6. Confusion matrix of the YOLO-only baseline (two-class configuration) at the confidence threshold of 0.38.
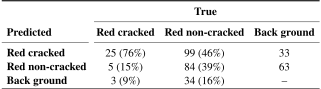
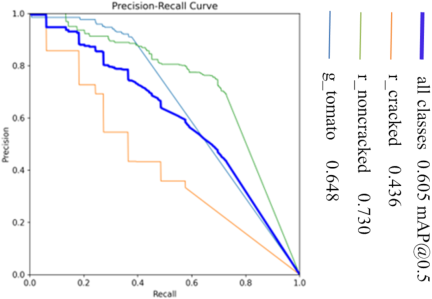
Fig. 24. P–R curves of the YOLO-only baseline (three-class configuration) at the confidence threshold of 0.56, showing performance for cracked red, non-cracked red, and green cherry tomatoes.
Table 7. Confusion matrix of the YOLO-only baseline (three-class configuration) at the confidence threshold of 0.56.
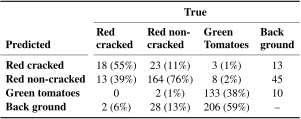
The performance of Baseline 2 is presented in Fig. 24 and Table 7. By introducing green cherry tomatoes as an additional class, the detection performance improved (mAP \(=\) 0.605), and the classification of non-cracked samples became more stable. However, the recall of cracked samples decreased compared to Baseline 1. This suggests that increasing task complexity leads to a trade-off in detecting visually subtle crack features.
A more detailed comparison based on confusion matrices further highlights these differences. In Baseline 1, a substantial number of non-cracked samples were incorrectly classified as cracked, indicating severe class confusion. In Baseline 2, although the classification of non-cracked samples improved, the detection of cracked samples became less reliable. This suggests that the capacity of the model was distributed across more categories and thus less focused on fine-grained crack features.
In contrast, the proposed two-stage method achieved a crack recall of 88% (Table 5), which was higher than those of Baseline 1 (76%) and Baseline 2 (55%). Meanwhile, the classification performance for the non-cracked samples remained comparable to that of Baseline 2. Therefore, the proposed method provides a better balance between detecting cracked samples and avoiding excessive misclassifications.
The direct incorporation of crack recognition into the YOLO detection framework has certain inherent limitations. In the two-class setting, the model suffers from severe confusion between cracked and non-cracked samples. Meanwhile, in the three-class setting, increased task complexity reduces the crack detection performance. In contrast, the proposed two-stage approach separates fruit localization and fine-grained crack recognition, allowing the Siamese network to focus on subtle differences in appearance between cracked and intact fruits.
This task decomposition strategy has been demonstrated to enhance crack-detection performance while preserving stable classification performance. Consequently, the complexity of the proposed framework demonstrates its superiority in practical crack inspection tasks.
5. Conclusion and Future Work
This paper proposes a two-stage recognition framework for fruit-level crack classification in cherry tomatoes. In the first stage, a YOLO-based object detector was used to localize whole fruits in the scene images. In the second stage, a Siamese network is used to classify the cropped fruit images into cracked and non-cracked categories. The YOLO detector was pre-trained on synthetic images and fine-tuned using a limited set of real-scene samples, achieving an mAP of 0.849 at a confidence threshold of 0.669, with consistently high recall across categories. Based on the detected fruit instances, the Siamese network further classified the fruit conditions, achieving recognition accuracies of approximately 88% for cracked fruits and 73% for non-cracked fruits.
The proposed two-stage framework addresses the limitations of crack region-based approaches by redefining crack detection as a whole-fruit classification task. This formulation reduces the dependence on unstable crack localization and mitigates the influence of incidental visual factors, such as stems, specular reflections, and partial occlusions. By leveraging global fruit-level appearance features, the proposed method effectively integrates object detection with few-shot image classification, enabling robust performance under complex real-world conditions.
From a practical perspective, the complete two-stage inference process requires approximately 0.5–1.0 s per image under GPU-accelerated conditions. While the current study focuses on algorithmic validation rather than deployment on robotic platforms, this inference speed is acceptable for automated sorting and low-frame-rate agricultural perception tasks and suggests potential feasibility for future robotic applications after further optimization.
In this study, we validated the effectiveness and applicability of a hierarchical two-stage recognition framework for cherry tomato crack classification, providing a reproducible and practical solution for real-world agricultural applications. Future work will focus on improving classification robustness under occlusion through occlusion-aware data augmentation and attention-based or region-aware strategies and on extending the framework to support a wider range of fruit condition categories, such as maturity stages and other abnormal or defective states, toward more comprehensive fruit-level perception in smart agriculture.
Acknowledgments
We express our profound gratitude to Ryuki Ogawauchi and Riho Tasaki of the Nagasaki Agriculture & Forestry Technical Development Center for their invaluable contributions to this research. Their guidance and assistance with the data collection were instrumental in the success of this study. This study was supported by JSPS KAKENHI Grant Number JP23K05475.
- [1] M. Yamada, “Emergence of large-scale greenhouse farms as a main figure of protected cropping in Japan,” Research Bulletin of the Aichi-ken Agricultural Research Center, Vol.40, pp. 1-7, 2009 (in Japanese).
- [2] H. Okada, M. Tada, and Y. Sakai, “Necessity of the automation in a large-scale greenhouse (plant factory),” Plant Environmental Engineering, Vol.23, No.2, pp. 44-51, 2011 (in Japanese). https://doi.org/10.2525/shita.23.44
- [3] H. Ohmori, H. Kurosaki, Y. Iwasaki, and M. Takaichi, “Development of a robotic harvesting system for tomato clusters with low-node-order pinching and high-density planting (Part 1): Robot for harvesting tomato clusters,” J. of the Japanese Society of Agricultural Machinery and Food Engineers, Vol.77, No.2, pp. 113-121, 2015 (in Japanese).
- [4] T. Fujinaga, S. Yasukawa, and K. Ishii, “Tomato growth state map for the automation of monitoring and harvesting,” J. Robot. Mechatron., Vol.32, No.6, pp. 1279-1291, 2020. https://doi.org/10.20965/jrm.2020.p1279
- [5] T. Yoshida, T. Fukao, and T. Hasegawa, “Fast detection of tomato peduncle using point cloud with a harvesting robot,” J. Robot. Mechatron., Vol.30, No.2, pp. 180-186, 2018. https://doi.org/10.20965/jrm.2018.p0180
- [6] J. Liu, “Tomato yield estimation based on object detection,” J. Adv. Comput. Intell. Intell. Inform., Vol.22, No.7, pp. 1120-1125, 2018. https://doi.org/10.20965/jaciii.2018.p1120
- [7] M. Goto, T. Ikeda, M. Sato, S. Furuno, and F. Nagata, “Evaluation of a hand approach method for a harvesting robot using a 4-DOF arm,” The 28th Int. Symp. on Artificial Life and Robotics 2023, pp. 1201-1204, 2023.
- [8] M. Goto, T. Ikeda, M. Sato, S. Furuno, and F. Nagata, “Experiments of approach posture to divided virtual grid space in work space on automatic harvesting robot,” The 29th Int. Symp. on Artificial Life and Robotics 2024, pp. 1189-1192, 2024.
- [9] T. Ikeda, R. Fukuzaki, M. Sato, S. Furuno, and F. Nagata, “Tomato recognition for harvesting robots considering overlapping leaves and stems,” J. Robot. Mechatron., Vol.33, No.6, pp. 1274-1283, 2021. https://doi.org/10.20965/jrm.2021.p1274
- [10] K. Morita, T. Ikeda, M. Sato, S. Furuno, and F. Nagata, “Categorizing the work area for an autonomous robot harvesting the tomato,” The 29th Int. Symp. on Artificial Life and Robotics 2029, pp. 1193-1196, 2024.
- [11] T. Ikeda, K. Morita, M. Sato, S. Furuno, and F. Nagata, “Experiment on changing harvesting order based on ranking of harvesting areas for a tomato harvesting robot,” The 30th Int. Symp. on Artificial Life and Robotics 2025, pp. 1511-1515, 2025.
- [12] Z. Tan, M. Sato, H. Isokane, T. Shibata, and Y. Kitajima, “Research on tomato fruit recognition by deep learning using virtual data,” Proc. of the 2023 JSME Conf. on Robotics and Mechatronics, Article No.2A2-A23, 2023 (in Japanese). https://doi.org/10.1299/jsmermd.2023.2A2-A23
- [13] J. Redmon, S. Divvala, R. Girshick, and A. Farhadi, “You only look once: Unified, real-time object detection,” 2016 IEEE Conf. on Computer Vision and Pattern Recognition, pp. 779-788, 2016. https://doi.org/10.1109/CVPR.2016.91
- [14] M. Sato et al., “Development of an AI-based detection system for cherry tomato skin splitting and cracking,” 13th Int. Conf. on Renewable Energy Research and Applications, pp. 1736-1739, 2024. https://doi.org/10.1109/ICRERA62673.2024.10815464
- [15] G. Koch, R. Zemel, and R. Salakhutdinov, “Siamese neural networks for one-shot image recognition,” Proc. of the 32nd Int. Conf. on Machine Learning, 2015.
- [16] Z. Tan et al., “Comparative analysis of AI-based methods for crack detection in cherry tomatoes,” The 30th Int. Symp. on Artificial Life and Robotics 2025, pp. 1476-1481, 2025.
- [17] J. Zhou, B. Li, and Y. Tang, “Chinese person name disambiguation based on two-stage clustering,” J. Adv. Comput. Intell. Intell. Inform., Vol.20, No.5, pp. 755-764, 2016. https://doi.org/10.20965/jaciii.2016.p0755
- [18] T. Ishizawa and T. Danjo, “Verification of a two-stage slope condition estimation method using real-time monitoring records of a rainfall-induced landslide,” J. Disaster Res., Vol.20, No.5, pp. 673-684, 2025. https://doi.org/10.20965/jdr.2025.p0673
- [19] A. Fukuda, S. Kondo, K. Maruyama, K. Suzuki, and M. Hagiwara, “A pseudo data generation method and a two-stage quantitation method for simultaneous determination sensor of nucleotide derivatives,” J. Adv. Comput. Intell. Intell. Inform., Vol.11, No.7, pp. 751-758, 2007. https://doi.org/10.20965/jaciii.2007.p0751
- [20] T. Doi, A. Mizuta, and K. Nagumo, “Harmful animal detection using visual information for wire-type mobile robots,” J. Robot. Mechatron., Vol.37, No.3, pp. 742-751, 2025. https://doi.org/10.20965/jrm.2025.p0742
- [21] S.-Y. Fu, D. Wei, and L.-Y. Zhou, “Improved YOLOv8-based algorithm for detecting helmets of electric moped drivers and passengers,” J. Adv. Comput. Intell. Intell. Inform., Vol.29, No.2, pp. 349-357, 2025. https://doi.org/10.20965/jaciii.2025.p0349
- [22] H. Yan, S. S. Merajuddin, and M. Zhang, “Real-time fire detection in scenic spot using convolutional neural network,” J. Adv. Comput. Intell. Intell. Inform., Vol.29, No.2, pp. 432-437, 2025. https://doi.org/10.20965/jaciii.2025.p0432
- [23] I. R. S. Evangelista et al., “Detection of Japanese quails (Coturnix japonica) in poultry farms using YOLOv5 and Detectron2 Faster R-CNN,” J. Adv. Comput. Intell. Intell. Inform., Vol.26, No.6, pp. 930-936, 2022. https://doi.org/10.20965/jaciii.2022.p0930
- [24] J. Chen et al., “Using deep transfer learning for image-based plant disease identification,” Computers and Electronics in Agriculture, Vol.173, Article No.105393, 2020. https://doi.org/10.1016/j.compag.2020.105393
- [25] W. Liu, S. Chen, and L. Wei, “Improving street object detection using transfer learning: From generic model to specific model,” J. Adv. Comput. Intell. Intell. Inform., Vol.22, No.6, pp. 869-874, 2018. https://doi.org/10.20965/jaciii.2018.p0869
- [26] F. Schroff, D. Kalenichenko, and J. Philbin, “FaceNet: A unified embedding for face recognition and clustering,” 2015 IEEE Conf. on Computer Vision and Pattern Recognition, pp. 815-823, 2015. https://doi.org/10.1109/CVPR.2015.7298682
- [a] Wikipedia, “Triplet loss.” https://en.wikipedia.org/wiki/Triplet_loss [Accessed May 25, 2026]
This article is published under a Creative Commons Attribution-NoDerivatives 4.0 Internationa License.