
Paper:
Conjunctive Use of Two Bony Features’ Kinematic Information to Estimate Dynamic Gait Stability
Haoyun Peng*, Shogo Okamoto*
 , and Yasuhiro Akiyama**
*Department of Computer Science, Tokyo Metropolitan University
6-6 Asahigaoka, Hino, Tokyo 191-0065, Japan
**Department of Mechanics and Robotics, Shinshu University
3-15-1 Tokita, Ueda, Nagano 386-8567, Japan

Margin of stability (MoS) is a metric used to assess an individual’s dynamic postural stability during walking. It can identify those at risk of falling and enhance their awareness of preventive measures. Although accurately computing the MoS requires capturing the motion of the entire body, previous research has shown that the kinematic information, specifically the three-axial translational velocities of a single bony feature, can estimate the MoS value to some extent. Such information can be obtained from an inertial measurement unit installed in portable devices such as smartphones and smartwatches. Nowadays, it is common for individuals to have two or more such devices. The primary objective of this study is to determine which combination of data from two or three bony features can most accurately predict the MoS. We used a camera-based kinematic database of healthy Japanese walkers, selecting gait data from 30 male and 30 female participants aged 60 and above. The analysis method involved principal motion analysis, a linear predictive model for multi-dimensional time-series data, to predict the MoS, and used cross-validation for stable model assessment. The results exhibited that combining two bony features generally outperform single features, and the combination of the sacral crest and T10 vertebra was the most effective in predicting MoS with an RMSE of 0.0070 m, followed by the combination of the sacral crest and right toe. We did not find any evidence that the combination of three bony features would result in substantially better accuracy than that of two features. This finding suggests that if IMU-equipped devices are placed on these two body parts, they could better assess their risk of falling.
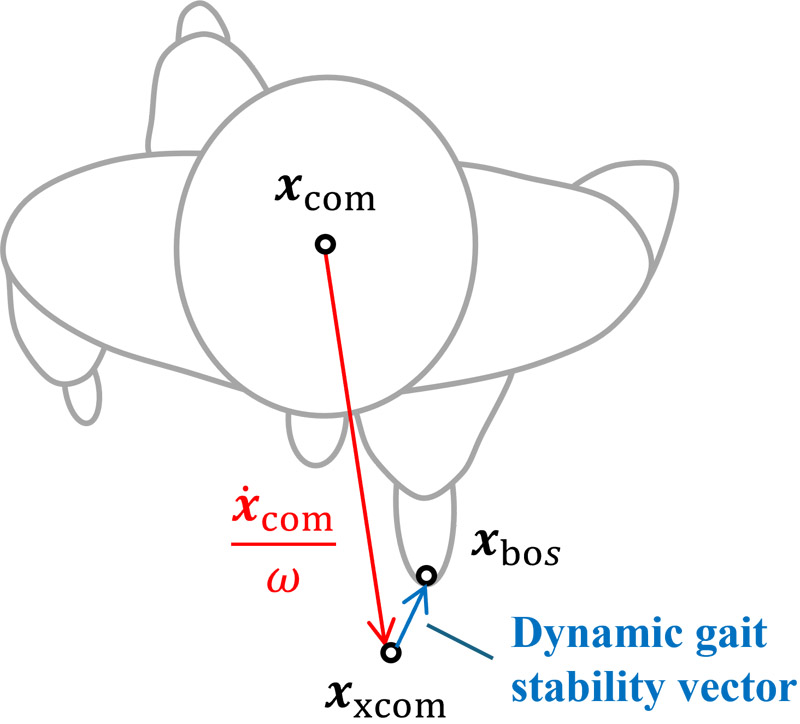
Prediction of dynamic gait stability
1. Introduction
Walking is an essential part of daily life for people of all ages; however, older adults tend to be exposed to the risk of falling 1,2. Falls are one of the most common and dangerous occurrences among the elderly, often leading to severe injuries. They frequently require medical intervention, which can result in prolonged hospital stays and, in the most severe cases, even fatalities. Statistics indicate that 30% to 60% of older adults in the USA experience at least one fall annually, with up to 20% suffering from injuries requiring hospitalization or intensive medical care 3. In many cases, falls lead to a drastic reduction in mobility, independence, and overall quality of life.
The socio-economic impact of falls is profound. In western healthcare systems, it is estimated that between 0.85% and 1.5% of total healthcare expenditures are allocated to addressing fall-related consequences, including treatment, rehabilitation, and long-term care 4. Therefore, early detection of fall risk and the implementation of proactive preventive measures 5,7,6 are essential not only for reducing healthcare costs but also for ensuring a higher quality of life for older adults.
In earlier research on postural stability, particularly during static standing, the distance between the center of mass (CoM) and the edge of the base of support (BoS) is focused as a primary metric for assessing stability 9,8,11,10. However, this approach is limited when applied to dynamic activities like walking. During walking, the CoM constantly moves in forward and mediolateral directions, making it necessary to consider not only the position but also the velocity of the CoM. Recognizing this aspect, Hof et al. introduced the concept of the margin of stability (MoS) 13,12, a measurement that incorporates both the position and velocity of the CoM relative to the BoS. This innovative metric has since become widely adopted in studies aimed at evaluating and quantifying gait stability during walking 18,19,17,15,14,16. Among a variety of stability indices 20,21, the MoS is known as a metric with construct and concurrent validity 22,23.
To develop effective fall prevention strategies, continuous and reliable monitoring of an individual’s risk of falling is necessary. One promising approach involves using inertial measurement units (IMUs), to track body movement in real-time. These devices can collect kinematic data from different parts of the body and provide insights into gait patterns and stability. Hence, researchers investigated methods to assess fall risks using IMUs 29,24,26,27,30,28,25. Nonetheless, these studies did not address MoS values. In contrast, Akiyama et al. 31 predicted the MoS levels—high or low—using five or six IMUs worn on the body. They employed a convolutional neural network to estimate the MoS from tri-axial acceleration data, achieving over 90% accuracy in binary classification for both forward and lateral directions. However, their study did not predict the MoS values and examine the impact of the number of IMU sensors on prediction accuracy.
There is no established criterion for the desired accuracy in MoS estimation. However, a meaningful approach is to identify individuals at increased risk by classifying MoS values based on the statistical distribution of the population. For normally distributed variables, values within the range of the mean \(\mu\) plus or minus one standard deviation \(\sigma\) are considered typical. In contrast, values beyond \(\mu - 2\sigma\) fall into the lowest 2.5% of the distribution and may indicate a high-risk condition. Since lower MoS values reflect reduced stability (as discussed in Section 2.3), accurate detection of these low values is critical. Therefore, achieving an estimation error within or below the standard deviation of the MoS distribution is a reasonable benchmark for practical use. According to Kuroda et al. 32, the standard deviation of MoS is approximately 1.0 cm in the mediolateral direction. These values serve as reference points for the accuracy target of the proposed MoS estimation method.
Previous research has demonstrated that kinematic data collected from the sacral crest—a bony area near the lower back—offer the highest accuracy for estimating the MoS 33. As such, IMU sensors placed at this location can provide reliable predictions of fall risk, making it an accessible method for monitoring individuals in their daily lives.
In modern society, most individuals routinely carry one or two devices equipped with IMU sensors—such as smartphones or smartwatches—throughout the day. The widespread use of these wearable devices presents an opportunity for continuous monitoring and assessment of fall risk. While the sacral crest has been recognized as a valuable site for estimating postural stability, combining kinematic data from multiple body parts may further enhance prediction accuracy. Importantly, higher prediction accuracy enables more sensitive detection of postural instability, earlier intervention, and better individual risk stratification in real-world settings. Moreover, identifying the most informative and complementary sensor placements allows developers to optimize wearable system designs, reducing redundancy while maintaining high performance. This study investigates whether pairing the sacral crest with additional body regions can improve the accuracy and robustness of fall risk estimation. By evaluating the effectiveness of various two- and three-point combinations, we aim to propose practical configurations that balance sensor count and accuracy.
This study builds upon the authors’ previous work 34, which examined combinations of two bony features for predicting the MoS. Here, we employ a statistically more robust approach—namely, cross-validation—to derive more generalizable conclusions. In addition, we investigate the prediction performance of three-feature combinations. In this study, an open-access gait database was used, containing gait motions of healthy individuals recorded with a video-based motion capture system. It should be noted that the motion data were not recorded using IMUs. However, the translational velocities of the feature points used for MoS prediction in this study can also be obtained through IMU sensors. Therefore, the findings are not limited to video-based systems but provide generalizable insights applicable to IMU-based gait analysis as well.
2. Materials and Methods
2.1. Gait Database
In our study, we utilized an open gait database from National Institute of Advanced Industrial Science and Technology (AIST) a, which has gained widespread recognition and use within the research community for analyzing human gait 32,38,37,35,36. Healthy participants in the database walked barefoot at a comfortable, self-selected speed along a 10-meter straight line, allowing for the collection of natural and realistic walking patterns. The three-dimensional position data of reflective markers, attached to key anatomical landmarks on the participants’ bodies, were recorded using an optical motion-capture system at a sampling frequency of 200 Hz.
Given the increased risk of falls among the elderly 1,5, particularly in their daily lives, our study specifically focused on this population group. To that end, we randomly selected 30 females and 30 males, all aged over 60, from the AIST database. Each participant’s gait was analyzed across five full gait cycles, starting from when the left heel made contact with the ground and ending when the left heel contacted the ground again. This provided a consistent basis for comparison across all participants. In total, we analyzed 300 gait cycles (60 participants \(\times\) 5 cycles per participant).
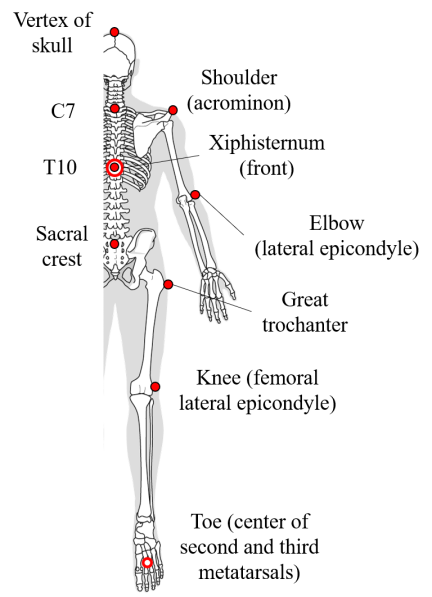
Fig. 1. Bony features examined in the study. Open circles indicate the feature points on the frontal side. Adapted from 33.
2.2. Investigated Bony Features
In our study, we selected 10 key body feature points 33 with red markers in Fig. 1 for gait analysis. These points included the vertex of the skull, located at the top of the head, and the right shoulder (acromion), positioned at the outermost part of the shoulder blade. Additionally, we used the C7 vertebra, a prominent point in the neck region, and the xiphisternum, which is the lower part of the sternum in the upper abdomen. The T10 vertebra, located in the mid-back, was also selected, along with the right elbow (lateral epicondyle), the bony prominence on the outer part of the elbow. Other points included the sacral crest between the left and right posterior superior iliac spines, the right hip (greater trochanter), the right knee (femoral lateral epicondyle), and the right toe (center of the second and third metatarsals). We aimed to cover major body regions, from the toes to the skull, using these 10 points.
We prioritized feature points that were located close to the CoM and at the edges of the BoS, as these are referred to for computing the MoS. The sacral crest, T10 vertebra, and xiphisternum, all available in the AIST gait database, were selected as representative points close to the CoM. To represent the edge of the BoS, we selected the toe, which was located at the center of the second and third metatarsals, as this point is near the edge of the base of support. In addition to these, we included the hip (greater trochanter) and knee as intermediate points between the CoM and the BoS, providing additional insight into the dynamics of the body’s movement during each gait cycle.
As many commercially available smartwatches are equipped with IMUs, the forearm was identified as a practical measurement site. Consequently, the right elbow was selected due to its accessibility and ease of measurement. Notably, wrist data were unavailable for some participants in the database. The vertex of the skull was also included, as an IMU sensor could be attached to a cap or helmet, making it a viable location for capturing head movement. Additionally, the C7 vertebra and right shoulder were included as reference points; however, these locations are less practical for IMU attachment. The C7 is positioned on the back, making it difficult for a walker to secure the device, while the shoulder lacks a sufficiently flat surface for stable attachment. Importantly, for the shoulder, elbow, knee, and toe, the side of the body (right or left) does not significantly affect the final results 33. Thus, measurements were consistently taken from the right side to maintain uniformity.
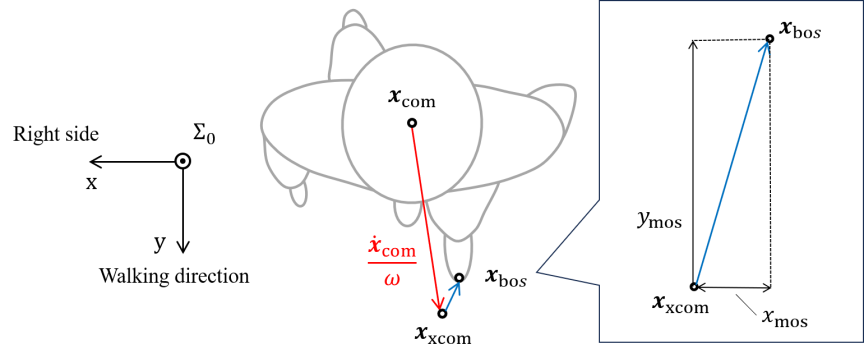
Fig. 2. Margin of stability on \(x\)-\(y\) plane. Distance between the predicted future position of the center of mass (\(\boldsymbol{x}_{\mathrm{xcom}}\)) and the boundary of the base of support (\(\boldsymbol{x}_{\mathrm{bos}}\)). \(\boldsymbol{x}_{\mathrm{com}}\) is the center of mass. Adapted from 33.
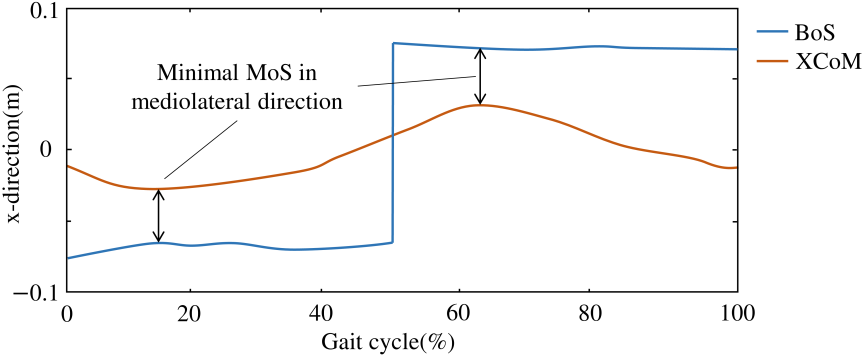
Fig. 3. Margin of stability and changes in the extended center of mass (XCoM) and boundary of the base of support (BoS) in mediolateral direction.
2.3. Margin of Stability
The MoS 13,12 is a metric used to assess walking stability and evaluate fall risk during gait, providing insights into the likelihood of losing balance. As shown in Fig. 2, MoS can be calculated in multiple directions, including anterior-posterior and mediolateral. This study focuses on the mediolateral (\(x\)-axial) MoS, primarily because it has been more commonly analyzed in previous research due to its clearer biomechanical interpretation and strong association with sideways falls 20. While the interpretation of anterior-posterior MoS is more nuanced and somewhat debatable during steady walking, it remains a meaningful index for postural control. In particular, a low posterior MoS may indicate an increased risk of backward falls 39,41,40, especially among individuals with pathological gait. Furthermore, anterior-posterior MoS reflects how effectively forward momentum is managed by subsequent foot placement. Although not addressed in this work, future extensions of our method may explore the estimation of anterior-posterior MoS using similar sensor configurations.
MoS is defined as the distance between the predicted future position of the CoM (XCoM) and the boundary of the BoS. The CoM is located above the pelvis 42,44,43 and was defined as the midpoint between the left and right anterior superior iliac spines and posterior superior iliac spines. The BoS refers to the area formed by the contact between the feet and the ground. Its boundary was defined at the midpoint between the second and third metatarsal heads.
The position vector of the XCoM on the \(x\)-\(y\) plane, which is parallel to the ground, is defined by the following equation:
Figure 3 exemplifies the changes in XCoM and the boundary of BoS in the mediolateral direction over a complete gait cycle. In this study, we define the start of the gait cycle (0%) as when the left heel contacts with the ground. The right foot then touches the ground at approximately 50%, and the left foot makes contact again at the end of the cycle (100%). This entire sequence represents one gait cycle. The moment in the gait cycle when the XCoM approaches the lateral boundary of the BoS—that is, the edge of the stance foot in the direction of XCoM motion—corresponds to a reduced MoS, indicating a phase of increased susceptibility to imbalance or falling under the MoS framework 13,12. Such critical phases typically occur at approximately 10% and 60% of the gait cycle 32. Therefore, when evaluating mediolateral MoS, the minimum value is commonly used as an indicator of stability 22,32,45,46. In this study, we also focus on the minimum mediolateral MoS values. Alternatively, it is also common to evaluate MoS at the timing of heel strike 31,47,48. Regardless of the specific timing used to calculate MoS, a larger mediolateral MoS indicates a greater margin for maintaining balance in the mediolateral direction.

Fig. 4. Schematic of the principal motion analysis. A motion sample, consisting of time-series tri-axial translational velocities, is decomposed into several principal motions. The three colored curves represent the tri-axial velocities of a specific bony feature.
Mediolateral MoS is defined as:
2.4. Principal Motion Analysis
Principal motion analysis (PMA) is a supervised learning algorithm used for the analysis of multidimensional time-series data 49, particularly useful for capturing redundant and synergetic movement patterns in tasks such as walking.
PMA is a time-series expansion of partial least squares method and identifies common factors or synergies among multiple variables, called principal motions, which represent the fundamental components of the motion data across different individuals or samples. These principal motions can be linearly combined to approximate the entire gait cycle for any given walking sample. Each principal motion also presents multidimensional time-series data. The normal gait of healthy individuals can be expressed by a few principal motions (e.g., three) 33,50,51.
As shown in Fig. 4, we used triaxial velocities in one gait cycle as the explanatory values, and the minimum medial-lateral MoS in that gait cycle as the objective variable. The time-series data of triaxial velocities in a sample is decomposed into multiple principal motions, each of which is weighted by \(\boldsymbol{a}_l\) score. The principal motions and scores are determined such that the scores and objective variable are correlated by the following procedures.
First, as the explanatory variables, we record the velocities in the \(x\), \(y\), and \(z\) directions obtained from \(k\)-th (\(k = 1, ..., n\)) sample as follows:
Using the velocities in these three directions, we construct the following explanatory variable vector:
By combining the velocity column vectors from \(n\) samples for all participants, we formed the explanatory variables matrix \(\boldsymbol{X} \in \mathbb{R}^{n \times 303}\):
By aligning the minimum MoS values for all samples in a column vector, we formed the objective variable vector of size \(n\) as follow:
After centering the each column of \(\boldsymbol{X}\) and \(\boldsymbol{y}\), they can be approximated as a linear combination of \(L\) principal components:
For \(l \geq 2\), \(\boldsymbol{X}_l\) and \(\boldsymbol{y}_l\) are:
Here, \(\boldsymbol{a}_l\), \(\boldsymbol{p}_l\), and \(b_l\) are computed as:
Using the model established by these computations, the MoS of sample \(i\), which is not included in the training dataset, can be estimated as follows:
The above method assumes the use of three-axis velocity data from a single feature point as predictors. When using two feature points, the predictor vector \(\boldsymbol{x}_k \in \mathbb{R}^{606 \times 1}\) is extended as follows:
2.5. Cross-Validation
Cross-validation is a technique to assess the generalizability of a model and to tune hyperparameters. It involves splitting the dataset into training and testing sets to evaluate the model’s performance more reliably. In particular, \(k\)-fold cross-validation is a representative method where the dataset is randomly divided into \(k\) equal-sized subsets, called “folds.” In each iteration, one fold is held out as the validation set, while the remaining \(k-1\) folds are used for training. This process is repeated \(k\) times so that each fold is used exactly once as the validation set. The overall performance of the model is then calculated as the average of the \(k\) evaluation results.
In this study, we adopted 10-fold cross-validation to evaluate the prediction accuracy of gait stability margin. The dataset was randomly split into ten subsets of equal participants, i.e., three females and three males, and in each iteration, one subset was used as the test data while the remaining nine were used for training. We then calculated the predictive accuracy of various combinations of bony features using root mean squared errors (RMSE) and correlation coefficients between the predicted and observed MoS values.
The number of principal motions \(L\) was determined by performing 10-fold cross-validation across a range of candidate values (\(L=1\)–\(10\)), and the \(L\) value that minimized the average prediction error was adopted, as commonly done in model parameter tuning using cross-validation 52. In our implementation, \(L\) was set to 5.
3. Results
The means and standard deviations of RMSEs and correlation coefficients through the cross-validation process are shown in Table 1. The diagonal cells display the RMSEs and correlation coefficients when using only one bony feature. The non-diagonal cells display those values when using combinations of two features.
Table 1. RMSEs [m] and correlation coefficients for all two-feature combinations among the ten body parts. Values represent means and standard deviations obtained through cross-validation. Correlation coefficients are shown in parentheses.
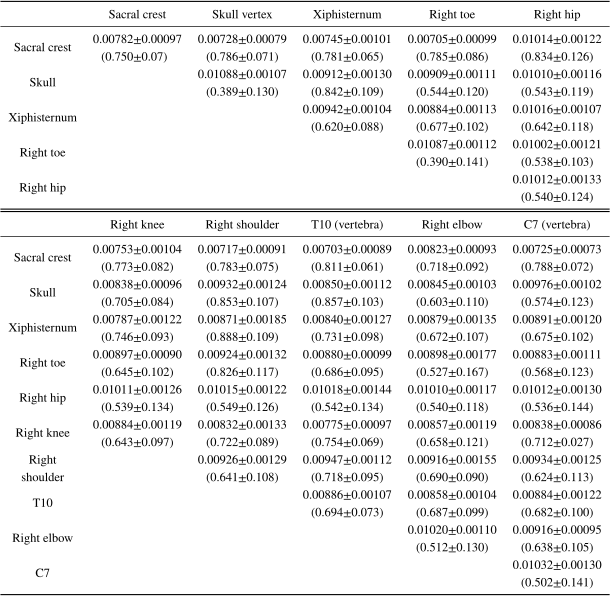
The sacral crest emerges as the most effective individual body feature for estimating the MoS, with an RMSE of 0.00782 m and correlation coefficient of 0.75. Furthermore, for all the body features, combining with another body feature improves the estimation accuracy.
Specifically, the combination of the sacral crest and the T10 yielded the best performance, achieving the smallest RMSE of 0.00703\(\pm\)0.00089 m. Fig. 5 illustrates a scatter plot of the estimated MoS values using data from both the sacral crest and T10, plotted against the observed MoS values. This combination was followed by the sacral crest and right toe pair, with an RMSE of 0.00705 m, the sacral crest and right shoulder, with an RMSE of 0.00717 m, and the sacral crest and C7 pair, with an RMSE of 0.00725 m.
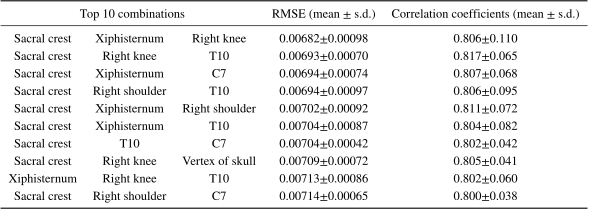
The analysis of three-body-part combinations, as presented in Table 2, further refines our understanding of optimal feature selection for gait stability prediction. Among the top-performing combinations, the combination of the sacral crest, xiphisternum, and right knee exhibited the lowest RMSE (0.00682\(\pm\)0.00098 m). The combination of the sacral crest, right knee, and T10 yielded the highest correlation coefficient (0.817\(\pm\)0.065) and the second lowest RMSE (0.00693\(\pm\)0.00070 m).
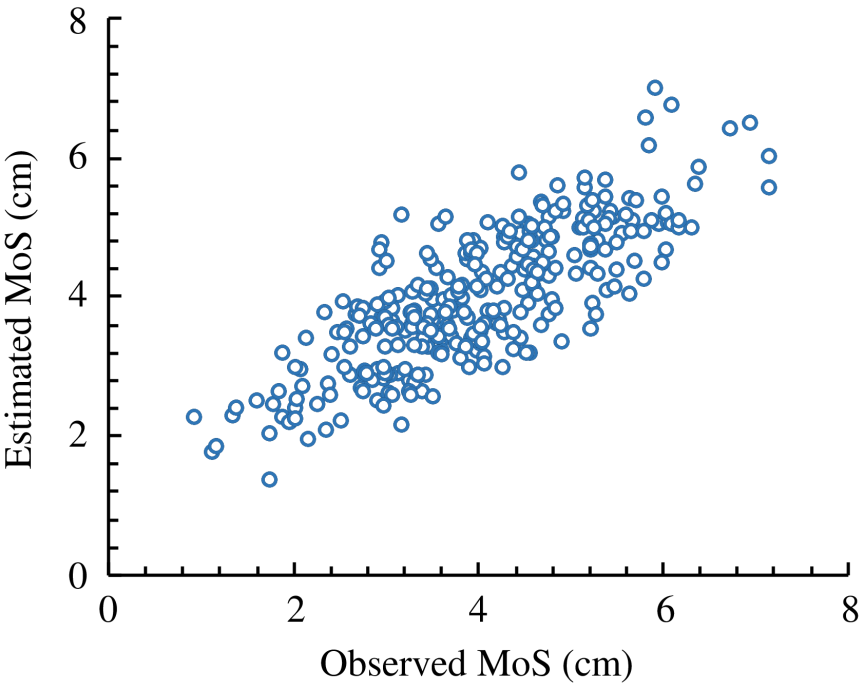
Fig. 5. Estimated MoS using the combination of sacral crest and T10. MoS values were estimated by 10-fold cross-validation.
4. Discussion
As indicated in the results, the sacral crest emerged as the most effective individual bony feature for estimating the MoS, consistent with previous findings 33. Due to its proximity to the body’s CoM, the sacral region is highly sensitive to postural stability during walking. When two or three feature points were combined, the sacral crest appeared in all of the top 5 combinations with the highest prediction accuracy. These results underscore the sacral crest’s potential as a critical measurement site for fall risk assessment and MoS estimation.
As shown in Table 1, combining two feature points yields better MoS prediction performance than using a single point. This result reflects the general benefit of incorporating multiple features in predictive modeling. Notably, combinations involving the sacral crest and either T10 or the right toe achieved the lowest RMSE values of 0.00703 and 0.00705 m, respectively. These values are smaller than the standard deviation of the MoS values (0.011 m 32), thereby meeting the benchmark index for identifying high-risk individuals, as described in Section 1.
Nonetheless, as shown in Table 2, the results for combinations of three body parts exhibit no substantial improvement in predictive accuracy compared to those using two body parts. Specifically, the lowest RMSE values were 0.00703\(\pm\)0.00089 m for the two-feature combination and 0.00682\(\pm\)0.00098 m for the three-feature combination. Because these samples are paired, the difference corresponds to an effect size of \(d_\mathrm{z} = 0.23\), which, according to Cohen’s convention 53, represents a small effect (\(0.2 \leq d_\mathrm{z} < 0.5\)). Therefore, while the inclusion of a third feature slightly improved accuracy numerically, the gain was scientifically minor and unlikely to justify the additional complexity in sensor deployment.
Table 2. Top 10 RMSE values and correlation coefficients for all three-feature combinations among the ten body parts.
The exact computation of the MoS requires motion information from at least three feature points: the CoM and both the left and right feet. The feasibility of estimating MoS using only one or two feature points can be attributed to the coordinated nature of body movements during gait-namely, motor synergies 57,56,55,59,51,49,58,54. Owing to the organic interdependence among body segments, MoS can be inferred even from a limited number of observed points. The present finding—that the combined use of two feature points yields maximal estimation performance—offers valuable insight for the practical implementation of gait analysis systems, particularly those aiming to minimize hardware requirements and cost.
Overall, the results support the conclusion that the sacral crest is a key measurement point, and its integration with other body parts, particularly T10 and right toe, enhances the precision and reliability of MoS estimation. These findings hold practical implications for real-world applications, such as accessible fall-risk detection systems, where accuracy and consistency are critical.
Although the combination of the sacral crest and T10 vertebra yielded high prediction accuracy, this result may initially seem counterintuitive, as both points are located relatively close to each other on the posterior torso. One might assume that combining nearby points would introduce redundant motion information with limited benefit for MoS estimation. However, these two points may reflect critical aspects of trunk dynamics, which strongly influence the body’s CoM and its XCoM. The sacral crest is located near the pelvis, while T10 is situated on the thoracic spine; together, they provide a more comprehensive representation of trunk posture and movement. Since the trunk comprises the body’s largest mass segment, its dynamics play a central role in balance control. Additionally, the high prediction accuracy obtained with these two markers may also result from enhanced signal-to-noise ratio through complementary yet partially overlapping motion information. These insights underscore the biomechanical relevance of trunk kinematics in MoS estimation.
In contrast, the strong performance of the sacral crest and toe combination is more intuitively understandable. Because MoS is computed using the position and velocity of the CoM along with foot placement information, pairing the sacral crest—located near the CoM—with the toe is logically appropriate. Several previous studies have highlighted the practicality of embedding IMU sensors in footwear 24,26,27,61,60,62, supporting the sacral crest and foot combination as a strong candidate for practical implementation. However, while the sacral crest alone yields high estimation accuracy, the toe alone performs poorly. Liu et al. 33 suggested that this is because the toe exhibits minimal movement for approximately 60% of the gait cycle 63,64, making it a less informative indicator of overall gait dynamics.
While this study demonstrates that the sacral crest in combination with either T10 or the toe provides superior performance, the reasons underlying the effectiveness of these combinations are likely different. Clarifying why these specific pairings perform well remains an important task for future research, and doing so would contribute to establishing the validity of sensor placement in fall risk assessment systems.
Although the motion data in this study were acquired using a camera-based motion capture system in a controlled environment, we recognize the necessity of validating the proposed method under real-world conditions for long-term usability. In such scenarios, wearable IMUs offer a practical solution due to their portability and ease of integration into daily-life settings. While it is known that gait estimation using IMUs is generally less accurate than camera-based systems 28,61,66,65, our recent study 67 demonstrated that MoS values can be reasonably estimated using real IMU data obtained from three adult participants. We found that even with a single IMU sensor attached to the body, the estimation accuracy approached the benchmark level proposed in the present study. These findings support the feasibility of extending our method to IMU-based systems. Future research will aim to evaluate the method’s robustness across a broader population and assess its performance during daily-life activities in uncontrolled environments.
The proposed method was evaluated using gait data from sixty healthy older adults (thirty males and thirty females aged 60 and above). Therefore, the generalizability of the findings to other populations remains uncertain. Nevertheless, we do not anticipate major difficulties in applying the same framework to other healthy adult groups. A more challenging extension would be its application to pathological gait patterns. Collecting such data is inherently difficult, and pathological gait often varies considerably across individuals. Moreover, for individuals who use orthotic or assistive devices (e.g., 70,68,69), MoS has rarely been computed, and in some cases, it may not be directly applicable in its conventional definition 16. For these populations, future research should first focus on individuals with frailty or mild mobility impairments who do not require external support, before extending the method to those who rely on assistive or orthotic devices.
5. Conclusion
This study identified optimal combinations of anatomical landmarks for accurately estimating the MoS using kinematic data. The sacral crest was confirmed as the most effective single body part, while the combination of the sacral crest and the T10 vertebra yielded the higher accuracy, with an RMSE of 0.00703 m. Similarly, the combination of the sacral crest and the right toe produced a comparable RMSE of 0.00705 m. Adding a third feature resulted in only marginal improvement, with the best three-feature combination reaching an RMSE of 0.00682 m. These findings suggest that placing IMU-equipped devices near the sacral crest and T10 or toe could substantially enhance the accuracy of fall risk prediction and gait stability monitoring.
Future research will focus on directly estimating MoS using IMU sensors attached to individuals in real-world settings. Moreover, extending the study to include diverse populations and individuals with pathological gait conditions will further improve the generalizability and robustness of the proposed approach.
Acknowledgments
This study was in part supported by the Okawa Foundation (2024-12).
- [1] R. Vaishya and A. Vaish, “Falls in Older Adults are Serious,” Indian J. of Orthopaedics, Vol.54, No.1, pp. 69-74, 2020. https://doi.org/10.1007/s43465-019-00037-x
- [2] World Health Organization, “WHO global report on falls prevention in older age,” 2007.
- [3] D. Hamacher, D. Liebl, C. Hödl et al., “Gait Stability and its Influencing Factors in Older Adults,” Frontiers in Physiology, Vol.9, Article No.01955, 2019. https://doi.org/10.3389/fphys.2018.01955
- [4] R. Jayakarthik, A. Srinivasan, S. Goswami, Shivaranjini, and Mahaveerakannan R, “Fall Detection Scheme based on Deep Learning Model for High-Quality Life,” 2022 3rd Int. Conf. on Electronics and Sustainable Communication Systems (ICESC), pp. 1582-1588, 2022. https://doi.org/10.1109/ICESC54411.2022.9885675
- [5] S. M. Bradley, “Falls in Older Adults,” Mount Sinai J. of Medicine: A J. of Translational and Personalized Medicine, Vol.78, Issue 4, pp. 590-595, 2011. https://doi.org/10.1002/msj.20280
- [6] M. K. Karlsson, T. Vonschewelov, C. Karlsson, M. Cöster, and B. E. Rosengen, “Prevention of falls in the elderly: A review,” Scandinavian J. of Public Health, Vol.41, Issue 5, pp. 442-454, 2013. https://doi.org/10.1177/1403494813483215
- [7] G. F. Papalia, R. Papalia, L. A. D. Balzani, G. Torre, B. Zampogna, S. Vasta, C. Fossati, A. M. Alifano, and V. Denaro, “The Effects of Physical Exercise on Balance and Prevention of Falls in Older People: A Systematic Review and Meta-Analysis,” J. of Clinical Medicine, Vol.9, Issue 8, Article No.2595, 2020. https://doi.org/10.3390/jcm9082595
- [8] M. B. Lott, “Translating the Base of Support a Mechanism for Balance Maintenance during Rotations in Dance,” J. of Dance Medicine & Science, Vol.23, Issue 1, pp. 17-25, 2019. https://doi.org/10.12678/1089-313X.23.1.17
- [9] P. M. M. Young, J. M. Wilken, and J. B. Dingwell, “Dynamic margins of stability during human walking in destabilizing environments,” J. of Biomechanics, Vol.45, Issue 6, pp. 1053-1059, 2012. https://doi.org/10.1016/j.jbiomech.2011.12.027
- [10] H.-S. Nam, J.-H. Kim, and Y.-J. Lim, “The Effect of the Base of Support on Anticipatory Postural Adjustment and Postural Stability,” The J. of Korean Physical Therapy, Vol.29, No.3, pp. 135-141, 2017. https://doi.org/10.18857/jkpt.2017.29.3.135
- [11] J.-Y. You et al., “Effect of slip on movement of body center of mass relative to base of support,” Clinical Biomechanics, Vol.16, Issue 2, pp. 167-173, 2001. https://doi.org/10.1016/S0268-0033(00)00076-0
- [12] A. L. Hof, “The ‘extrapolated center of mass’ concept suggests a simple control of balance in walking,” Human Movement Science, Vol.27, Issue 1, pp. 112-125, 2008. https://doi.org/10.1016/j.humov.2007.08.003
- [13] A. L. Hof, M. G. J. Gazendam, and W. E. Sinke, “The condition for dynamic stability,” J. of Biomechanics, Vol.38, Issue 1, pp. 1-8, 2005. https://doi.org/10.1016/j.jbiomech.2004.03.025
- [14] T. Kuroda, S. Okamoto, and Y. Akiyama, “Prediction of Margin of Gait Stability by Using Six-DoF Motion of Pelvis,” Sensors, Vol.24, Issue 22, Article No.7342, 2024. https://doi.org/10.3390/s24227342
- [15] W. Li, Y. Zhang, and J. H. Chien, “Applying bilateral mastoid vibration changes the margin of stability in the anterior-posterior and medial-lateral directions while walking on different inclines,” European J. of Medical Research, Vol.30, No.1, Article No.108, 2025. https://doi.org/10.1186/s40001-025-02364-2
- [16] N. Matsunaga, Y. Kurike, A. Kanada, Y. Yamamura, K. Honda, M. Yamamoto, and Y. Nakashima, “Proposal for Cane Tip Position to Achieve Both High Stability and Low Joint Torque Using Inverse Dynamics Analysis in T-Cane Gait,” J. Robot. Mechatron., Vol.36, No.5, pp. 1208-1220, 2024. https://doi.org/10.20965/jrm.2024.p1208
- [17] A. Noamani, K. Agarwal, A. Vette, and H. Rouhani, “Predicted Threshold for Seated Stability: Estimation of Margin of Stability Using Wearable Inertial Sensors,” IEEE J. of Biomedical and Health Informatics, Vol.25, Issue 9, pp. 3361-3372, 2021. https://doi.org/10.1109/JBHI.2021.3073352
- [18] T. Siragy, Y. Russo, and B. Horsak, “Mediolateral margin of stability highlights motor strategies for maintaining dynamic balance in older adults,” PLOS ONE, Vol.19, No.10, Article No.e0313034, 2024. https://doi.org/10.1371/journal.pone.0313034
- [19] F. Watson et al., “Use of the margin of stability to quantify stability in pathologic gait – A qualitative systematic review,” BMC Musculoskeletal Disorders, Vol.22, Article No.597, 2021. https://doi.org/10.1186/s12891-021-04466-4
- [20] B. Project, “Report of BALANCE-deliverable 3.1-stability index,” Technical Report, Balance Augmentation in Locomotion Through Anticipative and Cooperative Control of Exoskeletons, 2013.
- [21] D. Hamacher, N. B. Singh, J. H. Van Dieën et al., “Kinematic measures for assessing gait stability in elderly individuals: A systematic review,” J. of The Royal Society Interface, Vol.8, Issue 65, pp. 1682-1698, 2011. https://doi.org/10.1098/rsif.2011.0416
- [22] S. M. Bruijn, O. G. Meijer, P. J. Beek, and J. H. van Dieën, “Assessing the stability of human locomotion: A review of current measures,” J. of the Royal Society Interface, Vol.10, Issue 83, Article No.20120999, 2013. https://doi.org/10.1098/rsif.2012.0999
- [23] H. Ohtsu, S. Yoshida, T. Minamisawa et al., “Does the balance strategy during walking in elderly persons show an association with fall risk assessment?,” J. of Biomechanics, Vol.103, Article No.109657, 2020. https://doi.org/10.1016/j.jbiomech.2020.109657
- [24] M. Chen, H. Wang, L. Yu et al., “A Systematic Review of Wearable Sensor-Based Technologies for Fall Risk Assessment in Older Adults,” Sensors, Vol.22, Issue 18, Article No.6752, 2022. https://doi.org/10.3390/s22186752
- [25] G. J. Ellsworth, S. M. Klisch, B. Berg-Johansen, and E. Ocegueda, “Validation of Smartphones in Arbitrary Positions Against Force Plate Standard for Balance Assessment,” Sensors, Vol.25, Issue 9, Article No.2639, 2025. https://doi.org/10.3390/s25092639
- [26] R. N. Ferreira, N. F. Ribeiro, and C. P. Santos, “Fall Risk Assessment Using Wearable Sensors: A Narrative Review,” Sensors, Vol.22, Issue 3, Article No.984, 2022. https://doi.org/10.3390/s22030984
- [27] H. Jebelli, C. R. Ahn, and T. L. Stentz, “Comprehensive Fall-Risk Assessment of Construction Workers Using Inertial Measurement Units: Validation of the Gait-Stability Metric to Assess the Fall Risk of Iron Workers,” J. of Computing in Civil Engineering, Vol.30, Issue 3, 2016. https://doi.org/10.1061/(ASCE)CP.1943-5487.0000511
- [28] P. M. Riek, A. N. Best, and A. R. Wu, “Validation of Inertial Sensors to Evaluate Gait Stability,” Sensors, Vol.23, Issue 3, Article No.1547, 2023. https://doi.org/10.3390/s23031547
- [29] S. Subramaniam, A. I. Faisal, and M. J. Deen, “Wearable Sensor Systems for Fall Risk Assessment: A Review,” Frontiers in Digital Health, Vol.4, Article No.921506, 2022. https://doi.org/10.3389/fdgth.2022.921506
- [30] K. Yang, C. R. Ahn, M. C. Vuran, and S. S. Aria, “Semi-supervised near-miss fall detection for ironworkers with a wearable inertial measurement unit,” Automation in Construction, Vol.68, pp. 194-202, 2016. https://doi.org/10.1016/j.autcon.2016.04.007
- [31] Y. Akiyama, K. Kazumura, S. Okamoto, and Y. Yamada, “Utilizing Inertial Measurement Units for Detecting Dynamic Stability Variations in a Multi-Condition Gait Experiment,” Sensors, Vol.24, Issue 21, Article No.7044, 2024. https://doi.org/10.3390/s24217044
- [32] T. Kuroda, S. Okamoto, and Y. Akiyama, “Anterior and mediolateral dynamic gait stabilities attributed to different gait parameters in different age groups,” J. of Biomechanical Science and Engineering, Vol.19, Issue 1, Article No.23-00183, 2024. https://doi.org/10.1299/jbse.23-00183
- [33] Z. Liu, S. Okamoto, T. Kuroda, and Y. Akiyama, “Estimating the Margin of Gait Stability in Healthy Elderly Using the Triaxial Kinematic Motion of a Single Body Feature,” Applied Sciences, Vol.14, Issue 7, Article No.3067, 2024. https://doi.org/10.3390/app14073067
- [34] H. Peng, S. Okamoto, and Y. Akiyama, “Conjunctive use of two body parts’ kinematic information to estimate dynamic postural stability,” 2024 IEEE Global Conf. on Consumer Electronics (GCCE), pp. 51-53, 2024. https://doi.org/10.1109/GCCE62371.2024.10760482
- [35] Y. Kobayashi, H. Hobara, T. A. Heldoorn, M. Kouchi, and M. Mochimaru, “Age-independent and age-dependent sex differences in gait pattern determined by principal component analysis,” Gait & Posture, Vol.46, pp. 11-17, 2016. https://doi.org/10.1016/j.gaitpost.2016.01.021
- [36] Y. Kumano, S. Kanoga, M. Yamamoto, H. Takemura, and M. Tada, “Estimating Whole-Body Walking Motion from Inertial Measurement Units at Wrist and Heels Using Deep Learning,” Int. J. Automation Technol., Vol.17, No.3, pp. 217-225, 2023. https://doi.org/10.20965/ijat.2023.p0217
- [37] H. Watanabe, S. Okamoto, T. Kuroda, and Y. Akiyama, “Manipulability Analysis of Anterior and Mediolateral Dynamic Gait Stability of Young and Elderly Individuals,” J. Robot. Mechatron., Vol.36, No.6, pp. 1568-1576, 2024. https://doi.org/10.20965/jrm.2024.p1568
- [38] T. Yamaguchi and K. Masani, “Effects of age on dynamic balance measures and their correlation during walking across the adult lifespan,” Scientific Reports, Vol.12, Article No.14301, 2022. https://doi.org/10.1038/s41598-022-18382-7
- [39] C. He, R. Xu, M. Zhao, Y. Guo, S. Jiang, F. He, and D. Ming, “Dynamic stability and spatiotemporal parameters during turning in healthy young adults,” BioMedical Engineering Online, Vol.17, No.1, Article No.127, 2018. https://doi.org/10.1186/s12938-018-0558-5
- [40] A. Kulkarni, C. Cui, S. Rietdyk, and S. Ambike, “Humans prioritize walking efficiency or walking stability based on environmental risk,” Plos One, Vol.18, No.4, Article No.e0284278, 2023. https://doi.org/10.1371/journal.pone.0284278
- [41] G. Varas-Diaz, U. Jayakumar, B. Taras, S. Wang, and T. Bhatt, “Assessing Balance Loss and Stability Control in Older Adults Exposed to Gait Perturbations under Different Environmental Conditions: A Feasibility Study,” Biomechanics, Vol.2, Issue 3, pp. 374-394, 2022. https://doi.org/10.3390/biomechanics2030030
- [42] W. S. Erdmann, “Center of mass of the human body helps in analysis of balance and movement,” MOJ Applied Bionics and Biomechanics, Vol.2, No.2, pp. 144-148, 2018. https://doi.org/10.15406/mojabb.2018.02.00057
- [43] A. Ledebt and Y. Brenière, “Dynamical implication of anatomical and mechanical parameters in gait initiation process in children,” Human Movement Science, Vol.13, Issue 6, pp. 801-815, 1994. https://doi.org/10.1016/0167-9457(94)90019-1
- [44] National Aeronautics and Space Administration (NASA), “NASA-STD-3000 Man-Systems integration standards. Section 3: Anthropometry and biomechanics,” 1995.
- [45] R. Alamoudi and M. Alamoudi, “Development of Linear Regression Models to Estimate the Margin of Stability Based on Spatio-Temporal Gait Parameters,” IEEE Access, Vol.8, pp. 19853-19859, 2020. https://doi.org/10.1109/ACCESS.2020.2969294
- [46] A. Simonet, P. Fourcade, F. Loete, A. Delafontaine, and E. Yiou, “Evaluation of the Margin of Stability during Gait Initiation in Young Healthy Adults, Elderly Healthy Adults and Patients with Parkinson’s Disease: A Comparison of Force Plate and Markerless Motion Capture Systems,” Sensors, Vol.24, Issue 11, Article No.3322, 2024. https://doi.org/10.3390/s24113322
- [47] J. Choi, B. A. Knarr, and J.-H. Youn, “The Effects of Ship’s Roll Motion on the Center of Mass and Margin of Stability During Walking: A Simulation Study,” IEEE Access, Vol.10, pp. 102432-102439, 2022. https://doi.org/10.1109/ACCESS.2022.3208876
- [48] S. Shokouhi, P. Sritharan, and P. V.-S. Lee, “Recovering whole-body angular momentum and margin of stability after treadmill-induced perturbations during sloped walking in healthy young adults,” Scientific Reports, Vol.14, No.1, Article No.4421, 2024. https://doi.org/10.1038/s41598-024-54890-4
- [49] C. Qiu, S. Okamoto, Y. Akiyama, and Y. Yamada, “Application of Supervised Principal Motion Analysis to Evaluate Subjectively Easy Sit-to-Stand Motion of Healthy People,” IEEE Access, Vol.9, pp. 73251-73261, 2021. https://doi.org/10.1109/ACCESS.2021.3078202
- [50] T. Iwasaki, S. Okamoto, Y. Akiyama, and Y. Yamada, “Gait Stability Index Built by Kinematic Information Consistent with the Margin of Stability Along the Mediolateral Direction,” IEEE Access, Vol.10, pp. 52832-52839, 2022. https://doi.org/10.1109/ACCESS.2022.3175409
- [51] H. Oshima, S. Aoi, T. Funato, N. Tsujiuchi, and K. Tsuchiya, “Variant and Invariant Spatiotemporal Structures in Kinematic Coordination to Regulate Speed During Walking and Running,” Frontiers in Computational Neuroscience, Vol.13, Article No.63, 2019. https://doi.org/10.3389/fncom.2019.00063
- [52] D. Berrar, “Cross-Validation,” Encyclopedia of Bioinformatics and Computational Biology, Vol.1, pp. 542-545, 2019. https://doi.org/10.1016/B978-0-12-809633-8.20349-X
- [53] J. Cohen, “Statistical Power Analysis for the Behavioral Sciences,” Routledge, 1988. https://doi.org/10.4324/9780203771587
- [54] Q. An, Y. Ikemoto, and H. Asama, “Muscle Synergy Analysis Between Young and Elderly People in Standing-Up Motion,” J. Robot. Mechatron., Vol.25, No.6, pp. 1038-1049, 2013. https://doi.org/10.20965/jrm.2013.p1038
- [55] T. Funato, S. Aoi, H. Oshima, and K. Tsuchiya, “Variant and invariant patterns embedded in human locomotion through whole body kinematic coordination,” Experimental Brain Research, Vol.205, No.4, pp. 497-511, 2010. https://doi.org/10.1007/s00221-010-2385-1
- [56] Y. P. Ivanenko, R. E. Poppele, and F. Lacquaniti, “Five basic muscle activation patterns account for muscle activity during human locomotion,” The J. of Physiology, Vol.556, Issue 1, pp. 267-282, 2004. https://doi.org/10.1113/jphysiol.2003.057174
- [57] F. C. Park and K. Jo, “Movement Primitives and Principal Component Analysis,” J. Lenarčič and C. Galletti (Eds.), “On Advances in Robot Kinematics,” pp. 421-430, Springer, 2004. https://doi.org/10.1007/978-1-4020-2249-4_45
- [58] A. Scano, V. Lanzani, and C. Brambilla, “How Recent Findings in Electromyographic Analysis and Synergistic Control Can Impact on New Directions for Muscle Synergy Assessment in Sports,” Applied Sciences, Vol.14, Issue 23, Article No.11360, 2024. https://doi.org/10.3390/app142311360
- [59] M. C. Tresch, V. C. K. Cheung, and A. d’Avella, “Matrix Factorization Algorithms for the Identification of Muscle Synergies: Evaluation on Simulated and Experimental Data Sets,” J. of Neurophysiology, Vol.95, Issue 4, pp. 2199-2212, 2006. https://doi.org/10.1152/jn.00222.2005
- [60] S. R. Hussain and W. G. Wright, “The Development and Validation of a Novel Smartphone Application to Detect Postural Instability,” Sensors, Vol.25, Issue 5, Article No.1505, 2025. https://doi.org/10.3390/s25051505
- [61] W. Teufl, M. Lorenz, M. Miezal, B. Taetz, M. Fröhlich, and G. Bleser, “Towards Inertial Sensor Based Mobile Gait Analysis: Event-Detection and Spatio-Temporal Parameters,” Sensors, Vol.19, Issue 1, Article No.38, 2019. https://doi.org/10.3390/s19010038
- [62] A. Yamamoto, K. Fujita, E. Yamada, T. Ibara, F. Nihey, T. Inai, K. Tsukamoto, Y. Kobayashi, K. Nakahara, and A. Okawa, “Gait characteristics in patients with distal radius fracture using an in-shoe inertial measurement system at various gait speeds,” Gait & Posture, Vol.107, pp. 317-323, 2024. https://doi.org/10.1016/j.gaitpost.2023.10.023
- [63] A. Bonnefoy-Mazure and S. Armand, “Normal gait,” F. Canavese and J. Deslandes (Eds.), “Orthopedic Management of Children with Cerebral Palsy,” Chapter 16, pp. 199-213, Nova Science Publishers, 2015.
- [64] H. G. Chambers and D. H. Sutherland, “A Practical Guide to Gait Analysis,” J. of the American Academy of Orthopaedic Surgeons, Vol.10, No.3, pp. 222-231, 2002. https://doi.org/10.5435/00124635-200205000-00009
- [65] S. Ciklacandir, S. Ozkan, and Y. Isler, “A Comparison of the Performances of Video-Based and IMU Sensor-Based Motion Capture Systems on Joint Angles,” 2022 Innovations in Intelligent Systems and Applications Conf. (ASYU), 2022. https://doi.org/10.1109/ASYU56188.2022.9925507
- [66] R. Schwesig, S. Leuchte, D. Fischer, R. Ullmann, and A. Kluttig, “Inertial sensor based reference gait data for healthy subjects,” Gait & Posture, Vol.33, Issue 4, pp. 673-678, 2011. https://doi.org/10.1016/j.gaitpost.2011.02.023
- [67] H. Peng, S. Okamoto, H. Watanabe, and Y. Akiyama, “Dynamic Gait Stability Estimation Using IMU-Based Kinematic Data,” 2025 IEEE 14th Global Conf. on Consumer Electronics (GCCE), pp. 752-754, 2025. https://doi.org/10.1109/GCCE65946.2025.11274709
- [68] Y. Kuboki, Y. Akiyama, S. Okamoto, and Y. Yamada, “The influence of hip joint rotation of a physical assistant robot on curving motion,” Advanced Robotics, Vol.35, Issue 2, pp. 108-117, 2021. https://doi.org/10.1080/01691864.2020.1857304
- [69] K. Ogata, T. Zhu, M. Fujimoto, S. Kudo, and Y. Matsumoto, “Robotic Wear with Pneumatic Actuators to Assist/Improve Sideways Balance During Walking: Part 1—Prototype Development,” J. Robot. Mechatron., Vol.37, No.4, pp. 909-917, 2025. https://doi.org/10.20965/jrm.2025.p0909
- [70] M.-Y. Xu, Y.-F. Hua, Y.-F. Li, J.-R. Zhuang, K. Osawa, K. Nakagawa, H.-H. Lee, L. Yuge, and E. Tanaka, “Development of an Ankle Assistive Robot with Instantly Gait-Adaptive Method,” J. Robot. Mechatron., Vol.35, No.3, pp. 669-683, 2023. https://doi.org/10.20965/jrm.2023.p0669
- [a] Y. Kobayashi, N. Hida, K. Nakajima, M. Fujimoto, and M. Mochimaru, “AIST Gait Database 2019,” 2019. https://unit.aist.go.jp/harc/ExPART/GDB2019.html [Accessed April 1, 2025]
This article is published under a Creative Commons Attribution-NoDerivatives 4.0 Internationa License.