
Paper:
Development of a Baseball Practice Ball Providing Visual Feedback of the Pitch Spin Rate
Takahiro Matsuno*,**,† and Tatsuya Watanabe*
*Faculty of Engineering, Kindai University
1 Takaya Umenobe, Higashi-hiroshima, Hiroshima 739-2116, Japan
**Fundamental Technology for Next Generation Research Institute, Kindai University
1 Takaya Umenobe, Higashi-hiroshima, Hiroshima 739-2116, Japan
†Corresponding author

We developed a baseball pitching practice ball to provide the real-time visual feedback of the spin rate by changing the surface color according to the rotational speed of the pitch. This system eliminated the need for external display devices such as tablets or monitors, thereby reducing the system complexity and cost. Furthermore, it allowed players, coaches, and spectators to simultaneously visually perceive the spin rate, facilitating immediate and intuitive feedback during training.
Spin rate visualization ball
1. Introduction
In recent years, engineering approaches have been increasingly explored as solutions to various sporting challenges. These include methods to quantitatively evaluate individual athlete performance 1,2, analyze team tactics and coordination 3,4, and develop devices for objectively assess the performance of sports equipment 5,6,7,8,9. Furthermore, analytical systems and training-assistive robots aimed at skill enhancement 10,11, as well as systems using virtual reality 12, have also been proposed. In parallel, studies have advanced in the area of enhancing the spectator experience by analyzing the sports video footage and live commentary 13.
This study focused on improving baseball pitching skills. In pitching, three parameters—spin rate, spin axis, and ball velocity—play crucial roles in determining the pitch quality 14,15. Accurate recognition of these parameters is essential for players to enhance their skills and for coaches to provide appropriate feedback.
Several methods have been developed to acquire information on baseball motion. These include image processing-based analyses 16,17 and dedicated high-precision measurement devices designed specifically for baseball [a–c]. A more compact and cost-effective approach involves embedding magnetometers and gyroscopes within the ball to directly measure rotational data that are then wirelessly transmitted to external display devices [d–f]. This method allows for the accurate numerical acquisition of pitch data such as the spin rate, spin axis, and velocity.
These devices require high-performance sensors, communication modules, and external display units (for example, tablets), resulting in significant costs. Moreover, the sensors are often custom-designed for professional applications, offering performance levels that far exceed those of inexpensive commercial alternatives. Consequently, these systems are primarily used by professional athletes or elite players aspiring to compete professionally.
However, in amateur-level pitching practice, such as in university or recreational baseball, precise numerical evaluation of spin data is not necessarily required. Instead, the ease of implementation, affordability, and availability of intuitive visual feedback are prioritized. Given the financial constraints faced by many amateur teams, the demand for practical and low-cost training devices is increasing, even at the cost of reduced accuracy.
In amateur settings, the spin axis can be approximately estimated through visual observation, either by marking lines or dots on the ball surface or by using balls with special shapes such as ellipsoidal or barrel-like forms. Similarly, the ball velocity can be approximately estimated by visual inspection and can be maintained or improved to a certain extent through physical conditioning and form adjustments. Thus, simplified evaluation methods exist for both the spin axis and velocity.
However, the spin rate (that is, rotational speed) is extremely difficult to evaluate visually or by feeling, and no practical intuitive system currently exists to assess the spin rate in a simplified manner. The spin rate is intricately affected by technical factors such as fingertip release and wrist motion at the moment of throwing, hindering its improvement through strength training alone. Additionally, significant individual differences exist among players, highlighting the need to visualize technical issues and provide targeted feedback.
Therefore, the objective of this study is to develop a cost-effective easy-to-implement training ball capable of visually indicating the spin rate. The effectiveness and practical utility of the proposed system are also investigated.
2. Training Ball for Visual Feedback of the Spin Rate
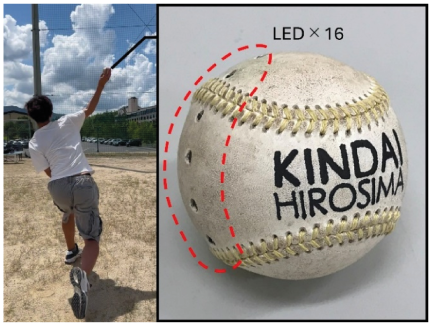
Fig. 1. Practice ball capable of visualizing the spin rate and its usage image.
This study aims to develop a pitching training ball capable of providing intuitive and low-cost visual feedback on the spin rate. In particular, we propose a method by which pitchers and coaches can visually confirm, in real time, the degree to which a target spin rate has been achieved, thereby improving the training efficiency.
Conventional spin-measuring balls can be used to numerically estimate the spin rate, spin axis, and ball velocity with high precision. However, these systems typically require wireless communication modules and external display devices (for example, tablets), leading to higher overall system costs. Moreover, at the amateur level, these detailed numerical data are not always necessary; rather, a sensory understanding of spin tendencies and changes over time must be developed.
To address this issue, this study proposed a simplified method that eliminated the need for large-scale high-precision sensors and wireless communication systems. Instead, visual feedback was provided using a set of LEDs embedded on the surface of the ball to represent the spin rate in discrete stages 18,19. The changing colors of the LEDs allowed for immediate visual recognition of the spin magnitude during pitching.
As an initial prototype, we proposed a system limited to measuring the spin around a single rotational axis. Specifically, we targeted the spin generated during a four-seam fastball pitch. Multiple LEDs were arranged in a ring around the circumference of the ball aligned with the spin axis. As the ball rotated, the LEDs changed their lighting pattern and color in response to the spin rate, thereby visually representing the rotational speed.
Figure 1 illustrates the external appearance and system configuration of the proposed pitching training ball.
3. Fabrication of the Pitching Training Ball
3.1. Structure of the Pitching Training Ball
The proposed pitching training ball consisted of three main components: ball body, internal sensor and circuitry, and leather outer cover. A schematic of the ball design is presented in Fig. 2(a). The ball body comprised a hemispherical component (indicated in yellow in Fig. 2(a)) that housed the sensor unit, and a cylindrical component (white in Fig. 2(a)) that contained the embedded LEDs.
The hemispherical part was designed with a rectangular cavity to securely mount the sensor unit, as well as additional spaces for wiring, a hole for connecting an external power cable, and hole to access the power button. The cylindrical part included 16 holes to hold the LEDs and channels to direct the emitted light outward. These two components were assembled using M3 screws, resulting in a complete spherical structure with a diameter of 68 mm.
The main body components were fabricated using a 3D printer with a thermoplastic polyurethane elastomer. The ball weight was adjusted by varying the infill density of the main body. A photograph of the fabricated body of the ball is shown in Fig. 2(b).
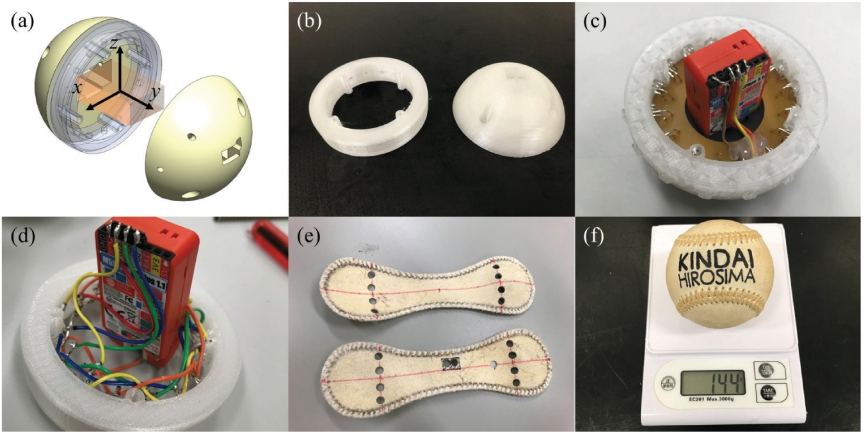
Fig. 2. Fabrication process of the practice ball with visual spin rate feedback. (a) Design drawing of the ball body, sensor unit, and measurement axis, (b) fabricated components (left: cylindrical part, right: hemispherical part), (c) cylindrical part with 16 full color LEDs, sensor unit, and wiring by PCB for Model 1, (d) cylindrical part with four different single-color LEDs (each used in groups of four), sensor unit, and wiring directly for Model 2, (e) covering with official baseball leather and drawing of reference lines, and (f) weight verification of the fabricated practice ball 18,19.
3.2. Visual Feedback of the Spin Rate
This study proposed two design approaches for embedding LEDs into a ball to provide visual feedback on the spin rate.
The first approach used full-color LEDs. Sixteen full-color LEDs were arranged along the circumference of the ball, with their anode pins connected to the I/O pins of the sensor unit. The LEDs were configured in a common cathode arrangement, enabling emission in basic colors (red, green, and blue), as well as cyan, magenta, yellow, and white, by selectively setting the anodes to HIGH.
The second approach employed four different single-color LEDs—blue, green, orange, and red—each used in groups of four, totaling 16 LEDs. The LEDs of the same color were connected in parallel and wired to the I/O pins of the sensor unit. At any given time, only one color group (four LEDs) was illuminated. This configuration allowed for lower cost and reduced power consumption because single-color LEDs were inexpensive, and simultaneous activation was limited to four LEDs.
A StickC Plus module (manufactured by M5Stack) was used as the sensor unit. Two methods were considered for connecting the LEDs to the sensor unit. The first method involved using a printed circuit board (PCB) for wiring (Fig. 2(c)), whereas the second method connected each LED directly to the sensor unit via individual cables (Fig. 2(d)).
In this study, the configuration using full-color LEDs and a PCB was referred to as Model 1 and that using single-color LEDs and direct cable connections as Model 2. Both the prototypes were fabricated and compared.
3.3. Leather Covering and Stitching
To complete the assembly, the sensor-embedded ball body was covered with cowhide leather, similar to that used in regulation baseballs. In this study, discarded practice balls were repurposed and their leather was removed, cleaned using erasers and detergent, and prepared for reuse. Guiding lines were drawn on the reverse side of the leather.
The guiding lines consisted of a horizontal line across the vertical center of the leather and vertical lines dividing the circumference into quarters. When the leather was stitched back onto the ball, the vertical guiding line formed a continuous circular band that served as the alignment reference for the LED light-emitting region.
Subsequently, holes were punched at four positions along this circular band (16 holes in total) to allow the LED light to pass through. Additional holes were created for the charging port and power button using a combination of circular hole punches and cutters, depending on the shape. The processed leather components are shown in Fig. 2(e).
Finally, the leather cover was temporarily fixed to the body of the ball and stitched. Although red threads are typically used in official baseballs, white Kevlar threads were employed in this study to enhance visibility and distinguishability. The use of a red thread could interfere with LED color perception and increase the likelihood of confusion with the regulation game balls.
Photographs of the completed pitching training ball are shown in Fig. 2(f). The weights of Models 1 and 2 balls were 143 g and 144 g, which satisfied the official baseball weight standard of 141.7–148.8 g. The main body was fabricated at 45% infill density for Model 1 and 60% for Model 2. Furthermore, charging and power operations were confirmed to function without any issues. For both models, no deviation owing to eccentricity was observed during pitching because the center of the ball was well aligned with its center of mass. In terms of tactile sensation during pitching, although Models 1 and 2 had different infill densities, the users did not perceive any difference in hardness and reported that both felt comparable to official baseballs. However, this evaluation was based on the subjective impressions of users. Here, we discuss the cost of the fabricated pitching training ball. For spin rate measurements using external sensors a,b, systems such as TrackMan are priced at approximately JPY3,000,000, whereas Rapsodo Pro 2.0 costs approximately JPY4,500,000. In contrast, sensor-embedded methods, such as Mizuno MA-Q d, require approximately JPY30,000 for the sensor-embedded ball and JPY15,000 for the charger and additionally require a tablet device (iOS-compatible) to display the measurement results. In our prototype, we employed the M5StickC as the sensor unit, which costed approximately JPY4,000. The LEDs used for the visualization included 16 single-color LEDs (approximately JPY60 in total) and 16 full-color LEDs (approximately JPY100 in total). The overall cost of fabricating the prototype ball, including the leather cover and stitching materials, was approximately JPY5,000. Notably, the M5StickC module contains unused sensors and wireless components, suggesting the possibility of further cost reduction in future iterations. Therefore, the proposed pitching training ball is less expensive than the other measurement devices.
4. Spin Rate Measurement and Calibration Method
The sensor embedded in the ball is a general-purpose six-axis IMU sensor (MPU-6886, InvenSense, USA). In this study, the measurement range of the accelerometer was set to G and that of the gyroscope to \(\pm 2000\) deg/s. The sensor unit used in this study was the M5StickC Plus that included the IMU and communication functions. In future models, only the necessary electronic components will be implemented.
This study focuses on measuring the spin rate of a ball along a single axis. Let the angular velocity vector measured by the gyroscope be defined as \([\omega_x^{(\textit{gyr})}\ \ \omega_y^{(\textit{gyr})}\ \ \omega_z^{(\textit{gyr})}]^{\textsf{T}}\) [deg/s].
Here, \(\omega_y^{(\textit{gyr})}\) represents the angular velocity along the axis of interest. If \(\omega_y^{(\textit{gyr})}\) falls within the sensor measurement range of \(\pm 2000\) deg/s (\(\pm 333\) rpm), it is directly used as the spin rate of the ball.
When \(\omega_y^{(\textit{gyr})}\) exceeds the sensor range, we propose a method to estimate its true value using other IMU measurements. First, we derive the relationship between the angular velocity vector and acceleration vector \([a_x\ a_y\ a_z]^{\textsf{T}}\) [G].
Assuming that the ball maintains a nearly constant spin rate during flight, the acceleration experienced by the internal sensor consists of three components: centripetal acceleration owing to uniform circular motion, deceleration owing to air resistance, and acceleration owing to the Magnus effect. However, because the latter two are relatively small, we assume that the measured acceleration primarily corresponds to the centripetal acceleration. Under this assumption, the angular velocity and acceleration vectors are orthogonal, leading to the following relationship:
Subsequently, we estimate true angular velocity \(\omega\) of the ball based on the sensor data. The gyroscope is limited to \(\pm 2000\) deg/s (\(\pm 333\) rpm), beyond which it cannot measure. However, with \(\beta=3500\), the accelerometer-based method can estimate up to approximately 14000 deg/s (2333 rpm). This method assumes that the angular acceleration, air resistance, and Magnus effect are negligible compared to the centripetal acceleration. This assumption may not hold at low spin rates, where the centripetal acceleration is small, and the estimation may contain significant errors. By contrast, low spin rates can be accurately measured using a gyroscope.
Therefore, in this study, true angular velocity \(\omega_y\) [deg/s] was selected based on the magnitude of the gyroscope measurement \(\vert\omega_y^{(\textit{gyr})}\vert\): if \(\vert\omega_y^{(\textit{gyr})}\vert<2000\) deg/s, \(\omega_y^{(\textit{gyr})}\) was used as \(\omega_y\). However, if \(\vert\omega_y^{(\textit{gyr})}\vert\ge 2000\) deg/s and \(\vert a_y\vert<0.03\), \(\widehat{\omega}_y^{(\textit{acc})}\) was used as \(\omega_y\). In other cases, \(\widehat{\omega}_y^{(\textit{gyr})}\) was used as \(\omega_y\).
In baseball, the spin rate is typically expressed in revolutions per minute (rpm). Thus, the angular velocity is converted to spin rate \(\Omega\) [rpm] as follows:
Calibration coefficient \(\beta\) for estimating angular velocity from the accelerometer was determined experimentally. The sensor unit was inserted into the cylindrical case, as shown in Fig. 3, and manually spun by hand on a flat surface in a manner similar to a top. During this process, the sensor unit continued to rotate for a period of time before gradually coming to rest owing to friction with the ground. The angular velocity during rotation was measured and recorded using both the gyroscope and accelerometer.
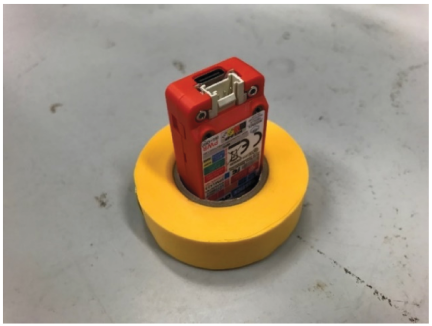
Fig. 3. Experimental setup for sensor calibration 18.
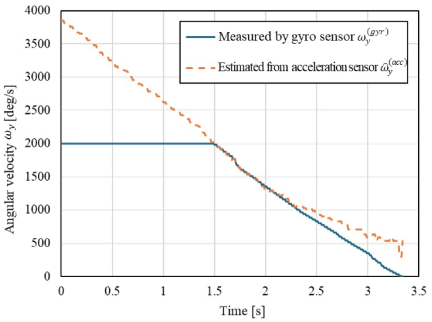
Fig. 4. Angular velocity measurement results for sensor calibration 18.
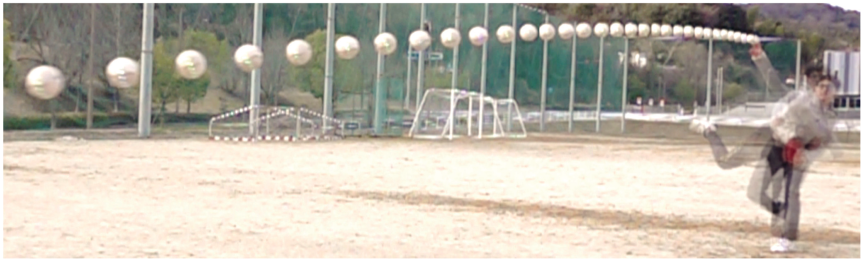
Fig. 5. Ball trajectory of the developed practice ball captured at 10-frame intervals (approximately 0.06 s) using a high-speed camera.
Figure 4 shows the results assuming \(\beta=3500\). The gyroscope measurements exhibited a linear decay over time, which was consistent with the assumption of linear deceleration owing to friction. The accelerometer-based estimation aligned closely with the gyroscope results in the 1500–2000 deg/s range and smoothly extrapolated beyond 2000 deg/s, indicating reasonable estimation.
At lower angular velocities, the discrepancies between the gyroscope and accelerometer estimations increased because the assumption underlying Eq. \(\eqref{eq:1}\) became invalid. Focusing on the data between 1500 and 2000 deg/s, we calculated the estimation error and determined \(\beta\) by minimizing the sum of squared errors. Consequently, the optimal calibration coefficient was \(\beta=3520\). The graphs obtained with \(\beta=3520\) and \(\beta=3500\) showed almost no noticeable difference.
5. Experimental Validation
We conducted a series of validation experiments on the baseball training ball developed in this study. First, we verified the validity of the spin rate estimated from the acceleration data. Next, we examined whether the ball color changed appropriately in response to the spin rate. Because the only difference between Models 1 and 2 was the type of LEDs used, and the sensor unit, spin rate estimation method, and ball structure were identical, the estimation results could be regarded as equivalent. Therefore, the spin rate was verified using Model 1, and the LED color change according to the spin rate was tested with both models, with the results of Model 2 presented as representative. Through these tests, we also assessed the visibility of the color indicators and the battery life of the device.
5.1. Validation of the Spin Rate Estimated from Acceleration
To verify the validity of spin rate estimation based on the acceleration data, we employed two different approaches. The first involved capturing the ball in motion using a high-speed camera. From the recorded footage, we identified distinctive visual features on the ball—such as LEDs, the charging port, and power button opening—to estimate angular displacement \(\theta\) [rad] during flight. Let \(i\) be the number of frames required for the ball to rotate by \(\theta\) [rad], and let \(j\) [fps] be the frame rate of the camera. Estimated spin rate \(\Omega_{\textrm{cam}}\) [rpm] is calculated as follows:
Figure 5 shows the throwing scene of the developed Model 1 ball. The high-speed camera (RX100 VII, Sony, Japan) used in the experiment operated at 960 fps. As shown in the figure, the ball was captured at 10-frame intervals. The spin rate estimated by the ball during this throw was transmitted using Bluetooth, as presented in Table 1. The average spin rate recorded during this throw was 1348 rpm. Additionally, we analyzed a zoomed-in sequence from the footage where the ball seam was clearly visible. From this, we measured the number of frames corresponding to every \(\pi/2\) rad of rotation, as shown in Fig. 6. Based on these observations, we confirmed that the spin rate of the ball was approximately 1490 rpm. Table 1 summarizes the results of similar tests. These experiments confirmed that the spin rate estimated from the acceleration closely matched the actual spin rate. The maximum error was 142 rpm, and the maximum error rate was 9.53%.
5.2. Verification of Color Changes Based on the Spin Rate
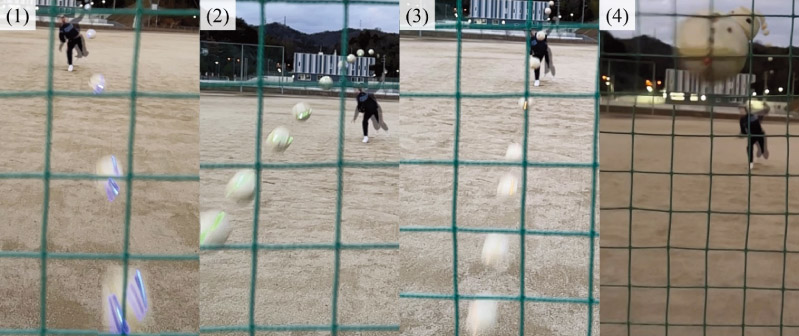
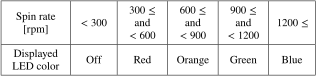
Next, we verified whether the ball changed color according to its spin rate, using Model 2 of the developed ball. The measured spin rates and corresponding LED colors are listed in Table 2. Fig. 7 shows the motion of the ball during throws (1)–(4). In all cases, the ball successfully displayed color changes according to the measured spin rate. Additionally, the LED colors were clearly visible even under bright outdoor daylight conditions.
Throws (1)–(3) used the accelerometer-based estimation method, whereas throw (4) used gyroscope data because of the lower spin speed. To verify the validity of the acceleration-based estimation, we measured the number of frames required for the ball to rotate using the visible features on the ball surface. The spin rates, \(\omega_{\textrm{cam}}\), calculated from these frame counts are presented in Table 3. In all the four throws, the estimated spin rate closely matched the values measured from the ball.
5.3. Comparison Between Ball Models
Finally, we compared the performance of the two developed ball models. Fig. 8 shows the appearance of each model during the flight. Both models visibly emitted LED light during the throws. Model 1 used full-color LEDs and simultaneously activated all 16 LEDs. By contrast, Model 2 used single-color LEDs and simultaneously lit only four LEDs. Consequently, Model 1 exhibited better visibility in motion.
Regarding battery life, Model 1 had a shorter runtime, shutting down approximately 15 min after a full charge. By contrast, Model 2 could operate for more than an hour on a single charge. To render Model 1 practical for extended use, a higher capacity battery is required.
Table 1. Validation results of the measured spin rate with high-speed camera.
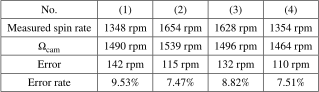
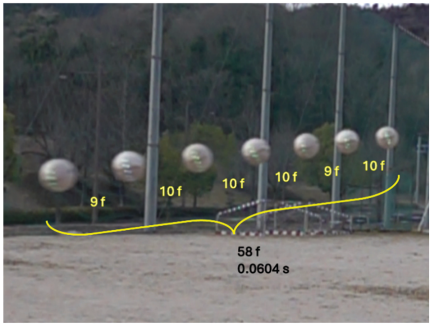
Fig. 6. Number of frames required for each quarter rotation of the pitched ball.
Table 2. Setting the display color according to the spin rate of the ball.
5.4. Summary of Experimental Validation
These experiments confirmed that the developed training ball could reliably estimate the spin rate using only low-cost accelerometers and gyroscopes. Moreover, the ball successfully provided visual feedback to the user by changing its color in response to the spin rate, thereby fulfilling the objectives of this study.
6. Conclusion
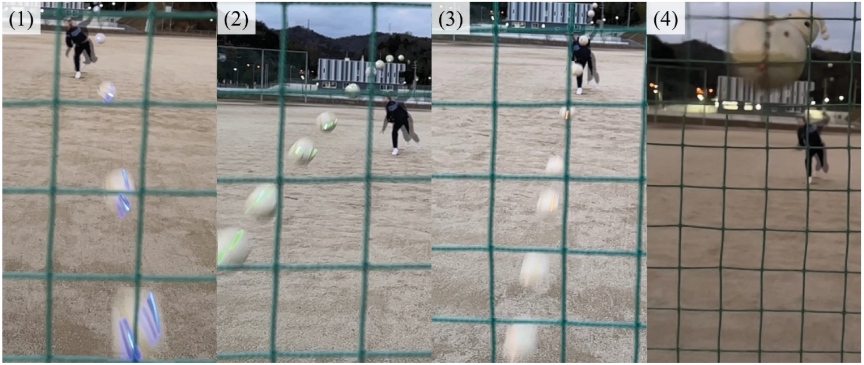
Fig. 7. Validation results of ball surface color changes at various spin rates using the developed ball (No.(1): 1813 rpm, No.(2): 1178 rpm, No.(3): 818 rpm, and No.(4): 218 rpm) 18.
In this study, we developed a training ball for baseball pitching that changed its surface color in real time according to the spin rate. The ball estimated the spin rate based on the data acquired from an accelerometer and gyroscope and provided immediate visual feedback to the user by altering the color of the embedded LEDs according to the estimated spin rate.
Unlike conventional systems that rely on tablets or external displays, this ball could independently present the spin rate information that reduced costs and allowed players, coaches, and observers to simultaneously visualize the pitch quality. Furthermore, we confirmed that the spin rate estimated from the onboard sensor data closely matched the results obtained from the high-speed video analysis.
In the future, we plan to evaluate the effectiveness of this training ball in real practice and educational settings, particularly in terms of its contribution to improving the spin rate of a player. Further improvements will be made to enhance usability such as extending the battery life and improving visibility. In the present prototypes, the spin rate is displayed in four discrete stages using color changes, and we plan to use full-color LEDs to enable finer steps or even continuous representation of the spin rate. We also plan to increase the number of LEDs embedded on the ball surface to expand the number of axes for spin visualization. Ultimately, one of our goals is to display the spin axis of the ball in real time during flight while representing its spin rate through color. The results of this study are expected to promote spin-focused pitching instructions and support skill development in a wider range of players.
Table 3. Measured spin rates and the corresponding LED colors.
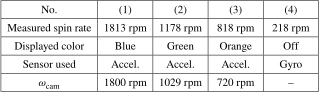
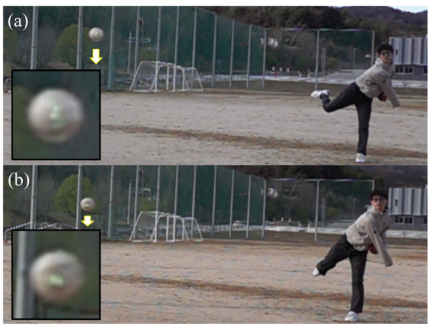
Fig. 8. Visibility comparison of LED arrangements: (a) Model 1 and (b) Model 2 in flight.
Acknowledgments
This study was conducted with the generous cooperation of Masaya Kanamori, Sotaro Ito, and Issei Kitatani from the Kindai University Hiroshima Campus. The authors express their sincere gratitude for their valuable support and contributions.
- [1] A. Ikeda and K. Mori, “Basic analysis for evaluation of tennis volley skill using body propagated vibration sensing,” J. Robot. Mechatron., Vol.36, No.5, pp. 1235-1242, 2024. https://doi.org/10.20965/jrm.2024.p1235
- [2] K. Kurita, “New detection technique for timing of contact and noncontact of athlete’s foot with the ground in sports,” Int. J. Automation Technol., Vol.5, No.2, pp. 233-235, 2011. https://doi.org/10.20965/ijat.2011.p0232
- [3] K. Fujii, “Data-driven analysis for understanding team sports behaviors,” J. Robot. Mechatron., Vol.33, No.3, pp. 505-514, 2021. https://doi.org/10.20965/jrm.2021.p0505
- [4] C. Yeung, R. Bunker, and K. Fujii, “Unveiling multi-agent strategies: A data-driven approach for extracting and evaluating team tactics from football event and freeze-frame data,” J. Robot. Mechatron., Vol.36, No.3, pp. 603-617, 2024. https://doi.org/10.20965/jrm.2024.p0603
- [5] J. Furusho, M. Sakaguchi, N. Takesue, F. Sato, T. Naruo, and H. Nagao, “Development of a robot for evaluating tennis rackets,” J. Robot. Mechatron., Vol.13, No.1, pp. 74-79, 2001. https://doi.org/10.20965/jrm.2001.p0074
- [6] A. Ming and M. Kajitani, “Development of a golf swing robot to simulate human skill,” J. Robot. Mechatron., Vol.12, No.3, pp. 325-332, 2000. https://doi.org/10.20965/jrm.2000.p0325
- [7] A. Ming and M. Kajitani, “Human dynamic skill in high speed actions and its realization by robot,” J. Robot. Mechatron., Vol.12, No.3, pp. 318-324, 2000. https://doi.org/10.20965/jrm.2000.p0318
- [8] T. Maruyama, C. Xu, A. Ming, and M. Shimojo, “Motion control of ultra-high-speed manipulator with a flexible link based on dynamically coupled driving,” J. Robot. Mechatron., Vol.18, No.5, pp. 598-607, 2006. https://doi.org/10.20965/jrm.2006.p0598
- [9] S. Suzuki, “Torque planning of a new golf-swing robot to emulate skillful,” J. Robot. Mechatron., Vol.16, No.4, pp. 355-361, 2004. https://doi.org/10.20965/jrm.2004.p0355
- [10] S. Pu, “Development and application of sports video analysis platform in sports training,” J. Adv. Comput. Intell. Intell. Inform., Vol.23, No.1, pp. 139-145, 2019. https://doi.org/10.20965/jaciii.2019.p0139
- [11] M. Takeuchi, J. Shimodaira, Y. Amaoka, S. Hamatani, H. Hirai, and F. Miyazaki, “Reconstruction of human skills by using PCA and transferring them to a robot,” J. Robot. Mechatron., Vol.26, No.1, pp. 51-58, 2014. https://doi.org/10.20965/jrm.2014.p0051
- [12] K. Kamijo, S. Fukuzumi, and T. Yamazaki, “Virtual reality system using psychological and physiological data, – An application to sports image training system –,” J. Robot. Mechatron., Vol.4, No.1, pp. 25-30, 1992. https://doi.org/10.20965/jrm.1992.p0025
- [13] K. Arasawa and S. Hattori, “Automatic baseball video tagging based on voice pattern prioritization and recursive model localization,” J. Adv. Comput. Intell. Intell. Inform., Vol.21, No.7, pp. 1262-1279, 2017. https://doi.org/10.20965/jaciii.2017.p1262
- [14] T. Hayashi, “Spin-rate Kakumei,” BASEBALL MAGAZINE SHA Co., Ltd., 2019 (in Japanese).
- [15] H. Ryutaro, “Aerodynamics in baseball game,” The Japan Society of Fluid Mechanism Nagare, Vol.39, pp. 163-166, 2020.
- [16] H. Kazama, M. Hariyama, and M. Kameyama, “Design of a VLSI processor based on an immediate output generation scheduling for ball-trajectory prediction,” J. Robot. Mechatron., Vol.12, No.5, pp. 534-540, 2000. https://doi.org/10.20965/jrm.2000.p0534
- [17] M. Hirano, K. Iwakuma, and Y. Yamakawa, “Multiple high-speed vision for identical objects tracking,” J. Robot. Mechatron., Vol.34, No.5, pp. 1073-1084, 2022. https://doi.org/10.20965/jrm.2022.p1073
- [18] T. Watanabe and T. Matsuno, “Development of a pitching practice ball with rotational speed measurement and visual feedback,” Proc. of the Robotics and Mechatronics Conf. 2024, 2P1-I10, 2024. https://doi.org/10.1299/jsmermd.2024.2P1-I10
- [a] T. Watanabe and T. Matsuno, “Proposal of pitching practice ball that visualize rotation rate and measurement method for improving pitching skills,” Proc. of SHD 2024, B-3-1, 2024. https://doi.org/10.1299/jsmermd.2024.2P1-I10
- [b] Rapsodo. https://rapsodo.com/ [Accessed April 27, 2026]
- [c] TrackMan. https://www.trackman.com/baseball [Accessed April 27, 2026]
- [d] Hawk-Eye Innovations Ltd. https://www.Hawkeyeinnovations.com/ [Accessed April 27, 2026]
- [e] Mizuno Corporation (in Japanese). https://jpn.mizuNo.com/baseball/products/MAQ [Accessed April 27, 2026]
- [f] SSK CORPORATION (in Japanese). https://www.sskbaseball.com/item/detail/2084 [Accessed April 27, 2026]
- [g] STRIKE Smart Baseball. https://en.shop.jingletek.com/ [Accessed April 27, 2026]
This article is published under a Creative Commons Attribution-NoDerivatives 4.0 Internationa License.