
Paper:
Modeling School-Bus-Shinkansen Evacuation Strategies for Volcanic Disasters: A Case Study in Kagoshima, Japan
Andreas Keler†
 and Masato Iguchi
Sakurajima Volcanic Disaster Risk Reduction Research Center, Crisis Management Division, Kagoshima City
11-1 Yamashita-cho, Kagoshima, Kagoshima 892-8677, Japan
†Corresponding author

This study examines microscopic evacuation simulations using predefined bus fleets to move residents from affected areas to safety, with a focus on volcanic disasters, an often-overlooked Scenario compared to earthquakes or floods. Stratovolcano eruptions, such as those from Sakurajima near Kagoshima City, can trigger prolonged crises, with massive ash and pumice severely disrupting roads and urban infrastructure. In dense cities, private vehicle evacuations risk extreme congestion, making organized, large-scale bus-based strategies essential. This research models bus fleet operations under conditions of an imminent eruption. Besides following the suggestion of the City of Kagoshima for each household to use the passenger car for evacuating to respective shelters outside the city, we reason on how to evacuate the most vulnerable road users, namely children and elderly people in a fast and safe way, especially during typical working hours of a weekday in the central business district of the city. Therefore, we calculate bus routes connecting specified building types (in our example schools) with the Kagoshima-Chuo Shinkansen Station, enabling the fast evacuation (e.g., to Kumamoto) of a large number of persons. For reasoning about optimal setups for this strategy, we define three different scenarios that use the same traffic flow simulation network, but varying road user agents compositions with (Scenario 1) only simulating evacuation buses, students and teachers entering and exiting them (and walk to a train platform), Shinkansen used to transport the evacuees to Kumamoto Station, (Scenario 2) addition of passenger-car demand estimated from real traffic counts at 287 map-matched detectors on August 5, 2025 (for the Japanese standard time between 7:15 and 13:15), and (Scenario 3) all students and teachers are walking (as pedestrian road users) from respective school bus stops to the Kagoshima-Chuo Shinkansen Station (with passenger-car traffic demand from Scenario 2). After discussing the respective simulation outcomes, we suggest further simulation scenarios for future research.
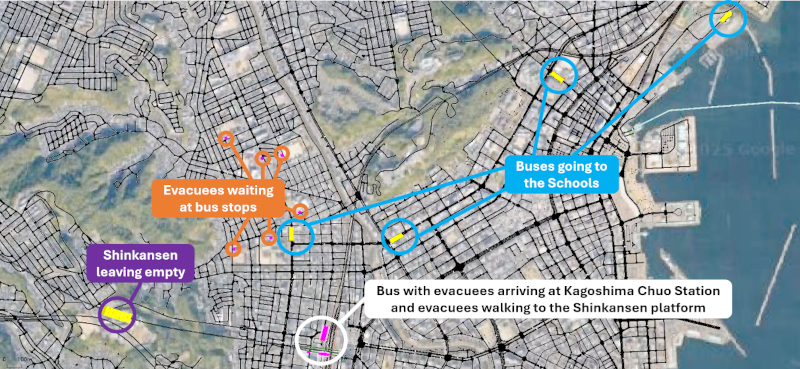
School-Bus-Shinkansen evacuation process
1. Introduction
The future event of a large-scale eruption of the Sakurajima Volcano in Kagoshima City reveals itself by a variety of indicators in similarity to its last large-scale eruption in 1914 1. In the case of a massive tephra fall, a Scenario that might highly influence more than half of the area of Kagoshima City, it requires issuing evacuation orders that refer to different parts of the city, depending on how ash fall and pumice fallout might influence the different areas 2. This case indicates that not only Sakurajima Island (as pictured in Fig. 1) will be evacuated, but as well the urbanized area of Kagoshima City. Similar to the Taisho eruption in 1914 4, the thickness of pumice fallout might reach 0.1 m to 2.0 m from the area around the crater to up to 30 km away (thickness of 0.3 m). As this historical eruption was influenced by west winds (270°) in winter, a future summer event might be influenced by east winds and reach the urbanized area of Kagoshima City 1.
The City of Kagoshima introduced guidelines, the “Massive Tephra Fall Response Plan” 3 for evacuating before a large-scale eruption in case of massive tephra fall reaching central parts of Kagoshima City as explained by Iguchi 1,5.
This evacuation concept is based on forecasts of a large-scale eruption and the associated wind direction and speed, which determine whether massive tephra fall is expected to affect the central urban area; the plan accordingly considers a six-hour evacuation window. Fig. 1 pictures the 6 zones of the potentially affected urban area of Kagoshima City, from A to F, as explained in the “Massive Tephra Fall Response Plan“ 3 with transparent wedge polygons (13 km) and colorized districts by absolute number of households in 2025 (13 km). Suggested evacuation shelter locations are visualized by purple dots and the suggested routes (currently 45 variants including alternative routes for same destinations) are colored as light green polylines. Those are the suggested long-distance evacuation routes from massive tephra fall before a Sakurajima large-scale eruption for a complete (301,933 households; 2025, October) city-wide evacuation within 6 hours. The white-striped areal polygon represents Kagoshima City area.
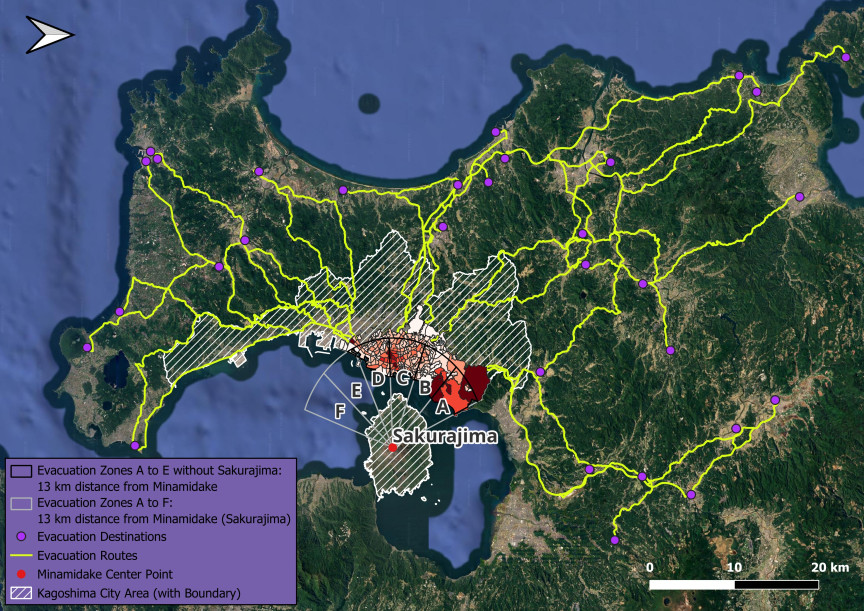
Fig. 1. Summary visualization of the suggested evacuation zones at Kagoshima City (polygon with white dashed lines shows city boundaries) in case of east wind after the event of a large-scale eruption of the Sakurajima Volcano with evacuation zones A to F (red choropleths showing household numbers per district), respective routes (light green lines) and destinations (purple dots) as specified in the “Massive Tephra Fall Response Plan” 3.
Additionally, Fig. 1 illustrates two wedge polygon types: light grey boundary 13 km wedges originating from the Minamidate crater for Zones A–F and black boundary 13 km wedges intersecting city district choropleths (varying red shading indicates different household numbers) for Zones A–E over Kagoshima’s urban area (excluding Sakurajima). Sakurajima is treated separately as a 7 km mandatory evacuation zone independent of wind direction. The red shading indicates 2025 district-level household counts 6, and the guideline assigns each household to a designated shelter destination. We assume that private passenger cars represent a major potential evacuation mode for evacuating a large number of people to shelters or other locations outside of the city 3. This is a challenging task, as private vehicle evacuations risk extreme congestion, especially in Kagoshima City, which is sometimes ranked as one of the most congested cities in Japan, particularly due to commuter traffic on working days 7.
Furthermore, vulnerable groups include seniors and children, who may not be as flexible in starting evacuation from home. Renne 8 refers to these groups as carless and vulnerable populations, indicating that private car ownership is an important factor in planning evacuation strategies. Avoiding road congestion by introducing organized, large-scale bus-based strategies in the central business district is an important driver of this work.
For planning purposes, evacuation strategies for city-wide long-distance evacuation under massive tephra fall risk are required that account for the local characteristics, including options and restrictions, of Kagoshima City’s infrastructure, with a focus on transportation. Kagoshima-Chuo Station is considered a strategic multimodal evacuation node because it connects local bus and rail services with the Kyushu Shinkansen line. The relevance of this rail connection is supported by previous research showing that Shinkansen services can improve interregional transportation conditions by reducing travel time and expanding accessible areas 9.
In this study, Kumamoto Station is used as a representative high-capacity destination for the modeled Shinkansen-based evacuation scenario. Kumamoto City was selected because, among the designated cities listed by the Japan Designated Cities Mayors’ Association, it is the nearest ordinance-designated city to Kagoshima City and is directly connected to Kagoshima-Chuo Station by the Kyushu Shinkansen 10,9. As an ordinance-designated city, Kumamoto also represents a major urban center with administrative and disaster-response capacities relevant to large-scale reception planning 11. This Scenario design does not imply that cross-prefectural evacuation is a general requirement for preemptive volcanic evacuation. Rather, operational destination selection depends on hazard conditions, transport availability, accommodation capacity, food-provision capacity, medical access, administrative coordination, and student-guardian handover requirements.
For preemptive evacuation, the Shinkansen connection is relevant because it provides a high-capacity transport option that can move evacuees from the urban core to another major urban center within a short time window. The Kyushu Shinkansen provides a direct long-distance rail connection from Kagoshima-Chuo Station to Kumamoto Station, with the fastest non-stop services requiring approximately 46 minutes.
Although closer municipalities along the line can be reached more quickly, their capacity to support large numbers of evacuees may be constrained by accommodation availability and other evacuation-support requirements, including food provision, medical access, and administrative coordination. These factors are consistent with general shelter-suitability considerations 12, although their application to preemptive volcanic evacuation must account for volcanic hazard conditions and scenario-specific evacuation requirements. In addition, closer municipalities may also remain exposed to tephra-fall risk depending on wind direction and eruption conditions.
This research addresses numerous problems of evacuating a high number of people (more than 300,000 households) within a short time restricted by the general low road capacity of inner-city roads, in comparison with national highways 13. The study also proposes a refined framework for volcanic disaster evacuation, emphasizing the evolving nature of urban evacuations and the need for timely, coordinated responses under rapidly worsening conditions.
1.1. Microscopic Traffic Flow Simulation for Volcanic Evacuation Planning
Great-scale volcanic eruptions can cause massive ash fall influenced by wind directions and speeds 14. Compared to other natural disaster types as earthquakes, tsunamis, floods, landslides or hurricanes, volcanic eruptions might reveal a long sequence of complex processes and events, such as massive tephra fall influenced by weather and climate. Living conditions during a volcanic disaster become increasingly difficult over time, as continuous ash fall restricts the usage of (1) water, (2) electricity, (3) communication and (4) transportation networks, simply due to the physical abilities of volcanic ash, including its difficulty of removal from solid and liquid bodies and its increased capillary abilities 15.
Due to the high density of volcanic ash, it is a threat for the stability of the built infrastructure. Therefore, citizens affected need to evacuate the areas immediately as the life quality decreases rapidly 16.
The novel guidelines for evacuating more than 300,000 households from Kagoshima City explain how each household may use a private passenger car to leave the city via dedicated evacuation routes 3. This implies that every household has the possibility of using one passenger car to leave the city borders. Nevertheless, we assume that this is challenging at selected times of a typical working day: children are at school, elderly people in nursing homes, and numerous adults working in the central business district in the center of Kagoshima City. The first two groups mentioned can be described as vulnerable road users, as they rely on active travel modes and mobility aids, such as bicycles, walking, walkers, or wheelchairs. Another alternative would be public transportation, although its use may be restricted during volcanic eruption events 17,18.
This study develops a microscopic traffic simulation testbed to identify efficient volcanic-evacuation strategies for vulnerable groups, aiming to move people beyond Kagoshima’s city limits as quickly as possible. Because rail evacuation is critical at city scale, the Kyushu Shinkansen is explicitly modeled. Its use is examined as a conditional pre-impact evacuation option rather than as a mode assumed to remain available under all volcanic-hazard conditions: the strategy is relevant only if Shinkansen operations can continue under the applicable safety standards during the assumed evacuation window. The choice between transfer via Kagoshima-Chuo Station and direct evacuation toward locations outside the affected area should therefore be determined by the expected hazard extent and the spatial relation between evacuation origins, safe destinations, and the available transport network. The plan-defined receiving municipalities and target points are located outside Kagoshima City but within Kagoshima Prefecture, and the evacuation across prefectural borders is not anticipated in the Massive Tephra Fall Response Plan 3.
In the present case study, schools are used as points of interest for defining evacuation origins. However, these origin locations are exchangeable within the proposed framework and may also represent other facility types that require organized evacuation support, such as nursing homes or comparable institutional settings.
We ask whether organized bus-based evacuation can rapidly evacuate students, teachers, and other vulnerable populations under weekday traffic. Three scenarios are tested: (1) evacuation buses transporting students and teachers from schools to Kagoshima-Chuo Station followed by Shinkansen evacuation to Kumamoto, (2) Scenario 1 with background traffic from detector-based demand to capture congestion effects, and (3) pedestrian-only evacuation from schools to the station. Accordingly, these scenarios are not designed as a direct modal comparison with the plan’s household-based private-car evacuation, but as a complementary strategy for school-based and other vulnerable populations whose immediate access to private cars may be limited during a typical working day.
In this study, modeling refers to the microscopic representation of the connected evacuation process from facility-based origins to intercity rail departure. This includes evacuation-bus movements on the urban road network, pedestrian access and transfer at Kagoshima-Chuo Station, and Shinkansen transport toward Kumamoto within one simulation framework. The novelty of the approach lies in linking these road-, station-, and rail-based components as one operational chain for preemptive volcanic evacuation, rather than examining them as separate transport processes.
The expected contribution is a quantitative assessment of congestion and multimodal interactions in volcanic disasters and practical guidance for improving large-scale urban evacuation plans.
To answer this research question, we use the microscopic traffic simulator SUMO 19 to model lane-level congestion, bus operations, pedestrian access, and rail transfer at Kagoshima-Chuo Station. Background traffic demand is estimated from detector counts, while evacuation demand is generated from school locations and assigned group sizes. Performance is evaluated using evacuation completion time, person travel and waiting times, and bottleneck formation at key road links and station access points.
1.2. Structure of This Work
After a brief introduction, Section 2 outlines the methodology for building a traffic flow simulation testbed for urban volcanic-evacuation planning. It covers data preprocessing, bus route and passenger estimation, integration of the Shinkansen link between Kagoshima-Chuo and Kumamoto, and background-demand modeling using real traffic count data. The section concludes with three behavioral scenarios, where Scenario 1 serves as the baseline without background traffic. Section 3 presents the simulation results, and Section 4 discusses the findings and future work.
2. Methodology
2.1. Preprocessing Open Data Inputs and Micro-Simulation Network Generation
The simulation network is generated from open road data provided by OpenStreetMap (OSM) (Fig. 2(a)) and converted 20 into a routable microscopic traffic model (Fig. 2(b)) following established workflows 21,22. Building footprints are used to identify school locations as evacuation origins, while Kagoshima-Chuo Station (Fig. 2(b), within yellow circle) is represented as the main transfer hub to high-speed rail. To enable long-distance evacuation, the required Kyushu Shinkansen corridor segment (Fig. 2(c)) is integrated into the city-scale network and aligned so that rail and road infrastructure overlap consistently in one shared coordinate space. In the model, an express Kyushu Shinkansen service departs every 15 minutes from Kagoshima-Chuo Station and travels non-stop to Kumamoto Station in about 46 minutes, providing the backbone for rail-based evacuation.
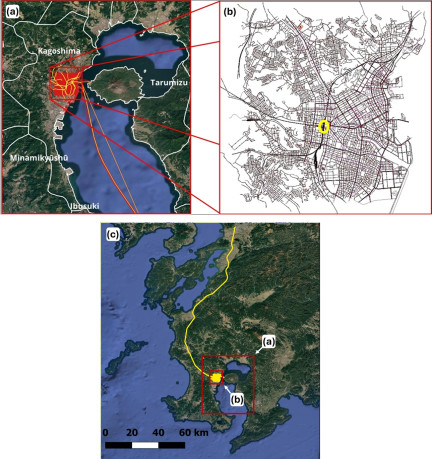
Fig. 2. Overview of the simulation study area and network components with (a) OSM geodata input, (b) converted routable simulation network, (c) Kyushu Shinkansen to Kumamoto, (d) Kagoshima City study domain, and (e) Kagoshima-Chuo Station as the main transfer hub.
2.2. Calculating Optimal Evacuation Routes
Evacuation bus routing is derived using a Traveling Salesperson Problem (TSP) approach based on an open routing service implementation 23. School locations are represented by centroid points derived from their footprints and linked to the closest traversable road segments to ensure routes follow the street network. We first evaluate a larger candidate set of 26 schools within a 2 km radius of Kagoshima-Chuo Station and then reduce the experiment scope to six schools in the north-western area for controlled simulation runs (Fig. 2(b)). The resulting route connecting the six schools and the station has a length of 5,124 m and an estimated travel time of 745 s (Fig. 3). Throughout the study, we distinguish between (a) routes reflecting guideline-based evacuation intentions and (b) alternative routes produced by network-based optimization for comparison. Due to the specific robustness of the used tracemapper 24 method only an aggregated route gets matched to our SUMO simulation network. We solve this issue by exporting our route into a trace (such as a GPS trajectory) and then between densifying to a 10 m spacing, increasing the number of points from 41 to 534 (\(\sim\)5.1 km total). The matching itself is conducted in a more permissive way including acceptance of small misses (to avoid teleporting), a higher search radius per point of 60 m, a candidate point score smoothing procedure to remain on a corridor, and a pre-query of available junction connectors at every intersection.
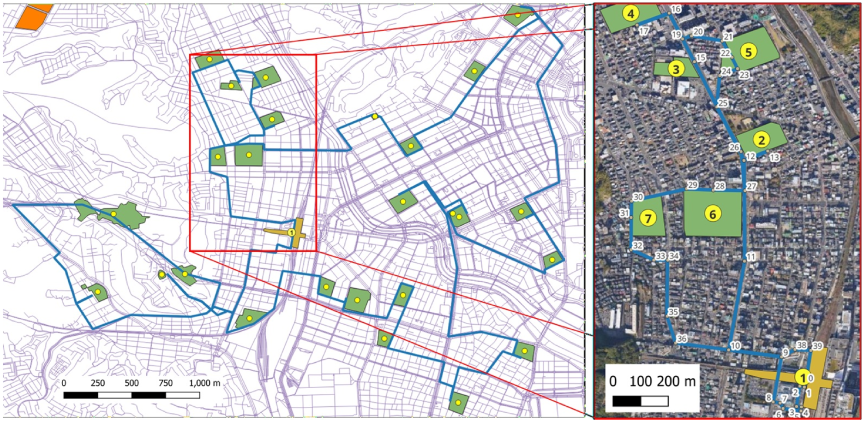
Fig. 3. A solution for the TSP via ORS 23 starting from Kagoshima-Chuo Station (1) and (left) 26 schools within 2 km radius (Euclidean distance), and with (right) 6 schools (2 to 7) as a subset for conducting simulation experiments.
The workflow for the route instruction generation can be applied in an automated way in case the converted SUMO microsimulation network is not too altered in space and topology from its original OSM road network representation. After a first visual inspection, we found that several segments used in OpenRouteService (ORS) were not accessible for motorists, such as the circle around Kagoshima-Chuo Station at the origin of the route (see yellow number 1 in Fig. 3). Subsequently, we excluded the route segment from 0 to 1 (white numbers, see Fig. 3, accessible by persons), so that evacuation buses start at the white number 1 in Fig. 3 and passengers exit the bus at number 31 and walk to the Shinkansen platform located at 0. Although 26 schools within a 2 km radius of Kagoshima-Chuo Station were initially identified as candidate evacuation destinations, the final experiments focus on 6 schools to establish a controlled and operationally interpretable simulation setting. Serving all 26 schools would require a substantially more complex bus route system and introduce large differences in route length, cycle time, service frequency, and congestion exposure, making the results more difficult to interpret. The reduced setting is also more consistent with the assumed deployment of 20 physical buses, considering not only vehicle availability but also likely limitations in available human drivers during an emergency. Under this fleet constraint, serving all 26 schools would likely require longer and less efficient routes or lower service frequencies. The 6-school configuration is therefore treated as a controlled experimental Scenario rather than as an optimal destination selection.
Nevertheless, the results also suggest a practical direction for extending this framework toward evacuation from all 26 schools. Because the six schools examined here are located relatively close to Kagoshima-Chuo Station, Scenario 3, in which evacuees walk directly to the station, provides a relevant benchmark. Its shortest total evacuation time indicates that walking can be an effective strategy for schools located near the station. Accordingly, under limited bus availability, a hybrid evacuation strategy may be more efficient than assigning buses uniformly across all schools: students and teachers from nearby schools could evacuate on foot, while the available buses are allocated to schools located farther from the station. Such a strategy would preserve the operational simplicity of the current experiment while offering a more scalable basis for future analyses targeting evacuation from the full set of 26 schools.
2.3. Implementing the Base Scenario: Traffic Flow Modelling and Simulation Setup
The base evacuation design assumes a capacity of 50 passengers per evacuation bus and 1,000 passengers per N700 Kyushu Shinkansen (8 cars). A fleet of 20 buses operates as a continuous 24-hour circular service (compare routes in Fig. 4) connecting seven designated bus stops and Kagoshima-Chuo Station.
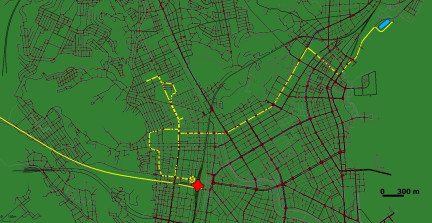
Fig. 4. Experimental routing view with defined routes (in yellow) for persons, buses and trains with marked locations of main Kagoshima City bus terminal (blue) and Kagoshima-Chuo Station (red).
Bus operations are initialized from the main Kagoshima City bus terminal to reflect realistic deployment conditions, and the effect of this starting location is illustrated by the spatial adjustment of bus demand origins (Fig. 5). The implemented bus circulation and school-to-station evacuation structure are summarized in the experimental routing view (Fig. 4).
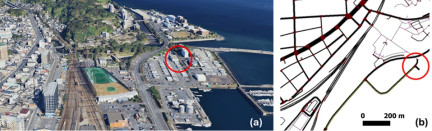
Fig. 5. Bus demand adjustment by setting a realistic starting position (red circle) of evacuating buses at the main Kagoshima City bus terminal, with (a) Google Maps 3D View and (b) SUMO Network View in NetEdit 25.
2.3.1. Simulating Evacuated Passengers (Waiting, Riding, Walking)
4,825 evacuees are represented as persons associated with the schools listed in Table 1, including both pupils and teachers. Teacher numbers are estimated using proportional assumptions reported by Hojo 26 (approximately 14%–17%), which increases the total number of evacuees compared to pupil-only estimates. The resulting sum of school-specific pupil numbers and estimated teacher numbers yields the total simulated demand of 4,825 evacuees.
| ID | Name (English translation) | Type (building) | District (city, town) | Estimated number of students and teachers | Buses required | |
| Internet review | Census [raw value] | |||||
| 1 | Kagoshima-Chuo Station | Train station | Take 1-chome | 0 | 0 [0] | 0 |
| 2 | Kagoshima Prefectural Tsurumaru High School | High school | Yakushi 2-chome | 476 | 73 [72.6] | 10 |
| 3 | Kagoshima High School | High school | Yakushi 1-chome | 1,700 | 27 [27] | 34 |
| 4 | Kagoshima Municipal Harayoshi Elementary School | Elementary school | Harara 2-chome | 862 | 41 [40.8] | 18 |
| 5 | Kagoshima Municipal Josai Junior High School | Junior high school | Josai 2-chome | 728 | 85 [84.6] | 15 |
| 6 | Kagoshima Municipal Nishida Elementary School | Elementary school | Yakushi 2-chome | 583 | 122 [122.4] | 12 |
| 7 | Tsumagari Gakuen Educational Corporation Josai Campus | High school | Josai 3-chome | 476 | 18 [18] | 10 |
For the initial experiments, student and teacher counts are taken from publicly available school information (“internet review”) and serve as the base demand for generating evacuation movements by bus along the implemented routes (Fig. 4, Table 1). These values are used in Scenarios 1–3. In later stages, census-based estimates are derived by converting five-year age-group population totals into Japanese school-stage totals and distributing them to school buildings using footprint-based size proxies (summarized in Table 1). The resulting “Census [raw value]” estimates should not be interpreted as observed school enrolment. Rather, they indicate the potential number of school-age residents associated with the respective city districts and are used to describe possible commuter patterns of students traveling from residential districts to individual schools. This explains why the census-based values can differ substantially from the school-specific pupil numbers obtained through the internet review. The census-based estimates are not used for the evacuation demand implemented in Scenarios 1–3, but are retained as a potentially useful basis for more spatially detailed demand estimation in future studies. In addition, passenger-car agents are introduced as background traffic demand in scenarios that include congestion effects (see Section 2.4).
2.3.2. Simulating High-Speed Rail Evacuation (Kyushu Shinkansen)
Rail evacuation is implemented through Kagoshima-Chuo Station, using access paths that connect the bus drop-off area near the western station exit to Kyushu Shinkansen Platform 11 (illustrated in Fig. 6; persons are exaggerated in size for visualization purpose).
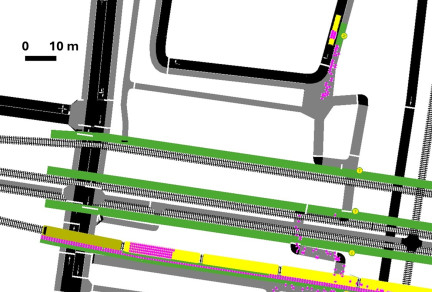
Fig. 6. Pedestrian access and rail boarding at Kagoshima-Chuo Station, connecting the west exit and bus drop-off area (small green rectangle) to Kyushu Shinkansen Platform 11 (green lines). Yellow boxes denote train cars; pink dots show pedestrians (enlarged for visibility).
The represented station access structure follows the observed spatial arrangement of the bus drop-off area, western station entrance, and Shinkansen platform access at Kagoshima-Chuo Station.
To ensure realistic transfer time assumptions, walking durations from two station entry points to the platform area are calibrated using a tracking experiment conducted with Strava 27. The model includes a 5-minute boarding process, meaning each train becomes available shortly before departure, while departures remain fixed at a 15-minute headway. Every 15 minutes an Express Kyushu Shinkansen train is departing from Kagoshima-Chuo Station and requires a 46 minutes non-stop ride to Kumamoto Station. First trial simulations indicate that the resulting walking-time distribution 28 is consistent with the recorded trajectories.
2.3.3. Background Traffic Demand Estimation and Generation
Kagoshima prefecture has 811 cross-sectional traffic count detectors, of which 287 are matching with the generated simulation network (compare to Fig. 2(b)) pictured in Fig. 7. These detectors (pink points in Fig. 7) are video cameras that observe traffic in a specific direction (visualized by blue arrows in Fig. 7) in a cross section of the road space. This means that one edge of our simulation network might correspond with one detector. For each detector monthly 5-minute-resoluted traffic count records are freely available as Open Data 29.
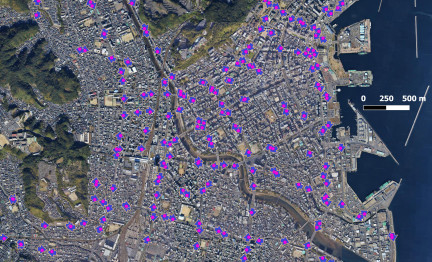
Fig. 7. Example map view on the 287 cross-sectional detector locations (pink dots) with directional attributes (blue arrows) used for estimating the passenger-car demand.
In our approach, we also make use of virtual lane-based induction loop detectors 30 for traffic demand estimation and use the point to lane matching approach presented in Fig. 8. The idea is to find candidate points along road edges with the closest Euclidean distance to the cross-sectional detector locations. Subsequently a query is performed on the edge for obtaining the number of lanes in one direction and the virtual lane-based induction loop detectors are set in parallel to each other in every lane of a specific edge.
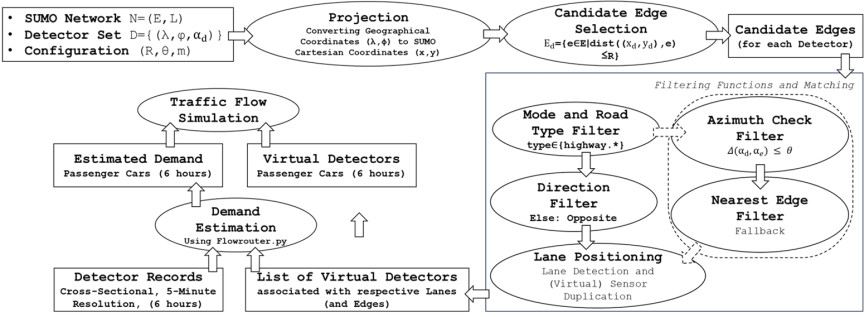
Fig. 8. Demand estimation workflow based on available detector location and their 5-minute-resoluted monthly records.
The 5-minute counts are then equally distributed among the lanes and in case of vehicle counts lower than the number of lanes, we assign the most central lane with the value lower than the absolute number of lanes of one edge. After matching detector locations to the closest road segments and distributing 5-minute counts across available lanes (Figs. 7 and 8), the resulting demand is converted into passenger-car routes and flows 31.
A preliminary simulation run using only passenger cars is conducted to validate whether the generated demand produces a plausible spatial distribution of trip origins and network loading before integrating evacuation agents.
In parallel, geometrical and topographical adjustments of the road network representation are applied to guarantee a consistent and routable network structure, including realistic connectivity and stable link geometry for subsequent multimodal evacuation experiments.
2.4. Scenario Design and Analytical Framework
Person capacities are set to 50 passengers per evacuation bus and 1,000 passengers per N700 Kyushu Shinkansen, with 20 buses operating as a 24-hour circular service from the main Kagoshima City bus terminal and serving seven designated bus stops. It is to mention that we assume full train capacity. Nevertheless, boarding and alighting times are not calibrated yet, and the inclusion of assumed, daily train users (commuters) and tourists will likely be taken into account in future research.
To explore optimal configurations, we define three scenarios using the same microscopic traffic simulation network but varying road-user compositions: Scenario 1 simulates only evacuation buses transporting students and teachers from school locations to Kagoshima-Chuo Shinkansen Station, followed by rail evacuation to Kumamoto Station; Scenario 2 adds background passenger-car demand estimated from 287 map-matched detectors (August 5, 2025, 07:15–13:15 JST) to capture congestion and interaction effects; and Scenario 3 replaces bus access with a pedestrian-only approach where all students and teachers walk from school bus stops to Kagoshima-Chuo, while retaining the passenger-car traffic from Scenario 2.
Across all scenarios, key constraints include the spatial distribution of households and activities (homes, schools, CBD), weekday time-of-day conditions, multimodal interactions (buses, private cars, pedestrians, rail), realistic demand representation, and public transport capacity limits. The experiments assume a pre-eruption, imminent-event setting; therefore, ash-related impacts such as road disruption and additional eruption-induced congestion are not considered.
The simulated pedestrians use the default parameterization 30, without yet distinguishing walking speeds or pedestrian types; vulnerable road-user classes as well as age-related differences will be addressed in future work.
We apply a pedestrian width of 0.48 m, length of 0.21 m 32, minimum gap of 0.25 m, maximum speed of 5 m/s, and desired maximum speed of 1.39 m/s 33. Pedestrians move on footpaths, sidewalks, and walking areas using SUMO’s striping model 28, which divides lane width into discrete lateral stripes with a default stripe width of 0.64 m 34.
The pedestrian router generates bidirectional walking routes and accounts for delays at nearby red-light crossings. For edges reached during a red phase, travel time is computed as
Finally, Strava-based walking trajectories between two station entry points and the platform area were used to identify pedestrian parameter settings that best reproduce observed transfer times relative to the default configuration. Together with the detector-based background traffic demand and the observed station access structure, this provides empirical grounding for the modeled road-traffic and station-transfer components used in the Scenario experiments.
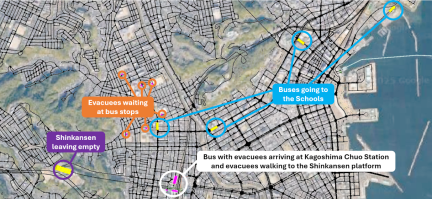
Fig. 9. Map view on Scenario 1 with evacuation buses (yellow boxes in blue circles) only, transporting evacuees (fuchsia) from designated school locations (orange circles) to Kagoshima-Chuo Shinkansen Station (white circle), followed by rail evacuation to Kumamoto using Shinkansen (purple circle).
2.4.1. Scenario 1: Bus-to-Rail Evacuation Without Background Traffic
Scenario 1 simulates only evacuation buses transporting students and teachers from the selected school locations to Kagoshima-Chuo Station, followed by Shinkansen evacuation to Kumamoto.
Figure 9 illustrates the base evacuation process: buses depart to collect evacuees waiting at school-related stops, deliver them to Kagoshima-Chuo Station, and evacuees continue on foot to the Shinkansen platform, representing a clean bus-rail transfer without congestion effects.
2.4.2. Scenario 2: Bus-to-Rail Evacuation with Background Traffic
Scenario 2 extends Scenario 1 by adding passenger-car demand estimated from the detector dataset, enabling analysis of congestion and bus-car interaction effects.
Figure 10 shows the same bus-based student and teacher evacuation chain as Scenario 1, but with additional background passenger-car traffic (Fig. 10(b)) derived from detector-based demand estimation. The map highlights how evacuation buses and pedestrians interact with general traffic near Kagoshima-Chuo, while detector locations (Fig. 10(a)) support validation of the generated demand.
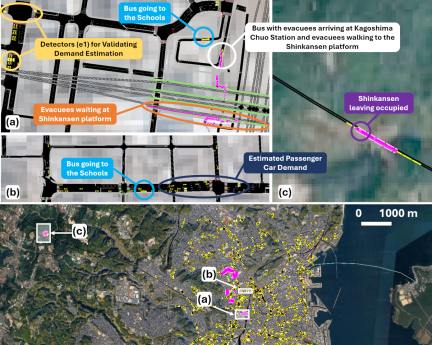
Fig. 10. Map views on Scenario 2 with (a) real-world detector counts (yellow circles) capturing congestion and interactions, (b) Scenario 1 with added background passenger-car traffic (navy circles) estimated from cross-sectional counts, and (c) occupied Shinkansen departures.
2.4.3. Scenario 3: Students and Teachers Walking to Kagoshima-Chuo Station with Background Traffic
Scenario 3 assumes all students and teachers walk from their school locations to Kagoshima-Chuo Station instead of using evacuation buses, while background passenger-car traffic remains active as in Scenario 2.
Figure 11 visualizes a pedestrian-only evacuation access strategy, where students and teachers walk directly from school areas to Kagoshima-Chuo Station along shortest-path routes. The zoomed section emphasizes realistic interactions with traffic lights and vehicles under congested urban conditions.
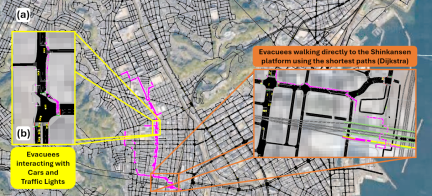
Fig. 11. Map view on pedestrian-only evacuation, with (a) the routes from schools to Kagoshima-Chuo Station and (b) evacuees interacting with cars and traffic lights.
3. Results
3.1. Per-Person Access-to-Boarding Durations, Simulation Time and Inter-Boarding Durations
The plot in Fig. 12 compares the total per-person time required to reach Shinkansen boarding across the three scenarios, measured from evacuation-bus boarding in Scenarios 1 and 2 and from school departure on foot in Scenario 3 (sorted by ascending person-level access-to-boarding duration). Scenario 1 (bus-based evacuation without background traffic) yields the shortest and most consistent person-level access-to-boarding durations, with most persons boarding the Shinkansen within roughly 10–30 minutes. Scenario 2 (bus-based evacuation with background passenger-car traffic) shifts the curve upward, indicating longer person-level access-to-boarding durations caused by congestion and interactions with general traffic before Shinkansen boarding, and increases the upper range to about 40 minutes for persons with the longest access-to-boarding durations. Scenario 3 (walking access from school under background traffic) produces the longest person-level access-to-boarding durations overall and the widest spread, with times ranging from about 20 minutes up to nearly 70 minutes, showing that walking-based access substantially increases the time required to reach Shinkansen boarding and leads to stronger inequalities between evacuees with shorter and longer access-to-boarding durations.
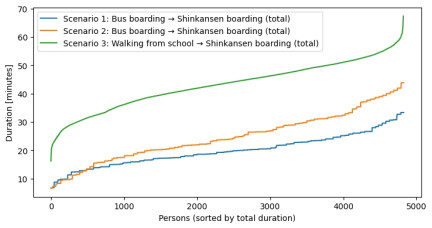
Fig. 12. Per-person access-to-Shinkansen-boarding durations sorted by ascending duration.
The plot in Fig. 13 shows the distribution of total time from initial access to Shinkansen boarding for all simulated persons. Scenario 1 concentrates strongly around shorter person-level access-to-boarding durations (roughly 15 to 25 minutes), indicating a short and stable transfer process when only evacuation buses operate. Scenario 2 shifts the distribution toward longer and more variable person-level access-to-boarding durations (about 20 to more than 35 minutes), reflecting congestion effects when background passenger-car traffic is included. Scenario 3 forms a clearly separate peak at substantially higher person-level access-to-boarding durations (around 40 to 55 minutes) with a long tail up to nearly 70 minutes, demonstrating that pedestrian-only access produces the longest and most variable person-level access-to-boarding durations before Shinkansen boarding.
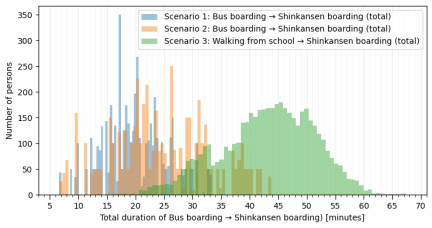
Fig. 13. Histogram of total access-to-Shinkansen-boarding durations.
The plot in Fig. 14 shows how the average time required to reach Shinkansen boarding changes over the course of the simulation. Scenario 1 remains relatively stable at around 18 to 23 minutes, indicating a robust bus-to-rail transfer under uncongested conditions. Scenario 2 fluctuates more strongly and reaches higher peaks (up to \(\sim\)33 minutes), suggesting that background passenger-car traffic introduces time-dependent delays and occasional congestion phases before Shinkansen boarding. Scenario 3 has the highest average person-level access-to-boarding duration, and this duration increases steadily over time (from \(\sim\)17 minutes to >50 minutes), indicating that walking-based access is associated with increasing person-level durations before Shinkansen boarding, likely due to longer access distances and increased interactions at crossings and signals as background traffic demand accumulates.
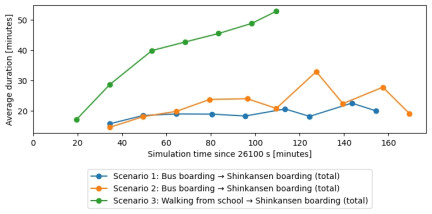
Fig. 14. Average access-to-Shinkansen-boarding durations vs simulation time (bin = 60 s).
Accordingly, Figs. 12–14 should be interpreted as results for person-level access-to-Shinkansen-boarding durations, while the system-level evacuation completion time is reported separately in Table 2.
| Attribute | Scenario 1 | Scenario 2 | Scenario 3 |
| Last non-empty bus arrival | 137.87 min | 163.30 min | N/A |
| Last person (Shinkansen arrival) | 191.40 min | 211.05 min | 149.32 min |
| Persons in last non-empty Shinkansen | 30 | 534 | 306 |
Table 2 summarizes the evacuation completion time for each scenario. It reports (i) the arrival time of the last occupied bus at Kagoshima-Chuo Station (if buses are used), (ii) the arrival time of the final evacuee at the Shinkansen destination (Kumamoto Station), and (iii) the number of passengers on the last non-empty Shinkansen. In Scenario 1, the last bus carrying passengers reaches Kagoshima-Chuo Station after 137.87 min. The final person arrives at Kumamoto Station after 191.40 min, and the last non-empty Shinkansen carries 30 persons. In Scenario 2, background traffic causes congestion and slows down the evacuation. The last occupied bus arrives after 163.30 min, and the final Shinkansen arrival occurs after 211.05 min. In this case, the last non-empty Shinkansen carries 534 persons. In Scenario 3, no buses are operated. Instead, evacuees reach the rail system on foot and continue by Shinkansen. The last person arrives at Kumamoto Station after 149.32 min, with 306 persons on the last non-empty Shinkansen.
This result reveals an important distinction between the person-level and system-level performance metrics used in this study. Figs. 12–14 and Table 3 describe the total per-person time required to reach Shinkansen boarding, measured from evacuation-bus boarding in Scenarios 1 and 2 and from school departure on foot in Scenario 3. For this metric, Scenario 3 performs less favorably than the bus-based scenarios. In contrast, Table 2 reports the overall evacuation completion time, measured by the arrival of the last simulated evacuee at Kumamoto Station. According to this system-level criterion, Scenario 3 has the shortest overall evacuation completion time. This difference occurs because all students and teachers in Scenario 3 can begin moving toward Kagoshima-Chuo Station immediately, whereas Scenarios 1 and 2 depend on finite bus fleet capacity, repeated route circulation, and sequential collection from multiple school locations. Scenario 3 therefore yields longer person-level access-to-boarding durations, but a shorter overall evacuation completion time in the present short-distance school setting.
| Attribute | Scenario 1 | Scenario 2 | Scenario 3 |
| Persons | 4,825 | 4,825 | 4,822 |
| Minimum duration | 6.60 min | 6.67 min | 16.18 min |
| First quartile (Q1) | 15.92 min | 19.15 min | 37.74 min |
| Median duration | 19.52 min | 23.75 min | 43.72 min |
| Mean duration | 19.76 min | 24.63 min | 43.04 min |
| Third quartile (Q3) | 23.40 min | 30.97 min | 49.25 min |
| Maximum duration | 33.30 min | 43.80 min | 67.35 min |
| Standard deviation | 5.43 min | 8.54 min | 8.26 min |
Additionally, Fig. 15 shows the number of evacuated persons boarding each Shinkansen departure over time for all three simulation scenarios. Each bar corresponds to one scheduled Shinkansen departure (15-minute headway), and the bar height represents the total number of boarded passengers at that departure.
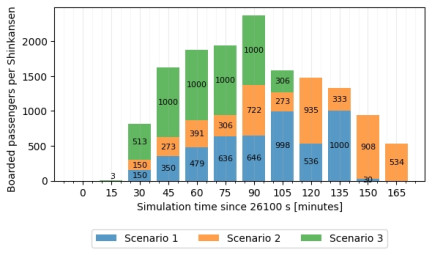
Fig. 15. Shinkansen boarding demand per departure (stacked bars).
To complement the distribution-based comparison of the total per-person time required to reach Shinkansen boarding, measured from evacuation-bus boarding in Scenarios 1 and 2 and from school departure on foot in Scenario 3, Table 3 summarizes the corresponding descriptive statistics. Scenario 1 shows the shortest durations, with a median of 19.52 min and a standard deviation of 5.43 min. Scenario 2 produces longer and more variable durations under background passenger-car traffic, with a median of 23.75 min and a standard deviation of 8.54 min. Scenario 3 results in the longest person-level access-to-Shinkansen-boarding durations, with a median of 43.72 min and a maximum of 67.35 min, while its standard deviation of 8.26 min remains close to that of Scenario 2. These statistics confirm that Scenario 3 performs less favorably for this person-level duration metric, even though Table 2 shows a shorter overall last-person arrival time (at Kumamoto Station) for Scenario 3. The reported person counts correspond to the valid duration records extracted from the same parser output used for Figs. 12–14; for Scenario 3, this results in 4,822 records. The three missing records correspond to pedestrians that were teleported during the simulation after remaining at the same location for more than 240 s, which can occur in rare cases when local pedestrian interactions on sidewalk polygons cause temporary blocking, particularly near intersections. Since these three records represent only 0.06% of the total Scenario 3 demand, and no complete access-to-boarding duration could be computed for them, they were excluded from the person-level duration statistics. This small number of missing records does not affect the interpretation of the distributional results.
3.2. Walking to Shinkansen Platform and Person Activity Durations
The plot in Fig. 16 shows the distribution of walking times from the station access area to the Shinkansen platform for Scenarios 1 and 2.
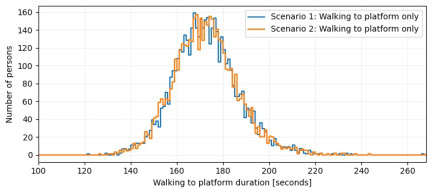
Fig. 16. Walking to platform durations (1-second bins, from 100 s to 268 s).
Both scenarios exhibit a clear unimodal, near-normal shape, with most pedestrians requiring roughly 160 to 190 seconds to reach the platform and a peak around 170 to 180 seconds. The strong overlap between the two histograms indicates that the platform access walk is highly consistent and only marginally affected by background traffic, suggesting that the main differences in total evacuation duration between Scenarios 1 and 2 are primarily driven by bus travel and road congestion, rather than by station-transfer walking time.
The plot in Fig. 17 presents the total evacuation time by activity phase, aggregated across all persons in person-hours. For a phase \(p\) (e.g., waiting for the bus, riding the bus, walking to the platform, waiting for the Shinkansen), the total person-hours are defined as
The unit of \(\mathit{PH}_p\) is
Example: If \(100\) persons each wait \(10\) minutes (\(600\) s), then
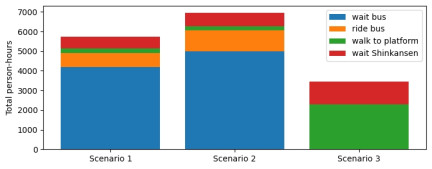
Fig. 17. Aggregated time by phase (person-hours).
In Scenarios 1 and 2, the largest share is waiting for evacuation buses, indicating that bus availability and boarding processes dominate overall delay. Scenario 2 shows a higher total time budget due to additional congestion effects, mainly reflected in increased bus waiting and in-vehicle travel. In Scenario 3, bus-related phases are absent and the total time is largely driven by walking to the platform and waiting for the Shinkansen, demonstrating that pedestrian-only access shifts delays from road operations to station access and rail waiting.
4. Discussion and Outlook
In this research, we show that we can model and simulate specific traffic flow simulation scenarios for accompanying a city-wide evacuation. The newly established (April 2025) Sakurajima Volcanic Disaster Risk Reduction Research Center in Kagoshima City, Japan, has numerous research topics related to predicting volcanic activities, their influence on people and how to reduce the risks during volcanic eruption events.
Current evacuation planning respects the car-oriented environment of Kagoshima City and that most inhabitants will rely on their private vehicle while leaving their homes after an early warning 3. Most of the used infrastructure has relatively high capacities of national highways and regular national roads 13 compared to the urban roads within the city. As Kagoshima has access to the Shinkansen network 9 and has a highly congested urban road network, which also influence specific traffic safety aspects 35, it is important to provide evacuation options that take advantage of the very short headways of the Shinkansen bullet train service.
The present work suggests an initial setup for simulation experiments for discovering options of using microscopic traffic flow simulation for answering these questions. Nevertheless, more advanced modeling tasks are required for implementing a city-wide evacuation testbed for volcanic disaster use cases.
4.1. Discussion
As a preventive measure for a potential large-scale eruption of Sakurajima Volcano in Kagoshima City 1, evacuation plans assume that residents leave the city either by private passenger car or with support from organized public transport services such as evacuation buses. This study focuses on the second strategy and demonstrates how bus-based evacuation routes can be designed using open data. We also show that the target group of an evacuation strategy can vary depending on the planning goal and available information; in our case, we focus on evacuating school students and teachers located near Kagoshima-Chuo Station.
The results from the three Scenario experiments provide insights into how vulnerable road users can be evacuated efficiently when two public transport modes with different capacities and headways are combined. In particular, bus operations should be designed in relation to Shinkansen service, because one Shinkansen train (1,000 passengers) corresponds to the capacity of roughly twenty evacuation buses (50 passengers each). From this perspective, the key objective becomes minimizing the time required to transport all simulated evacuees to Kumamoto while ensuring that Shinkansen departures are utilized efficiently and waiting times remain low. This capacity relation emphasizes that the practical value of Shinkansen-based evacuation depends not only on high rail capacity itself, but also on whether station access and feeder bus operations are organized so that this capacity can be used effectively within the available evacuation time.
In Scenario 1, the system performance is evaluated under idealized conditions without background traffic. Only two elements are calibrated: (i) the number of students and teachers per school, estimated from publicly available information, and (ii) walking times from the western entrance of Kagoshima-Chuo Station to Shinkansen Platform 11, derived from a Strava-based tracking experiment. The resulting walking-time distributions are close to normal and likely reflect the underlying pedestrian movement representation (“striping”) used in the simulation model 34.
Scenario 2 extends this setup by adding estimated private passenger-car demand to represent weekday congestion effects in the study area. This allows the analysis of how evacuation buses and pedestrians are delayed by interactions with general traffic, and it also enables a more realistic representation of combined multimodal operations during rush-hour conditions.
Scenario 3 shifts the access mode entirely by assuming that students and teachers walk directly to Kagoshima-Chuo Station instead of being collected by evacuation buses. The person-level results show that this strategy produces substantially longer total per-person times required to reach Shinkansen boarding, measured from school departure on foot, than the corresponding bus-boarding-to-Shinkansen-boarding durations in Scenarios 1 and 2. However, this does not imply that Scenario 3 is uniformly inferior. As shown in Table 2, the last simulated evacuee reaches Kumamoto Station earlier in Scenario 3 than in Scenarios 1 and 2. The reason is that all students and teachers can start moving toward the station immediately, while the bus-based strategies are constrained by fleet size, repeated route circulation, and sequential collection from several school locations.
The Scenario comparison therefore requires a clear distinction between two evaluation perspectives. For assessing overall evacuation completion, this study uses the last-person Shinkansen arrival time as the primary system-level metric. For interpreting the person-level duration before rail departure, we compare the total time required to reach Shinkansen boarding, measured from evacuation-bus boarding in Scenarios 1 and 2 and from school departure on foot in Scenario 3. Under the system-level completion metric, Scenario 3 performs best in the present short-distance school setting. Under the person-level duration metric, Scenarios 1 and 2 perform more favorably. A bus-based strategy may therefore remain preferable when evacuation planning prioritizes organized group transfer, reduced reliance on long pedestrian access, support for evacuees with limited mobility, or origins located farther from Kagoshima-Chuo Station. The results thus do not identify one universally superior access strategy, but instead show that pedestrian and bus-based evacuation perform differently depending on the evaluation criterion and the spatial and operational conditions of the evacuation setting.
From a practical perspective, the proposed simulation framework provides a structured basis for evaluating multimodal evacuation options under urban conditions in which road-based evacuation alone may face substantial operational constraints. Rather than treating evacuation modes independently, the framework enables their combined performance to be examined within one analytical setting and therefore helps identify how alternative evacuation arrangements may contribute to overall system effectiveness. This is relevant for evacuation policy because it supports evidence-based comparison of strategy options, and for operational planning because it allows potential capacity limitations, coordination requirements, and implementation challenges to be examined before emergency measures are adopted. The approach is therefore not limited to reproducing Scenario outcomes, but can contribute to the development of more robust multimodal evacuation concepts for Kagoshima and other urban areas facing similarly complex evacuation conditions.
4.2. Outlook
In future work, we will focus on demand-dependent vehicle routing strategies to reduce evacuation travel times and improve the efficiency of bus operations under varying congestion levels. A key methodological extension will be a clearer separation of travel-time components, distinguishing baseline travel time from additional delays caused by bus bunching and delays introduced by background passenger-car traffic. To strengthen the methodological foundation, we also plan to extend the progress documentation with a broader review of existing evacuation-routing and multimodal simulation approaches.
A further Scenario extension is the integration of traffic control measures at major signalized intersections in Kagoshima City. For this purpose, real (current or historical) signal timing information is needed, including coordinated offsets between intersections rather than approximations based on spatial distance. Implementing measured offsets and realistic signal programs is expected to improve the validity of travel-time estimates and the representation of bus reliability during peak demand.
In addition, we plan to evaluate the traffic safety of evacuation routes suggested in the “Massive Tephra Fall Response Plan” 3 using recent road traffic crash records from the National Police Agency. Crash-based indicators can provide complementary insights at the route and network level beyond travel-time performance alone 36,37. This safety assessment can be further extended by integrating traffic flow simulation outputs with surrogate safety measures to capture conflict-based risk patterns under different evacuation and congestion conditions.
To enhance realism, we aim to incorporate existing public transport services in Kagoshima using freely available General Transit Feed Specification (GTFS) feeds 38 and complementary information derived from OSM 39.
Moreover, we plan to develop improved visualization methods for simulated pedestrian waiting and walking behavior by introducing catchment-area representations linked to relevant points of interest rather than only to public transport stops, following concepts proposed by Keler et al. 40.
Another extension is the explicit modeling of heterogeneous multimodal agents 41 by redefining the scenarios with varying passenger loads, traffic demand levels derived from detector observations, and population distributions informed by high-resolution sources such as call detail records.
Furthermore, we will examine different categories of vulnerable road users and incorporate more realistic numbers of pupils and teachers, based on guidance from the Kagoshima City Board of Education. In addition, the elderly population is a key group in evacuation planning; therefore, we will include realistic estimates and the spatial distribution of relevant institutions in Kagoshima City, such as nursing homes.
In addition, we will investigate advanced traffic signal control strategies as a means to optimize evacuation performance. This includes replacing estimated fixed-time programs with actuated control 42, adapting cycle lengths 43 based on established methods such as Webster 44, and improving signal coordination through offset optimization 45 to support demand-adaptive progression (“green waves”) for evacuation buses 46. Even small changes in signal control and coordination may affect bus delays, reliability, and overall evacuation completion times. Beyond traffic control, the study will be extended toward systematically proposing alternative evacuation routes for comparable origin-destination pairs using advanced routing and optimization approaches.
Future work should also examine the role of Kagoshima-Chuo Station as a potential multimodal evacuation hub. This requires considering regular non-evacuee Shinkansen passengers, more realistic boarding and alighting processes, and the spatial assignment of evacuation origins for vulnerable groups such as seniors and children, who may depend on assisted mobility, public transport, or transfer hubs rather than private-vehicle evacuation from home.
For school-based evacuation scenarios, student-guardian handover requires explicit consideration. In line with the evacuation plan’s assumption of one passenger car per household, this could be represented in future simulations by household evacuation trips with intermediate pickup stops at schools. The bus- and Shinkansen-based strategy examined here can therefore be interpreted as a contingency or stress-test Scenario for cases in which guardian pickup is delayed, infeasible within the available evacuation time, or disrupted by road traffic congestion. This Scenario therefore complements, rather than replaces, local guardian-handover planning in school-based preemptive evacuation.
Finally, we plan to examine evacuation-specific traffic states in which disaster-induced congestion differs from ordinary rush-hour traffic because evacuation demand becomes strongly directional and may resemble large-scale post-event dispersal. This requires explicit modeling of the transition from background traffic to evacuation flows and of the operational control of vehicle fleets and public transport services. Together, these extensions would strengthen the framework for evaluating policy-relevant multimodal evacuation strategies and their operational applicability in Kagoshima and comparable urban contexts.
- [1] M. Iguchi, “Integrated research on large-scale eruption at Sakurajima Volcano,” J. Disaster Res., Vol.20, No.2, pp. 186-196, 2025. https://doi.org/10.20965/jdr.2025.p0186
- [2] K. Sugo, M. Onishi, Y. Yama, M. Iguchi, G. Nakano, K. Takenouchi, K. Yamori, and H. Shimamoto, “Study on the process of behavioral change of local residents in preparation for a large-scale eruption of Sakurajima,” J. Disaster Res., Vol.20, No.3, pp. 342-357, 2025. https://doi.org/10.20965/jdr.2025.p0342
- [3] Kagoshima City, “Kagoshima City Plan for Responding to Massive Tephra Fall,” Kagoshima City Hall, Kagoshima, 2023. https://www.city.kagoshima.lg.jp/kikikanri/documents/tairyoukaruishikazanbaitaioukeikaku202607.pdf [Accessed September 15, 2026]
- [4] M. Kanai, “Report on the eruption of Sakurajima volcano in the year 1914, and on the investigation and experiments concerning the eruptive materials and crop cultivation,” Kagoshima Higher Agricultural and Forestry School, 1920 (in Japanese).
- [5] M. Iguchi, “Chapter 18 – Volcano emergency planning at Sakurajima volcano,” P. Papale (Ed.), “Forecasting and Planning for Volcanic Hazards, Risks, and Disasters,” Vol.2, pp. 635-668, Elsevier, 2021. https://doi.org/10.1016/B978-0-12-818082-2.00018-4
- [6] Kagoshima City, “Population by age (5-year age group) and town/district.” https://www.city.kagoshima.lg.jp/soumu/soumu/soumu/shise/toke-02/jinko/h5-24daicho.html [Accessed January 9, 2026]
- [7] Kagoshima City, “Initiatives to combat traffic congestion.” https://www.city.kagoshima.lg.jp/kensetu/douro/gairoseibi/juutaitaisaku.html [Accessed January 9, 2026]
- [8] J. L. Renne, “Emergency evacuation planning policy for carless and vulnerable populations in the United States and United Kingdom,” Int. J. of Disaster Risk Reduction, Vol.31, pp. 1254-1261, 2018. https://doi.org/10.1016/j.ijdrr.2018.02.016
- [9] Y. Kojima, T. Matsunaga, and S. Yamaguchi, “The impact of new Shinkansen lines (Tohoku Shinkansen (Hachinohe–Shin-Aomori) and Kyusyu Shinkansen (Hakata–Shin-Yatsushiro)),” Transportation Research Procedia, Vol.25, pp. 344-357, 2017. https://doi.org/10.1016/j.trpro.2017.05.412
- [10] Japan Designated Cities Mayors’ Association, “Information on the Designated Cities.” https://www.siteitosi.jp/en/about/cities/ [Accessed June 17, 2026]
- [11] Japan Designated Cities Mayors’ Association, “Large-scale disaster response.” https://www.siteitosi.jp/en/about/respond-to-disaster/ [Accessed June 17, 2026]
- [12] C. Y. Lam and A. M. Cruz, “Topological network and fuzzy AHP modeling framework for the suitability analysis of evacuation shelters: A case study in Japan,” Int. J. of Disaster Risk Reduction, Vol.111, Article No.104696, 2024. https://doi.org/10.1016/j.ijdrr.2024.104696
- [13] A. Naobumi and M. Brase, “The Complete Guide to Japanese Systems,” IBC Publishing, 2012.
- [14] M. Iguchi and K. Ishii, “Quantitative forecasting of volcanic ashfall prior to the onset of vulcanian eruption by combining transport and dispersion simulation with ground deformation observation at Sakurajima Volcano, Japan,” J. Disaster Res., Vol.20, No.3, pp. 259-268, 2025. https://doi.org/.10.20965/jdr.2025.p0259
- [15] H. Rahadianto, H. Tatano, and M. Iguchi, “Uncertainty analysis of the prediction of massive ash fallout from a large explosive eruption at Sakurajima Volcano,” Earth and Space Science, Vol.11, No.1, Article No.e2023EA003174, 2024. https://doi.org/10.1029/2023EA003174
- [16] H. Rahadianto, H. Tatano, and M. Iguchi, “Multiscale impact assessment of massive ash fallout from a large eruption: What may happen if Sakurajima Taisho eruption occurs in contemporary Japan?,” J. of Disaster Science and Management, Vol.1, No.1, Article No.24, 2025. https://doi.org/10.1007/s44367-025-00023-1
- [17] K. Kim, P. Pant, E. Yamashita, and J. Ghimire, “Analysis of transportation disruptions from recent flooding and volcanic disasters in Hawai’i,” Transportation Research Record, Vol.2673, No.2, pp. 194-208, 2019. https://doi.org/10.1177/0361198118825460
- [18] E. Tomsen, J. M. Lindsay, M. Gahegan, T. M. Wilson, and D. M. Blake, “Evacuation planning in the Auckland Volcanic Field, New Zealand: A spatio-temporal approach for emergency management and transportation network decisions,” J. of Applied Volcanology, Vol.3, No.1, Article No.6, 2014. https://doi.org/10.1186/2191-5040-3-6
- [19] P. A. Lopez, M Behrisch, L. Bieker-Walz, J. Erdmann, Y.-P. Flötteröd, R. Hilbrich, L. Lücken, J. Rummel, P. Wagner, and E. Wiessner, “Microscopic traffic simulation using SUMO,” 21st Int. Conf. on Intelligent Transportation Systems (ITSC’2018), pp. 2575-2582, 2018. https://doi.org/10.1109/ITSC.2018.8569938
- [20] DLR, “netconvert.” https://sumo.dlr.de/docs/netconvert.html [Accessed January 9, 2026]
- [21] A. Keler, S. Amini, J. Lindner, and K. Bogenberger, “Introducing data-format-dependent road network conversion techniques–Lessons learned from the Digital Twin Munich,” 31st Annual Geographical Information Science Research UK Conf. (GISRUK), 2023. https://doi.org/10.5281/zenodo.7823414
- [22] A. Keler, W. Sun, and J.-D. Schmöcker, “Generating and calibrating a microscopic traffic flow simulation network of Kyoto: First insights from simulating private and public transport,” SUMO Conf. Proc., 2023.
- [23] P. Neis and A. Zipf, “Openrouteservice.org is three times ‘open’: Combining OpenSource, OpenLS and OpenStreetMaps,” GIS Research UK (GISRUK’08), 2008.
- [24] DLR, “tracemapper.py.” https://sumo.dlr.de/docs/Tools/Routes.html#tracemapperpy [Accessed January 9, 2026]
- [25] DLR, “netedit.” https://sumo.dlr.de/docs/Netedit/index.html [Accessed January 9, 2026]
- [26] M. Hojo, “Association between student-teacher ratio and teachers’ working hours and workload stress: evidence from a nationwide survey in Japan,” BMC Public Health, Vol.21, No.1, Article No.1635, 2021. https://doi.org/10.1186/s12889-021-11677-w
- [27] H. D. S. Budiono, G. Heryana, M. Adhitya, D. A. Sumarsono, Nazaruddin, R. Siregar, E. Rijanto, and B. D. Aprianto, “Power requirement and cost analysis of electric bus using simulation method with RCAVe-EV1 software and GPS data; A case study of Greater Jakarta,” Int. J. of Technology, Vol.13, No.4, 2022. https://doi.org/10.14716/ijtech.v13i4.5688
- [28] DLR, “Model striping.” https://sumo.dlr.de/docs/Simulation/Pedestrians.html#model_striping [Accessed January 9, 2026]
- [29] JARTIC, “Cross-sectional traffic volume information for general roads (November 2025).” https://www.jartic.or.jp/service/opendata/ [Accessed January 9, 2026]
- [30] DLR, “Induction Loops Detectors (E1).” https://sumo.dlr.de/docs/Simulation/Output/Induction_Loops_Detectors_%28E1%29.html [Accessed January 9, 2026]
- [31] DLR, “Detector.” https://sumo.dlr.de/docs/Tools/Detector.html [Accessed January 9, 2026]
- [32] H. W. Jürgens, I. Matzdorff, and J. Windberg, “Internationale anthropometrische Daten als Voraussetzung für die Gestaltung von Arbeitsplätzen und Maschinen,” Wirtschaftsverlag NW Verlag für neue Wissenschaft GmbH, 1998. https://www.baua.de/DE/Angebote/Publikationen/AWE/AWE108 [Accessed May 12, 2026]
- [33] DLR, “Vehicle Type Parameter Defaults.” https://sumo.dlr.de/docs/Vehicle_Type_Parameter_Defaults.html [Accessed May 12, 2026]
- [34] J. Erdmann and D. Krajzewicz, “Modelling pedestrian dynamics in SUMO,” SUMO 2015 – Intermodal Simulation for Intermodal Transport, 2015.
- [35] Kagoshima City, “Kagoshima City Traffic Congestion Countermeasure Basic Plan (Revised Draft): Summary.” https://www.city.kagoshima.lg.jp/kensetu/douro/gairoseibi/documents/shiryou2.pdf [Accessed May 15, 2026]
- [36] A. Keler and J. M. Krisp, “Quantifying the complexity of road intersections using open data of traffic accidents–insights from a case study in Munich,” Abstracts of the Int. Cartographic Association, Vol.3, 2021. https://doi.org/10.5194/ica-abs-3-143-2021
- [37] B. Kaltenhäuser, A. Keler, Y. Ma, and J.-D. Schmöcker, “Safer truck routing considering collision severity and route preferences,” 9th Int. Conf. on Models and Technologies for Intelligent Transportation Systems (MT-ITS’2025), 2025. https://doi.org/10.1109/MT-ITS68460.2025.11223555
- [38] Kagoshima City, “City bus GTFS-JP data (revised July 20, 2025).” https://data.bodik.jp/dataset/462012_bus-kagoshimacity-kagoshima-jp [Accessed January 9, 2026]
- [39] DLR, “PT from OpenStreetMap.” https://sumo.dlr.de/docs/Tutorials/PT_from_OpenStreetMap.html [Accessed January 9, 2026]
- [40] A. Keler, L. A. Bug, and J. M. Krisp, “Network-based visualisation of accessibility for a public transport system,” Advances in Cartography and GIScience of the ICA, Vol.1, Article No.7, 2019. https://doi.org/10.5194/ica-adv-1-7-2019
- [41] DLR, “Persons.” https://sumo.dlr.de/docs/Specification/Persons.html [Accessed January 9, 2026]
- [42] DLR, “Using actuated traffic lights.” https://sumo.dlr.de/docs/Simulation/Traffic_Lights.html#using_actuated_traffic_lights [Accessed January 9, 2026]
- [43] DLR, “tlsCycleAdaptation.py.” https://sumo.dlr.de/docs/Tools/tls.html#tlscycleadaptationpy [Accessed January 9, 2026]
- [44] F. Webster, “Traffic signal settings,” Road Research Technical Paper, 1958.
- [45] DLR, “tlsCoordinator.py.” https://sumo.dlr.de/docs/Tools/tls.html#tlscoordinatorpy [Accessed January 9, 2026]
- [46] A. Keler, Y. Song, A. Qureshi, S. Nakao, and J.-D. Schmöcker, “Simulating the impact of adaptive traffic signals on bus energy consumption—A Keihan 300 Kyoto case study,” Proc. of Infrastructure Planning, Vol.71, 2025.
This article is published under a Creative Commons Attribution-NoDerivatives 4.0 Internationa License.