
Paper:
Developing and Evaluating a Flood Disaster Risk Reduction Education Program Using the Web-GIS Teaching Material “YOU@RISK for Children–Flood”
Toshimitsu Nagata*,**,***,†
 , Tai-Young Yi**, and Reo Kimura**,***
*Niigata Local Meteorological Office, Japan Meteorological Agency
1-2-1 Misaki-cho, Chuo-ku, Niigata, Niigata 950-0954, Japan
**Disaster Resilience Research Division, National Research Institute for Earth Science and Disaster Resilience (NIED)
Tsukuba, Japan
***Faculty and Graduate School of Human Science and Environment, University of Hyogo
Himeji, Japan
†Corresponding author

This study developed a flood disaster risk reduction (DRR) education program using the Web-GIS teaching material “YOU@RISK for Children—Flood,” developed by the National Research Institute for Earth Science and Disaster Resilience, and evaluated its educational effectiveness by implementing it at junior high schools in Niigata Prefecture. This program adopts the three-step structure for flood learning presented in the Practical Guide for Disaster Education (Junior and Senior High School Edition) compiled by the Ministry of Education, Culture, Sports, Science and Technology, and was designed, based on the ADDIE model, which is a framework for instructional design, as a learning program that emphasizes understanding flood risk and making evacuation decisions using map information in an ICT learning environment. The first implementation targeted junior high school students in Murakami City, Niigata Prefecture, an area where flood damage occurred owing to the heavy rainfall in August 2022. Of the 16 items measuring the achievement of learning objectives through self-evaluation, 14 demonstrated significant improvements, while no significant changes were observed in two items related to understanding flood damage and identifying safe evacuation sites. Therefore, the program was improved by revising the visual materials, explanations, and hands-on operation activities, and implemented with junior high school students in Mitsuke City, Niigata Prefecture, an area with a history of flood damage from the July 13, 2004 flood disaster. The results demonstrated significant improvements in all items, including those that depicted limited improvement in the first implementation. In the follow-up surveys at the two schools, the scores of most items remained generally higher than the pre-learning levels, although they declined from the levels immediately after learning. Thus, the findings suggest the effectiveness of this program for flood DRR education targeting junior high school students, particularly in supporting learning from acquiring basic knowledge about floods to evacuation decision-making using map information.
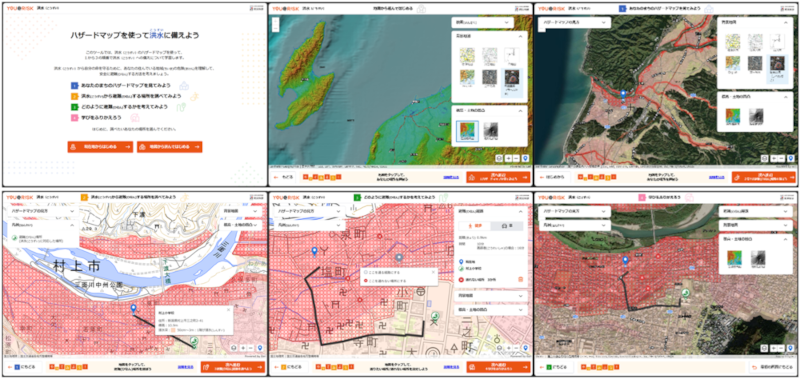
Example screens of “YOU@RISK for Children–Flood”
1. Introduction
In recent years, flooding and inundation damage caused by heavy rainfall and typhoons have occurred repeatedly in many regions in Japan, making it an important issue to respond to increasingly severe and frequent water-related disasters associated with climate change. Additionally, the 2025 White Paper on Disaster Management states the requirement to strengthen responses to natural disaster risks, including flooding, and improving disaster risk reduction (DRR) literacy related to flood disasters has become an urgent issue for local communities as a whole 1. In particular, in flood disasters, understanding disaster prevention weather information and evacuation information issued by local governments, as well as acquiring the ability to independently determine evacuation sites, routes, and actions based on local inundation risks and acting proactively is necessary.
Regarding school safety and DRR, “The Third Plan for the Promotion of School Safety,” issued by the Ministry of Education, Culture, Sports, Science and Technology, states the importance of strengthening practical DRR education and training based on local disaster risks and fostering students’ qualities and abilities to make appropriate judgments and act proactively according to the situation 2. Furthermore, the Practical Guide for Disaster Education (Junior and Senior High School Edition) was drawn up to make DRR education in junior and senior high schools more practical, and presents concrete examples of disaster learning, including floods 3. In addition, one-device-per-student learning environments have increasingly been introduced in recent years under the Education Digital Transformation (DX) Roadmap, expanding the possibilities for lessons using digital maps and Web-GIS 4. Therefore, in flood DRR education, there is a demand to develop concrete learning activities in which students not only acquire and understand knowledge, but also understand local flood risks in relation to map information and associate this understanding with evacuation judgment and action.
This study evaluated the educational effectiveness of a flood DRR education program based on the Web-GIS teaching material “YOU@RISK for Children—Flood,” developed by the National Research Institute for Earth Science and Disaster Resilience (NIED), by implementing it at junior high schools in Niigata Prefecture.
2. Previous Studies on Flood DRR Education and Issues
2.1. Flood DRR Education
In Japan, flood DRR education has been implemented at schools using instructional, supplementary reading, and regional materials prepared by boards of education and local governments. These instructional materials and documents are centered on learning basic knowledge regarding the causes of floods, their damage and effects, preparedness, and evacuation information.
In particular, areas that have experienced flood damage have developed instructional materials and learning practices based on lessons learned from disasters. For example, in Okayama Prefecture, which was affected by the July 2018 heavy rainfall disaster, issues and improvement measures were identified to improve school disaster resilience, enhance teachers’ response capacity, and strengthen DRR education 5. In Kumamoto Prefecture, which experienced the July 2020 heavy rainfall disaster, instructional content and points to consider were presented for systematically implementing DRR education and evacuation drills to foster students’ ability to protect their own lives from disasters 6. In Miyagi Prefecture, based on flood damage caused by Typhoon Hagibis of 2019 and other disasters, DRR education has been promoted to foster students’ ability to think, judge, and act proactively based on local disaster characteristics 7. In Niigata Prefecture, learning is positioned to emphasize not only understanding the mechanisms of floods and the damage they cause, but also assessing and conducting DRR actions independently 8.
2.2. Studies on Understanding Floods and Evacuation Judgment Using Map Information
In flood DRR education, in addition to acquiring basic knowledge about floods, learning that enables students to grasp local risks using map information and associate this understanding with evacuation judgment is important. In such learning, in addition to paper hazard maps, the use of map information that allows users to check flood risks on the Web has become widespread. For instance, the “Overlapping Hazard Maps,” operated by the Ministry of Land, Infrastructure, Transport and Tourism, is a web service that allows users to superimpose hazard information on floods, landslides, tsunamis, and other hazards on a map 9. My Timeline is positioned as an initiative for considering preparedness in advance by organizing evacuation actions during water-related disasters chronologically 10. These resources are important as they provide a basis for grasping local flood risks and considering evacuation actions based on that information.
Moreover, learning to understand disasters based on local topography and inundation characteristics is important. Iida and Kubota 11 revealed that understanding topography is important in learning about inundation prediction, and that the use of 3DCG and physical models improves the accuracy of inundation prediction compared with the sole usage of two-dimensional topographic maps. Further, as a future issue, they highlight the requirement for learning that combines topographical understanding and flood hazard maps.
Furthermore, presenting a hazard map is insufficient in itself; additionally, students must acquire the map literacy required to interpret the map and associate it with judgment. Murakoshi 12 showed that understanding hazard maps involves not only interpreting symbols and legends, but also inferring information not directly depicted on the map and assessing the limitations or reliability of information. In addition, Maebayashi and Urakawa 13 revealed that hazard map representations may lead to misinterpretation and suggested the requirement for educational design that supports interpretation and judgment rather than merely presenting information.
Thus, these previous studies highlight the importance of topographical understanding, hazard map interpretation, and map literacy in flood DRR education. However, they primarily focus on individual factors or cognitive issues, and do not sufficiently examine how to integrate those factors to design lessons in which students learn to grasp local flood risks and identify evacuation sites and evacuation routes. Therefore, even in flood DRR education using Web-GIS teaching materials, designing learning that connects topographical understanding and hazard map understanding with the identification of local risks and evacuation judgment is necessary.
2.3. Studies on DRR Education Using Web-GIS
As a study on the use of Web-GIS in school education, Oda et al. 14 developed a DRR education training program using Web-GIS for teachers, using flood and landslide disasters as case examples, intended for the high school subject Geography Comprehensive. They highlighted the requirement to strengthen DRR education, issues related to teachers’ DRR knowledge, and their ability to design lessons, and demonstrated the requirement to develop teaching materials and lesson plans and provide teacher support to enable the use of Web-GIS in school settings. This reveals that, in flood DRR education as well, introducing Web-GIS as a technological tool and designing educational programs that can be implemented as lessons by teachers is essential.
Among educational studies using existing Web hazard maps or GIS, previous studies have revealed that Web-based hazard maps can facilitate the grasp of hazardous areas and spatial understanding 15. Moreover, studies on GIS use in school DRR have revealed that GIS is effective in visualizing hazards, sharing local risks, and supporting safety management 16. In addition, an international study on flood education programs reflecting regional characteristics demonstrated that the effectiveness of DRR learning is enhanced when flood information specific to local areas is incorporated 17. These studies indicate that digital maps and Web-GIS can serve not only as means of presenting information, but also as a learning foundation for supporting students’ understanding of local risks and decision-making in DRR education.
In the area of flood DRR education, a previous study empirically verified an earlier version of the Web-GIS teaching material “YOU@RISK Your Flood Evacuation,” developed by the National Research Institute for Earth Science and Disaster Resilience (NIED), with elementary school students 18. This study highlighted that the learning content required for students to consider evacuation actions and destinations based on weather information, evacuation information, and hazard maps was not adequately presented in school DRR materials, and that many teaching materials developed by DRR specialists were difficult for teachers to use without the assistance of specialists. Further, it highlighted the requirement to help students form concrete images of disasters and strengthen learning for information-based decision-making through practice and evaluation.
Based on these previous studies, flood DRR education requires learning in which students not only acquire basic knowledge about floods, but also understand the relationship between local topography and flood risk and use map information to decide evacuation sites and routes. Moreover, the earlier version of the Web-GIS teaching material “YOU@RISK Your Flood Evacuation” (Fig. 1) had issues such as limited target areas, operational burden at the time of introduction, burden on teachers using the material, requirement for further consideration of elementary and junior high school students, and requirement to strengthen learning that helps students form concrete images of disasters and make decisions based on information.
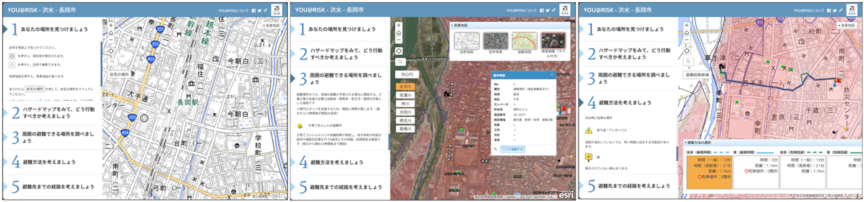
Fig. 1. Example screens of the Web-GIS teaching material “YOU@RISK Your Flood Evacuation” (Japanese display).
Thus, a key issue in flood DRR education is how to develop a program that can be implemented in school settings and that integrates the understanding of basic knowledge with evacuation decision-making based on map information, including organizing and reflecting on decision results.
2.4. Objective of This Study
The study aims to develop a flood DRR education program to assist junior high school students in acquiring basic knowledge about floods, understanding the relationship between local topography and flood risk, and developing the ability to use map information to decide evacuation sites and routes, and evaluate the educational effectiveness of this program through school-based practice conducted by teachers. Specifically, we used the Web-GIS teaching material “YOU@RISK for Children—Flood,” developed by NIED, to structure a program that can be implemented in school settings and to evaluate its learning effects.
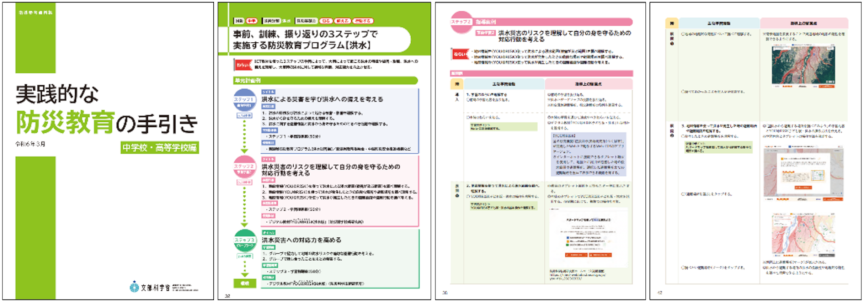
Fig. 2. Excerpt from the page presenting the flood DRR education program in MEXT’s Practical Guide for Disaster Education (Junior and Senior High School Edition).
3. Development of a Flood DRR Education Program
3.1. Program Background
The flood DRR education program examined in this study is based on a DRR education program for flood disasters (hereinafter, the Guide program), which the authors helped develop and which is presented as a practical example in the Practical Guide for Disaster Education (Junior and Senior High School Edition) compiled by the Ministry of Education, Culture, Sports, Science and Technology (MEXT). The page presenting the program is presented in Fig. 2.
The Guide program comprises three steps: Step 1 concerns learning basic knowledge, including the characteristics of floods, damage and effects, preparedness, and evacuation information; and Steps 2 and 3 use the Web-GIS teaching material “YOU@RISK for Children—Flood” to examine local flood risks, evacuation sites, evacuation routes, and evacuation actions.
Although we retained the three-step structure of the Guide program, the Web-GIS teaching material “YOU@RISK for Children—Flood” used in this study was functionally improved based on requests from schools. Specifically, this involved the addition of the screen “4 Let’s review what we learned,” in which students review the results of their decisions, to the previous three-stage operational process. Accordingly, the learning content and lesson plans of Steps 2 and 3 were modified in this study to reflect the learning process from decision-making to review.
Therefore, the program discussed in this study is based on the Guide program but has been reconfigured, with revised learning content and instructional methods, so that teachers can implement it in class using the functionally enhanced “YOU@RISK for Children—Flood.”
3.2. Theoretical Framework of Program Development
This study employed the ADDIE model, based on Instructional Design (ID) theory, to develop the flood DRR education program. ID theory is a theory and methodology for systematically designing and improving instructional materials, lessons, and learning environments to enhance the effectiveness, efficiency, and appeal of educational activities 19,20. The ADDIE model is a framework for systematically developing learning programs using the five stages of analysis, design, development, implementation, and evaluation 20. It has been used in studies on DRR education program development 21,22. Recently, in Japan, it has been applied not only in the field of DRR, but also for developing various educational programs 23,24,25,26.
In flood DRR education, in addition to acquiring an understanding of basic knowledge about floods, learning must involve understanding based on connecting local topography with flood risks and using map information to make judgments about evacuation sites and routes. Furthermore, to develop a program that is continuously implementable in school settings, the educational framework must be designed to include the operability of the teaching material, suitability for learners, and lesson planning. Therefore, this study employed the ADDIE model to organize these elements as a series of processes: analyzing learning content, designing learning objectives and instructional processes, developing teaching materials and lesson plans, implementing the program in schools, and evaluating and improving the program based on the implementation results.
The “Analyze” phase involved confirming the Guide program and requests from schools; the “Design” phase involved organizing the three steps and identifying the learning objectives; the “Develop” phase involved developing the teaching material and lesson plans corresponding to “YOU@RISK for Children—Flood”; the “Implement” phase involved implementation at two junior high schools; and the “Evaluate” phase involved analyzing the pre-, post-, and follow-up responses to the flood questionnaire and reflecting the results in the improved program. Thus, based on the ADDIE model, we reconfigured the Guide program, introduced improvements based on the implementation results, and re-evaluated the learning effects of the improved program.
3.3. Organizing the Analysis Stage for Program Development
At the analysis stage of the ADDIE model, we checked the content and structure of the Guide program, and identified the conditions required to apply it to school settings. In the Guide program, Step 1 concerns learning basic knowledge, including the characteristics of floods, damage and effects, preparedness, and evacuation information, and Steps 2 and 3 use the version of “YOU@RISK for Children—Flood” available at the time the Guide was published to consider evacuation sites, evacuation routes, and evacuation actions based on local flood risks 3.
Rather than redesigning the learning content of the Guide program from the beginning, we retained the three-step structure and supplemented the explanatory content of the lesson plans based on expert knowledge regarding flood disasters and weather information while checking the content with teachers. Further, the learning sequence was modified to correspond with the functionally enhanced “YOU@RISK for Children—Flood.” Thus, at the analysis stage, we identified the structure of the existing program, implementation conditions in school settings, modifications to the teaching material’s functions, and learning content that should be stressed in lessons, so that the process would connect to the following stages of design and development.
Specifically, we identified the content regarding the objectives, preparations, flow of learning, and points to consider in instruction, assuming a 50-minute lesson for each step. In particular, we identified points in Steps 2 and 3 that needed to be modified to correspond to the addition of the screen “4 Let’s review what we learned,” where students review the judgment results, in the revised “YOU@RISK for Children—Flood.”
3.4. Program Structure and Learning Sequence
In the flood DRR education program implemented in this study, each step was structured as a 50-minute lesson based on the three-step structure of the Guide program. The step structure, learning objectives, and corresponding questionnaire items of the program are presented in Table 1. The specific wording of the flood questionnaire items is provided in Appendix A. Overall, Step 1 involved learning basic knowledge about flood disasters and preparedness, Step 2 involved using the Web-GIS teaching material “YOU@RISK for Children—Flood” to grasp local flood risks and consider response actions during floods, and Step 3 involved enhancing students’ ability to respond to flood disasters through group discussions and presentations.
| Step (study time) | Learning objectives | Corresponding questionnaire items (Q numbers) |
|
Step 1 (50 minutes \(\times\) 1) |
1. Understand the characteristics of floods and their damage and impacts. | Q1, Q2 |
| 2. Understand preparedness measures to protect oneself from floods. | Q3 | |
| 3. Understand evacuation information and the actions that should be taken. | Q4, Q5, Q6 | |
|
Step 2 (50 minutes \(\times\) 1) |
1. Examine and understand the inundation area using maps. | Q7 |
| 2. Examine and understand hazardous places and evacuation sites. | Q8, Q9 | |
| 3. Consider evacuation routes and evacuation actions. | Q10, Q11 | |
|
Step 3 (50 minutes \(\times\) 1) |
1. Consider local flood risk and evacuation actions. | Q12, Q13, Q14 |
| 2. Summarize and present the results of the discussion. | Q15, Q16 |
Step 1, “Learning about flood disasters and thinking about preparedness against floods,” covered the characteristics of floods, their damage and effects, mechanisms of floods, flood countermeasures, and evacuation information. Emphasis was placed on developing foundational knowledge that provides a basis for interpreting information from hazard maps and Web-GIS and making evacuation decisions in the subsequent learning steps.
Step 2, “Thinking about response actions to protect oneself from floods,” was designed so that students used tablet devices to operate “YOU@RISK for Children—Flood” and individually identified inundation areas, dangerous locations, evacuation sites, and evacuation routes while checking flood risks around their own location or school. Example screens of the Web-GIS teaching material used in this study are presented in Fig. 3. In addition, according to the revised YOU@RISK, students used the screen “4 Let’s review what we learned” at the end of the lesson to organize the grounds for their decisions and reflect on them, thereby verbalizing their own judgments.
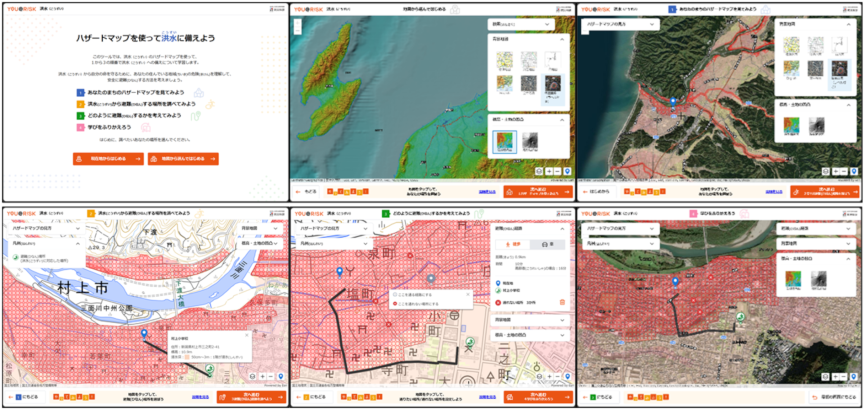
Fig. 3. Example screens of the Web-GIS teaching material “YOU@RISK for Children–Flood” (Japanese display).
Step 3, “Enhancing the ability to respond to flood disasters,” was designed so that students investigated flood risks at specified locations or surrounding areas in groups, based on the individual decisions made in Step 2, and compared and discussed the reasons for selecting evacuation sites and routes. Furthermore, by summarizing and presenting the results of group discussions and reflecting on their own decisions considering others’ views, this step aimed to enhance students’ ability to make decisions based on local risks.
As presented above, this program comprises a three-step learning process, involving understanding basic knowledge about floods, using Web-GIS to grasp local risks and make decisions about evacuation sites and routes, and sharing and reflecting on the decision outcomes, according to the learning objectives of the three steps.
| Implementation schedule | ||
| Implementation item | Murakami Higashi Junior High School | Mitsuke Junior High School |
| Pre-program questionnaire (Flood Questionnaire 1) | July 14, 2025 | November 28, 2025 |
| Step 1 | October 1, 2025 | December 4, 2025 |
| Step 2 | October 8, 2025 | December 18, 2025 |
| Step 3 | October 8, 2025 | December 18, 2025 |
| Post-program questionnaire (Flood Questionnaire 2) | October 9, 2025 | December 19, 2025 |
| Follow-up questionnaire (Flood Questionnaire 3) | February 20, 2026 | March 10, 2026 |
3.5. Outline of Target Schools and Implementation
To conduct a practical verification of the flood DRR education program at junior high schools in areas where flood disasters had occurred in the past, the program was conducted at two schools: Murakami Higashi Junior High School and Mitsuke Junior High School in Niigata Prefecture. The implementation schedules are presented in Table 2. The lessons in this program were implemented by the teachers at each school. Before implementation, the research team shared the lesson plans, teaching materials, lesson procedures, and instructions for using “YOU@RISK for Children—Flood” with the teachers at each school. During implementation, the research team checked the progress of the lessons based on the lesson plans.
Practical Verification 1 involved 58 third-year students in two classes at Murakami Higashi Junior High School, a municipal junior high school in Murakami City, Niigata Prefecture. The school is located in an area where flood damage occurred owing to the heavy rainfall in August 2022, and the program involved students attending school in the area (Fig. 4).
Practical Verification 2 involved 81 first-year students in three classes at Mitsuke Junior High School, a municipal junior high school in Mitsuke City, Niigata Prefecture. Mitsuke Junior High School is located in an area with a history of flood damage from the July 13, 2004 flood disaster, and this implementation targeted first-year junior high school students who belonged to a generation that had not directly experienced that disaster (Fig. 5).
Although both schools are located in areas where flood disasters had occurred in the past, the targeted students belonged to different grades and differed in the time elapsed since the respective disasters. This study primarily aimed not to compare these differences, but to verify the learning effects of the improved program by re-implementing it at a second school after making program improvements based on the results of the initial implementation.
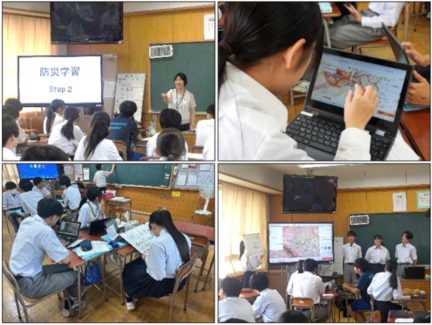
Fig. 4. Classroom implementation of the program at Murakami Higashi Junior High School.
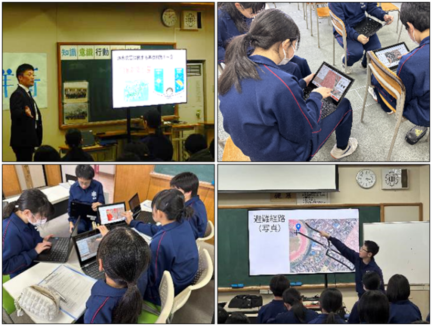
Fig. 5. Classroom implementation of the program at Mitsuke Junior High School.
3.6. Structure of the Flood Questionnaire
This study distributed a flood questionnaire to verify the learning effects of the program. The questionnaire comprises items necessary to grasp students’ “understanding of basic knowledge about floods” and “changes in learning achievement related to evacuation decision-making using map information,” which correspond to the objectives of this study. Thus, the questionnaire items were positioned as items that directly assess the learning objectives set for each step. The learning objectives of each step and corresponding questionnaire items are presented in Table 1.
The flood questionnaire comprised 16 items rated on a four-point scale. The responses were “I can do this well (4 points),” “I can do this somewhat (3 points),” “I cannot do this very well (2 points),” and “I can hardly do this (1 point).” The four-point scale was adopted without a neutral option to clearly identify the direction of learning achievement. The questionnaire was answered by each student using their tablet device.
The questionnaire items were structured to correspond to the learning content stressed in each step, allowing us to grasp the achievement levels related to basic knowledge about floods in Step 1, understanding flood risks and evacuation decision-making based on map information in Step 2, and collaborative discussions and presentations in Step 3.
This study assessed the learning achievement level through students’ self-evaluations of the questionnaire items corresponding to the learning objectives. This is based on the approach in ID theory that program evaluation is conducted based on learners’ performance 27.
We explained the objectives and methods of the study to the target schools, and conducted the survey after obtaining approval from the school principals for research cooperation and data handling. The students’ responses to the questionnaire were voluntary, and the results were treated so that individuals could not be identified. Further, it was explained in advance that the data would be used solely for research purposes.
3.7. Analysis Methods
To verify the learning effects of the flood DRR education program, we analyzed the responses to the flood questionnaire. For the pre-post comparison, we analyzed the responses of participants who responded at both time points, and for the three-time-point comparison including the follow-up survey, we analyzed the responses of participants who responded at all three time points.
First, to grasp the changes between before program implementation (first time point) and after program implementation (second time point), we examined the transformations in the mean scores for each of the questionnaire items from Q1 to Q16, and conducted paired-samples \(t\)-tests. Subsequently, to grasp the retention of the learning effects, we used the results of the three time points, comprising the first, second, and follow-up (third) time points, to conduct a repeated-measures ANOVA for each questionnaire item from Q1 to Q16, and analyzed changes over time. The significance level was set at 5% for the statistical tests. In the pre-post comparison, we applied Holm’s method to correct for multiple comparisons. For effect sizes, Cohen’s \(\mathit{dz}\) was calculated for the paired-samples \(t\)-tests, and partial \(\eta^2\) was calculated for the repeated-measures ANOVA.
Furthermore, based on the item-by-item analysis results obtained at the first school, we identified items for which improvement was limited and made revisions to the corresponding learning content and instructional methods. Subsequently, the improved program was implemented at the second school, and the learning effects were re-evaluated using the same questionnaire. In this manner, we verified the learning effects of the flood DRR education program over the three time points of pre-, post-, and follow-up surveys, while using the analysis results of the first implementation to improve the program.
4. Practical Verification of the Program
4.1. Practical Verification 1: Murakami Higashi Junior High School
This section presents the analysis results based on the flood questionnaire for the first implementation at Murakami Higashi Junior High School.
4.1.1. Verification of Learning Effects Based on the Flood Questionnaire
Based on the valid responses of students who responded at both the pre- and post-implementation time points (\({n=56}\)), we conducted paired-samples \(t\)-tests for each of the items from Q1 to Q16. As Fig. 6 presents, the post-implementation mean scores were higher for all items. Among the pre-implementation results, the mean scores of Q2 and Q8 were relatively high, while those of Q6, Q9, and Q10 were relatively low. Moreover, among the post-implementation results, the mean scores of Q11–Q13 and Q5 were high, while those of Q6 and Q4 were relatively low.
The results of the paired-samples \(t\)-tests demonstrated significant differences in all items except Q2 and Q8. Specifically, Q4 revealed a significant difference at the 5% level, while Q1, Q3, Q5–Q7, and Q9–Q16 revealed significant differences at the 1% level. However, no significant differences were observed for Q2 and Q8. For the items with significant differences, the effect sizes ranged from \(\mathit{dz}=0.52\) to 1.25, indicating medium to large effects.
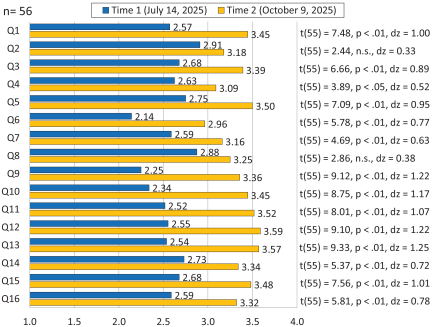
Fig. 6. Pre- and post-program comparison of flood questionnaire scores at Murakami Higashi Junior High School.
Regarding magnitudes of change, items related to the interpretation of map information and decision-making about evacuation, as represented by Q9–Q13, displayed relatively large increases, indicating clear improvements immediately following learning. Moreover, Q2 and Q8 demonstrated some increases in mean scores, but these increases were smaller than those of the other items and were not statistically significant. In particular, Q2 had a relatively high mean score at Time 1 (2.91), suggesting that students may already have had some prior knowledge of the damage and impacts caused by floods before the lesson. In addition, the relatively high baseline score may have limited the magnitude of score improvement, and these factors may partly explain why no significant difference was observed for Q2.
The results of the first implementation indicate that the students’ self-evaluations corresponding to the learning objectives improved in items related to understanding flood mechanisms, evacuation information, and hazard maps, grasping flood risks using map information, considering evacuation sites and routes, and engaging in collaborative discussions and presentations. Thus, regarding statistical significance and effect sizes, the program suggested certain learning effects across the learning process, from acquiring basic knowledge about floods and grasping local risks using Web-GIS to sharing decisions through discussions and presentations. The lack of significant differences in Q2 and Q8 indicates that the improvement immediately following learning was limited with regard to understanding the damage and effects of floods and safe evacuation sites compared with other items.
4.1.2. Issues Identified in the First Implementation and Program Improvements
The analysis results of the first implementation suggested a certain level of learning effect of the program. However, no significant differences were observed in Q2 and Q8, indicating that the improvement immediately following learning was limited with regard to understanding the damage and effects of floods and safe evacuation sites. Furthermore, there were items that displayed significant differences but for which there appeared to be room for improvement considering the students’ observed learning activities and transformation in the mean scores.
Specifically, the results for Q2, Q7, and Q8 suggested that students encountered difficulties in forming a concrete image of local flood damage or flood risks in connection with their own daily living areas. To address this, we introduced photographs depicting the local area in the improved program, to assist students in forming concrete images. Q6 suggested that students may not have sufficiently understood the difference between “designated emergency evacuation sites” and “designated evacuation shelters,” and thus, the descriptions were altered to provide a more detailed explanation of the difference. Q9 suggested that the time allotted to operating Web-GIS was limited, which could have affected students’ understanding of topographical altitude differences and geographical characteristics; thus, adjustments were made to ensure that students had sufficient time to consider map information. Regarding Q14, students tended to assume evacuation action in a somewhat simplistic manner, and thus were unable to fully articulate the reasons for their chosen evacuation action. Therefore, the learning sequence was modified so that students selected locations after examining the risks associated with their group members’ areas, thereby helping them articulate more specific reasons for their decisions.
In the above manner, we modified the lesson plans by introducing concrete images of the local area, providing more detailed explanations to support conceptual understanding, ensuring sufficient time for operating Web-GIS, and assisting students in articulating the grounds for their judgments. Thus, we intended to increase the achievement level of the learning objectives by addressing the issues identified in the first implementation.
4.2. Practical Verification 2: Mitsuke Junior High School
This section presents the analysis results based on the flood questionnaire for the second implementation at Mitsuke Junior High School.
4.2.1. Verification of Learning Effects Based on the Flood Questionnaire
Based on the valid responses of students who responded at both the pre- and post-implementation time points (\({n=78}\)), we conducted paired-samples \(t\)-tests for each of the items from Q1 to Q16. As Fig. 7 reveals, the post-implementation mean scores were higher for all items. Among the pre-implementation results, the mean scores of Q15, Q8, and Q2 were relatively high, while those of Q9, Q10, Q6, and Q7 were relatively low. Among the post-implementation results, the mean scores of Q2, Q14, Q8, and Q12 were high, while those of Q9 and Q16 were relatively low.
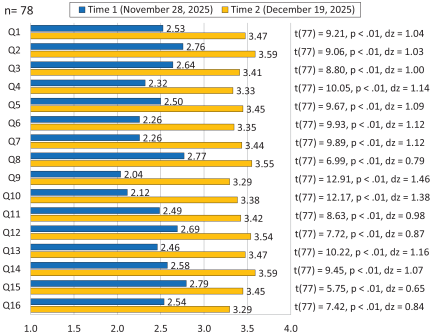
Fig. 7. Pre- and post-program comparison of flood questionnaire scores at Mitsuke Junior High School.
The results of the paired-samples \(t\)-tests revealed significant differences at the 1% level in all items. The effect sizes for the items ranged from \(\mathit{dz}=0.65\) to 1.46, indicating medium to large effects. Therefore, in the improved program, improvements in students’ self-evaluations were confirmed for all items corresponding to the learning objectives regarding statistical significance and effect sizes.
Regarding magnitudes of change, items related to the interpretation of map information and decision-making about evacuation, as represented by Q9 and Q10, displayed large increases, indicating clear improvements immediately following learning. Moreover, the increases in Q2 and Q15, although relatively small, depicted statistically significant differences. In particular, the finding that significant differences were observed for all items, including Q2 and Q8, for which no significant differences were observed in the first implementation, indicated that improvements in learning achievement as assessed through self-evaluation were confirmed across a broad range of items in the improved program.
4.2.2. Learning Effects of the Improved Program
From the above results, it appears that the improved program produced learning effects by addressing the issues identified in the first implementation and integrally enhancing learning from the acquisition of basic knowledge about floods to grasping local risks, judging evacuation sites and routes using map information, and engaging in collaborative discussions and presentations. In particular, the finding that significant differences were observed at Mitsuke Junior High School even in items that demonstrated insufficient improvement in the first implementation suggests the effectiveness of revising the instructional content based on statistical analysis.
Notably, the initial program and improved program were not strictly compared under identical conditions. The implementation schools differed in target grade level, regional context, temporal distance from past flood disasters, and implementation timing, and these differences may have influenced the scores at Time 1 and subsequent transformations in students’ self-reported achievement. Therefore, improvements observed at the reimplementation school cannot be attributed solely to improvements in the program. In addition, because the evaluation in this study was based on students’ self-evaluations, the results should be interpreted as changes in learning achievement as assessed through self-evaluation; they do not directly measure the acquisition of actual evacuation decision-making or behavioral abilities in flood situations.
However, the finding that the content revised based on the analysis results of the first implementation produced significant improvements in the second implementation conducted at a different school supports the practical validity of the improved program. In the reimplementation school, the improved program included an activity in which students were presented photographs of urban areas inundated during the July 13, 2004 flood disaster and asked to identify where those locations are in the present-day city. During group learning, some students referred to specific locations while discussing the risk of inundation. This suggests that presenting local photographs may have helped students develop a concrete understanding of local flood risk.
Thus, the improved program appears to have produced certain learning effects as a flood DRR education program targeting junior high school students that was based on the Guide program and improved to correspond to the functionally enhanced “YOU@RISK for Children—Flood.”
4.3. Retention of Learning Effects Over Time
In addition to the effect immediately following learning, this study investigated the retention of learning effects over time. Therefore, the scores of the flood questionnaire at three different time points, that is, pre-implementation (first time point), post-implementation (second time point), and follow-up (third time point), were compared, and a repeated-measures ANOVA was conducted for each item.
At Murakami Higashi Junior High School (\({n=56}\)), significant changes over time were observed in 15 items except Q2. Specifically, Q8 revealed a significant transformation over time at the 5% level, while Q1, Q3–Q7, and Q9–Q16 revealed significant transformations over time at the 1% level (Table 3). The partial \(\eta^2\) values for the items with significant changes over time at Murakami Higashi Junior High School ranged from .08 to .46, indicating medium or larger effects for many items, although the effect sizes varied across items. Regarding the mean scores, those at the second time point were the highest in many items, while those at the third time point were higher than at the first time point, although somewhat lower than at the second time point. In particular, items related to the interpretation of map information and evacuation decision-making, as represented by Q9–Q13, displayed relatively large increases immediately following learning, and exceeded the levels at the first time point in the follow-up survey.
| Murakami Higashi Junior High School (\(\boldsymbol{n=56}\)) | ||||
| Score | ||||
| Question items | Time 1 (July 2025) | Time 2 (October 2025) | Time 3 (February 2026) | Repeated-measures ANOVA |
| Q1 | 2.57 | 3.45 | 2.89 | \(F(2,110)=28.69\), \(p<.01\), \(\eta_{p}^{2}=.34\) |
| Q2 | 2.91 | 3.18 | 3.07 | \(F(2,110)=2.85\), n.s., \(\eta_{p}^{2}=.05\) |
| Q3 | 2.68 | 3.39 | 3.04 | \(F(2,110)=21.21\), \(p<.01\), \(\eta_{p}^{2}=.28\) |
| Q4 | 2.63 | 3.09 | 2.75 | \(F(2,110)=7.81\), \(p<.01\), \(\eta_{p}^{2}=.12\) |
| Q5 | 2.75 | 3.50 | 3.07 | \(F(2,110)=22.47\), \(p<.01\), \(\eta_{p}^{2}=.29\) |
| Q6 | 2.14 | 2.96 | 2.63 | \(F(2,110)=18.66\), \(p<.01\), \(\eta_{p}^{2}=.25\) |
| Q7 | 2.59 | 3.16 | 2.91 | \(F(2,110)=9.45\), \(p<.01\), \(\eta_{p}^{2}=.15\) |
| Q8 | 2.88 | 3.25 | 2.96 | \(F(2,110)=4.82\), \(p<.05\), \(\eta_{p}^{2}=.08\) |
| Q9 | 2.25 | 3.36 | 2.68 | \(F(2,110)=44.55\), \(p<.01\), \(\eta_{p}^{2}=.45\) |
| Q10 | 2.34 | 3.45 | 2.82 | \(F(2,110)=37.85\), \(p<.01\), \(\eta_{p}^{2}=.41\) |
| Q11 | 2.52 | 3.52 | 2.96 | \(F(2,110)=32.73\), \(p<.01\), \(\eta_{p}^{2}=.37\) |
| Q12 | 2.55 | 3.59 | 2.98 | \(F(2,110)=46.78\), \(p<.01\), \(\eta_{p}^{2}=.46\) |
| Q13 | 2.54 | 3.57 | 2.93 | \(F(2,110)=42.76\), \(p<.01\), \(\eta_{p}^{2}=.44\) |
| Q14 | 2.73 | 3.34 | 2.98 | \(F(2,110)=14.74\), \(p<.01\), \(\eta_{p}^{2}=.21\) |
| Q15 | 2.68 | 3.48 | 3.09 | \(F(2,110)=27.19\), \(p<.01\), \(\eta_{p}^{2}=.33\) |
| Q16 | 2.59 | 3.32 | 3.02 | \(F(2,110)=20.08\), \(p<.01\), \(\eta_{p}^{2}=.27\) |
At Mitsuke Junior High School (\({n=78}\)), significant changes over time at the 1% level were observed in all items, Q1–Q16 (Table 4). The partial \(\eta^2\) values for the items at Mitsuke Junior High School ranged from .20 to .53, indicating large effect sizes for all items. Furthermore, the scores at the second time point were the highest in all items, while those at the third time point were higher than at the first time point, although somewhat lower than at the second time point.
| Mitsuke Junior High School (\(\boldsymbol{n=78}\)) | ||||
| Score | ||||
| Question items | Time 1 (November 2025) | Time 2 (December 2025) | Time 3 (March 2026) | Repeated-measures ANOVA |
| Q1 | 2.53 | 3.47 | 3.06 | \(F(2,154)=47.42\), \(p<.01\), \(\eta_{p}^{2}=.38\) |
| Q2 | 2.76 | 3.59 | 3.31 | \(F(2,154)=42.61\), \(p<.01\), \(\eta_{p}^{2}=.36\) |
| Q3 | 2.64 | 3.41 | 3.18 | \(F(2,154)=36.68\), \(p<.01\), \(\eta_{p}^{2}=.32\) |
| Q4 | 2.32 | 3.33 | 2.81 | \(F(2,154)=53.16\), \(p<.01\), \(\eta_{p}^{2}=.41\) |
| Q5 | 2.50 | 3.45 | 3.01 | \(F(2,154)=47.67\), \(p<.01\), \(\eta_{p}^{2}=.38\) |
| Q6 | 2.26 | 3.35 | 3.12 | \(F(2,154)=62.66\), \(p<.01\), \(\eta_{p}^{2}=.45\) |
| Q7 | 2.26 | 3.44 | 3.24 | \(F(2,154)=69.18\), \(p<.01\), \(\eta_{p}^{2}=.47\) |
| Q8 | 2.77 | 3.55 | 3.32 | \(F(2,154)=28.19\), \(p<.01\), \(\eta_{p}^{2}=.27\) |
| Q9 | 2.04 | 3.29 | 2.94 | \(F(2,154)=86.74\), \(p<.01\), \(\eta_{p}^{2}=.53\) |
| Q10 | 2.12 | 3.38 | 2.99 | \(F(2,154)=85.94\), \(p<.01\), \(\eta_{p}^{2}=.53\) |
| Q11 | 2.49 | 3.42 | 3.18 | \(F(2,154)=46.26\), \(p<.01\), \(\eta_{p}^{2}=.38\) |
| Q12 | 2.69 | 3.54 | 3.17 | \(F(2,154)=33.10\), \(p<.01\), \(\eta_{p}^{2}=.30\) |
| Q13 | 2.46 | 3.47 | 3.04 | \(F(2,154)=56.30\), \(p<.01\), \(\eta_{p}^{2}=.42\) |
| Q14 | 2.58 | 3.59 | 3.21 | \(F(2,154)=53.02\), \(p<.01\), \(\eta_{p}^{2}=.41\) |
| Q15 | 2.79 | 3.45 | 3.10 | \(F(2,154)=19.68\), \(p<.01\), \(\eta_{p}^{2}=.20\) |
| Q16 | 2.54 | 3.29 | 2.92 | \(F(2,154)=27.27\), \(p<.01\), \(\eta_{p}^{2}=.26\) |
The above results demonstrate that, in both Murakami Higashi Junior High School and Mitsuke Junior High School, the scores increased immediately following learning, and although they declined to some extent in the follow-up, they mostly exceeded the levels prior to learning. The levels of decline differed among items, and in particular, items related to the use of map information and evacuation decision-making displayed relatively large increases immediately following learning.
5. Discussion
5.1. Educational Effectiveness of the Flood DRR Education Program
The above results suggest that the present program, which was based on the Guide program and whose learning content and lesson plans were improved to correspond to the functionally enhanced “YOU@RISK for Children—Flood,” demonstrated a certain degree of educational effectiveness as a flood DRR education program targeting junior high school students. A key feature of this program lies in providing a concrete form of the learning process, whereby, in addition to the acquisition of basic knowledge about floods, visualization of local flood risks using the Web-GIS teaching material is connected to decisions about evacuation sites and routes.
Flood DRR education in previous studies has often centered on acquiring basic knowledge and understanding evacuation preparedness, and has not sufficiently developed concrete learning processes in which an understanding of local topography and flood risks is linked to map information and connected to evacuation decision-making and actions. In contrast, in the present study, we structured a learning process in which basic knowledge is formed in Step 1, individual decisions are made based on map information in Step 2, and those decisions are discussed in groups and the results presented in Step 3.
Therefore, this study can be positioned as a practical demonstration of a lesson program for junior high school students that connects “knowing” to “making judgments” in flood DRR education by using the ADDIE model as a framework for developing and improving the educational program and by sequentially linking basic knowledge about floods to the recognition of local risks, selection of evacuation sites and routes, and collaborative discussion and explanation.
As the questionnaire used in this study employs a self-evaluation scale, the results represent improvements in the achievement levels related to students’ knowledge acquisition and evacuation decision-making. The evaluation was based on students’ self-evaluations of their achievement of the learning objectives set for the school-based lesson practice; it did not assess differences according to students’ attributes, personal disaster experience, family environment, or other background factors, nor did it evaluate the feasibility of evacuation decision-making or evacuation behavior considering individual circumstances during an actual evacuation.
From this standpoint, the improvement in achievement levels corresponding to the learning objectives brought about by this program provides certain evidence of its learning effects as a flood DRR education program.
5.2. Program Improvement and Re-Evaluation
In this study, we improved the program based on the results of the first implementation, then re-evaluated its learning effects in a second implementation. In the first implementation, issues were observed regarding understanding the damage and effects of floods and safe evacuation sites, forming concrete images of the local area, and verbalizing the reasons for evacuation decisions. To address these issues, the improved program incorporated modifications by employing photographs, providing more detailed explanations, adjusting the time for operating Web-GIS, and altering the method of site selection.
Consequently, significant differences were observed in the second verification in all items, including those that displayed limited improvements in the first implementation. This suggests the effectiveness of revising the learning content and instructional methods based on statistical analysis to improve the quality of flood DRR education programs.
However, this study did not conduct a strict comparison between the two schools, and the students’ grades and local conditions differed. Therefore, the results obtained at the second school cannot be solely attributed to the effect of program modifications. Nevertheless, the finding that the content revised based on the issues identified in the first implementation produced positive results in the second implementation provides evidence of the practical validity of the improved program.
5.3. Retention of Learning Effects and Future Challenges
Although the effects immediately following learning were confirmed, the scores of many items decreased in the follow-up survey. However, the average scores in the follow-up survey at both Murakami Higashi and Mitsuke Junior High Schools, for the most part, exceeded those before learning. This suggests that the program not only raised the achievement levels of comprehension and decision-making immediately following learning, but also maintained these effects to some extent at the time of the follow-up survey.
In particular, content such as the use of map information to identify flood risks and evacuation sites and routes improved significantly immediately following learning, but subsequently declined with the passage of time. These types of learning content are unlikely to be firmly retained after a single lesson, but are likely to become established by repeatedly viewing maps, interpreting them, and explaining one’s own judgments. Thus, in future flood DRR education, it will be necessary to provide learning opportunities on a continuous basis, in which, in addition to one-time lessons, periodic reviews or relearning sessions are conducted and linked to local hazard maps and evacuation drills.
The present study targeted two schools in Niigata Prefecture, where the targeted grades and local characteristics differed. Therefore, caution is required when generalizing the present findings to other areas or different grades. However, our approach, in which a program based on the Guide program was improved and its learning effects empirically verified with junior high school students in flood-affected areas, should present useful implications in developing flood DRR education programs in the future.
6. Conclusion
This study developed a flood DRR education program based on the Guide program, corresponding to the functionally enhanced Web-GIS teaching material “YOU@RISK for Children—Flood,” and evaluated its educational effectiveness by implementing it at two junior high schools in Niigata Prefecture.
The results suggested that the program produced certain learning effects by improving students’ achievement levels in understanding basic knowledge about floods, using map information to identify local risks and determine evacuation sites and routes, and engaging in collaborative discussions and presentations. Furthermore, after revising the learning content and instructional methods based on the analysis results of the first implementation, the learning effects of the improved program were confirmed when it was re-implemented by teachers in a school setting; this presents practical knowledge regarding flood DRR education programs through program improvement and re-evaluation and constitutes a major finding of this study.
However, in the follow-up survey, the effects immediately after learning declined over time in many items. However, the average follow-up scores mostly remained higher than the pre-learning levels. Thus, it will be necessary in flood DRR education to provide learning opportunities on a continuous basis, rather than confining learning to a single lesson, so that periodic reviews or relearning sessions are conducted and linked to local hazard maps and evacuation drills.
Thus, this study provides a concrete implementation of a flood DRR education program targeting junior high school students based on the Web-GIS teaching material “YOU@RISK for Children—Flood” and the Guide program, and demonstrates its educational effectiveness in a form that teachers can implement in school settings. Future work should investigate the applicability of the program to other areas and different grades, and expand the program to incorporate continuous learning.
The flood DRR education program presented in this study was compiled in a general-purpose file format so that teachers can use it in school settings, and is available for download from the “Disaster Risk Reduction Education Literacy HUB” website operated by NIED 28.
Acknowledgments
The authors would like to express their sincere gratitude to Murakami Higashi Junior High School and Mitsuke Junior High School for their generous cooperation in the practical verification of the flood DRR education program. Further, the authors thank the teachers and students who participated in the program implementation and questionnaire surveys.
- [1] Cabinet Office, Government of Japan, “White Paper on Disaster Management 2025,” 2025 (in Japanese).
- [2] Ministry of Education, Culture, Sports, Science and Technology (MEXT), “The third plan for the promotion of school safety,” 2022 (in Japanese).
- [3] MEXT, “Practical guide for disaster education (junior and senior high school edition),” 2024 (in Japanese).
- [4] MEXT, “Education DX roadmap,” 2025 (in Japanese).
- [5] Okayama Prefectural Board of Education, “Report on verification of response in the July 2018 heavy rain disaster,” 2018 (in Japanese).
- [6] Kumamoto Prefectural Board of Education, “Instructional manual for school disaster risk reduction education,” 2018 (in Japanese). https://www.pref.kumamoto.jp/site/kyouiku/9097.html [Accessed April 19, 2026]
- [7] Miyagi Prefectural Board of Education, “Miyagi disaster risk reduction education supplementary reader,” 2026 (in Japanese).
- [8] Niigata Prefectural Board of Education, “Niigata Prefecture disaster risk reduction education program: Flood disaster edition,” 2014 (in Japanese).
- [9] Ministry of Land, Infrastructure, Transport and Tourism (MLIT), “Overlapping hazard maps” (in Japanese). https://disaportal.gsi.go.jp/hazardmap/maps/index.html [Accessed April 19, 2026]
- [10] MLIT, “My timeline guide, ver.1.0,” 2020 (in Japanese).
- [11] K. Iida and Y. Kubota, “Usefulness of 3DCG and physical models in flood forecasting based on understanding topography,” Jpn. J. Educ. Technol., Vol.48, No.1, pp. 191-205, 2024 (in Japanese). https://doi.org/10.15077/jjet.47054
- [12] S. Murakoshi, “Map Literacy of Hazard Maps: An examination from cognitive psychological point of view,” Map (J. Jpn. Cartogr. Assoc.), Vol.63, No.2, pp. 11-26, 2025 (in Japanese). https://doi.org/10.11212/jjca.63.2_11
- [13] A. Maebayashi and G. Urakawa, “A study on the misinterpretation of hazard maps from the perspective of design,” J. Soc. Saf. Sci., No.47, pp. 13-22, 2025 (in Japanese). https://doi.org/10.11314/jisss.47.13
- [14] T. Oda, M. Ikeda, T. Nagata, R. Kimura, and S. Nagamatsu, “Development of an in-service teacher training program for disaster risk reduction in a new compulsory high school geography course in Japan” E-J. GEO, Vol.18, No.2, pp. 199-213, 2023 (in Japanese). https://doi.org/10.4157/ejgeo.18.199
- [15] J. Song, H. Yamauchi, T. Oguchi, and T. Ogura, “Application of web hazard maps to high school education for disaster risk reduction,” Int. J. Disaster Risk Reduct., Vol.72, Article No.102866, 2022. https://doi.org/10.1016/j.ijdrr.2022.102866
- [16] T. Oda, A. Sakurai, T. Sato, C.-H. Lee, and C.-F. Ding, “Enhancing disaster risk reduction at school through the integration of geographic information system: Insights from Taiwan’s school safety GIS platform,” J. Disaster Res., Vol.20, No.5, pp. 746-756, 2025. https://doi.org/10.20965/jdr.2025.p0746
- [17] M. Intaramuean, A. Nonomura, and T. Boonrod, “Empowering flood preparedness: Enhancing flood knowledge, risk perception, and preparedness among primary school learners in flood-affected Southern Thailand,” Prog. Disaster Sci., Vol.26, Article No.100410, 2025. https://doi.org/10.1016/j.pdisas.2025.100410
- [18] M. Ikeda et al., “Development of disaster management education program to enhance disaster response capabilities of schoolchildren during heavy rainfall – Implementation at elementary school in Nagaoka City, Niigata Prefecture, a disaster-stricken area,” J. Disaster Res., Vol.16, No.7, pp. 1121-1136, 2021. https://doi.org/10.20965/jdr.2021.p1121
- [19] K. Suzuki, “Instructional design: Techniques to improve effectiveness, efficiency, and engagement of learning,” IEICE Commun. Soc. Mag., Vol.13, No.2, pp. 110-116, 2019 (in Japanese). https://doi.org/10.1587/bplus.13.110
- [20] T. Inagaki and K. Suzuki, “Instructional design manual for teachers, Ver.2,” Kitaohji Shobo, 2015 (in Japanese).
- [21] T. Nagata, T.-Y. Yi, R. Kimura, and M. Ikeda, “Development of the volcanic disaster risk reduction education program using the ICT tool ‘YOU@RISK Volcanic Disaster Edition’—Practical verification at a junior high school in the Mt. Nasu Area—,” J. Disaster Res., Vol.19, No.5, pp. 793-807, 2024. https://doi.org/10.20965/jdr.2024.p0793
- [22] T. Nagata, M. Ikeda, R. Kimura, and T. Oda, “Development of tsunami disaster risk reduction education program for children with no experience of earthquake disaster – Practice and verification at Shichigahama Town, Miyagi Prefecture,” J. Disaster Res., Vol.17, No.6, pp. 1000-1014, 2022. https://doi.org/10.20965/jdr.2022.p1000
- [23] R. Kimura and K. Aikawa, “Proposal for a disaster management drill program for high school students who have never experienced a disaster to foster a sense of ‘awareness that disaster affects everyone’,” J. Disaster Res., Vol.19, No.1, pp. 124-138, 2024. https://doi.org/10.20965/jdr.2024.p0124
- [24] Y. Hosokawa and R. Kimura, “Study of an educational program aimed at preparing expectant and nursing mothers for disaster,” J. Soc. Saf. Sci., No.44, pp. 111-120, 2024 (in Japanese). https://doi.org/10.11314/jisss.44.111
- [25] T. Higashino and N. Yoshimoto, “Creating an e-learning course for elementary school teachers on cloud observations,” JSSE Res. Rep., Vol.33, No.7, pp. 33-36, 2019 (in Japanese). https://doi.org/10.14935/jsser.33.7_33
- [26] K. Ishii, M. Nakano, and M. Mizutani, “Development of management and career design program in a liberal arts curriculum,” J. JSEE, Vol.65, No.2, pp. 21-25, 2017 (in Japanese). https://doi.org/10.4307/jsee.65.2_21
- [27] R. M. Gagné, W. W. Wager, K. C. Golas, and J. M. Keller, “Principles of instructional design,” Translation supervised by M. Iwasaki and K. Suzuki, Kitaohji Shobo, 2007 (in Japanese).
- [28] National Research Institute for Earth Science and Disaster Resilience, “Disaster risk reduction education literacy HUB” (in Japanese). https://bosai-kyoiku.jp/bousai/189/ [Accessed April 19, 2026]
Appendix
Appendix A. Flood Questionnaire Items
The following are the questionnaire items used in this study. The Japanese wording is the original wording presented to the students, and the English translation is provided for reference.
-
Q1.
大雨で洪水が起こるしくみを説明できる。 (I can explain the mechanism by which heavy rainfall causes flooding.
-
Q2.
洪水が地域や生活に与える被害や影響を説明できる。 (I can explain the damage and impacts that floods have on local communities and daily life.)
-
Q3.
洪水から身を守るための避難行動(立退き・垂直・緊急安全確保)を説明できる。 (I can explain evacuation actions to protect myself from floods, including evacuation to another safe location, vertical evacuation, and securing emergency safety.)
-
Q4.
洪水時に発令される避難情報(警戒レベル1~5)の意味を説明できる。 (I can explain the meaning of flood-related warning and evacuation information corresponding to Alert Levels 1 to 5.)
-
Q5.
自治体が作成しているハザードマップの意味や見方を説明できる。 (I can explain the meaning of hazard maps prepared by local governments and how to read them.)
-
Q6.
「指定緊急避難場所」と「指定避難所」のちがいを説明できる。 (I can explain the difference between a designated emergency evacuation site and a designated evacuation shelter.)
-
Q7.
自分が住んでいる地域で洪水リスクが高い場所を説明できる。 (I can explain places with high flood risk in the area where I live.)
-
Q8.
自分が住んでいる地域で洪水から避難するための安全な場所を説明できる。 (I can explain safe places for evacuating from floods in the area where I live.)
-
Q9.
地図やハザードマップ(WebGISを含む)を使って,地形の高低や地理的な特性を調べて説明できる。 (I can use maps and hazard maps, including Web-GIS, to examine and explain differences in elevation and geographical characteristics.)
-
Q10.
地図やハザードマップを使って,洪水による浸水の深さや広がりを調べて説明できる。 (I can use maps and hazard maps to examine and explain the depth and extent of inundation caused by floods.)
-
Q11.
地図やハザードマップを使って,浸水しやすい地点や危険箇所を調べて説明できる。 (I can use maps and hazard maps to examine and explain locations that are likely to be inundated and hazardous places.)
-
Q12.
地図やハザードマップを使って,洪水のときに避難する場所を調べて説明できる。 (I can use maps and hazard maps to examine and explain places to evacuate to in the event of a flood.)
-
Q13.
地図やハザードマップを使って,洪水のときに避難する経路を調べて説明できる。 (I can use maps and hazard maps to examine and explain evacuation routes in the event of a flood.)
-
Q14.
地図やハザードマップを使って,洪水のときに自分が選んだ避難行動(場所・経路など)を説明できる。 (I can use maps and hazard maps to explain the evacuation actions I selected in the event of a flood, including evacuation places and routes.)
-
Q15.
他者と協力して,洪水リスクや避難行動について話し合い,自分の意見を説明できる。 (I can work with others to discuss flood risks and evacuation actions and explain my own opinion.)
-
Q16.
他者との話し合いを通じて,より安全な避難のしかたをまとめ,分かりやすく発表できる。 (I can summarize safer evacuation methods through discussions with others and present them clearly.)
This article is published under a Creative Commons Attribution-NoDerivatives 4.0 Internationa License.