
Paper:
Meteorological Drivers of Power Outages During Typhoon SHANSHAN (2024) and Their Regional Lag Characteristics Across Japan
Hiroshi Taniguchi*,†
 , Shigeru Nagata**, Shingo Suzuki**, and Go Urakawa*
*Graduate School of Disaster Resilience and Governance, University of Hyogo
1-5-2 Wakinohama Kaigan-dori, Chuo-ku, Kobe, Hyogo 651-0073, Japan
†Corresponding author
**Disaster Resilience Research Division, National Research Institute for Earth Science and Disaster Resilience
Tsukuba, Japan

Power outages are a widespread societal impact of tropical cyclones; however, the relative roles of different meteorological drivers remain poorly quantified at the regional scale. This study investigates the relationship between power outages and meteorological conditions during Typhoon SHANSHAN (2024) across Japan using nationwide outage records, together with precipitation and wind observations from the Automated Meteorological Data Acquisition System (AMeDAS) network. Time-series and lag-correlation analyses reveal statistically significant relationships between outages and both rainfall and wind gusts, with maximum correlation coefficients reaching approximately 0.5–0.8 depending on region and lag times ranging from approximately 1 to 20 h. The relative meteorological driver varies systematically across regions. Northern Japan exhibits wind-dominated behavior with relatively long lag times, whereas central Japan, particularly in the Tokai region, demonstrates rainfall-dominated responses with short lag times. Western Japan exhibits mixed wind and rainfall contributions. These results demonstrate that outage occurrence cannot be explained solely by proximity to the typhoon track but instead reflects region-specific meteorological forcing and different temporal response characteristics among regions. These findings provide new insights into regional outage-meteorology relationships and may contribute to improved risk assessment and preparedness for future tropical cyclone events.
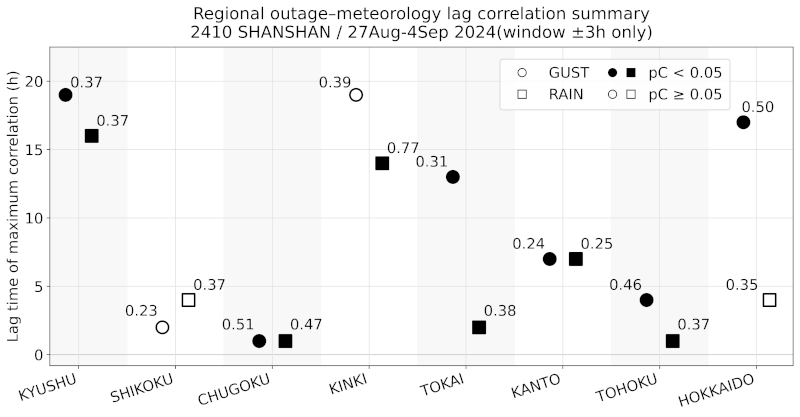
Regional lag correlations: Power outages & weather variables in Typhoon Shanshan (2024)
1. Introduction
Power outages caused by extreme weather events have a major societal impact on meteorological hazards. In particular, tropical cyclones frequently cause widespread disruptions to electric power systems through strong winds, heavy rainfall, flooding, and landslides. Such outages can affect large populations and critical infrastructure, leading to cascading impacts on transportation, communication, healthcare, and emergency response. Therefore, understanding the meteorological drivers of weather-related outages is important for improving disaster preparedness and risk mitigation.
Previous studies have revealed that strong winds are the chief cause of power outages during tropical cyclones, primarily through tree fall, vegetation contact with power lines, and structural damage to distribution networks (e.g., 1,2). Statistical analyses have demonstrated a strong relationship between wind speed and power supply interruptions across various regions 3. Moreover, heavy rainfall can contribute to outages through flooding, slope failures, and soil saturation that destabilizes infrastructure (e.g., 4,5). Previous studies have examined how meteorological factors influence outage risk and reveal that risk increases sharply beyond wind speed thresholds, and is amplified by concurrent rainfall 6.
Several studies have developed statistical models to predict hurricane-related power outages using meteorological variables and environmental factors such as wind speed, storm intensity, vegetation exposure, and infrastructure vulnerability 7,8,9,10,11,12. In Japan, recent studies have begun to examine typhoon-related outages and their impacts, including analyses of outage scale and duration during multiple typhoon events 13,14 and household experiences and resilience during major blackout events such as Typhoon Faxai 15.
Although these studies have improved our understanding of the factors associated with outage occurrences, relatively few have examined the temporal relationship between meteorological forcing and power outages. In practice, outages do not always occur simultaneously with the peak intensity of meteorological forcing. Instead, infrastructure failures may occur with delays relative to the strongest winds or heaviest rainfall. Such lag relationships may arise from delayed tree fall, progressive structural damage, hydrological responses to heavy rainfall, or cascading failures within power distribution systems.
In addition to temporal lag, the dominant meteorological drivers of outages may vary among regions. Differences in climate, vegetation, topography, infrastructure design, and exposure conditions can influence both the type of hazard and vulnerability of power systems. For example, regions with extensive forest cover may be more susceptible to wind-related outages caused by tree fall, whereas those with steep terrain may experience outages associated with rainfall-induced landslides 16,17. Despite these potential regional differences, systematic analyses of regional variations in outage–meteorology relationships remain limited (e.g., 18,19). Although recent studies have investigated the influence of meteorological conditions on power outages at regional and national scales [18,19], they have primarily focused on outage risk, outage occurrence, or spatial inequality. In contrast, the present study explicitly investigates the temporal relationship between meteorological forcing and outage occurrence by quantifying lag times and comparing the relative roles of wind gusts and rainfall across different regions of Japan. This temporal perspective provides additional insight into regional outage–meteorology relationships that cannot be obtained from analyses based solely on outage occurrence or spatial distribution.
This study aims to investigate the temporal relationship between meteorological forcing and power outage occurrence during Typhoon SHANSHAN (2024, No.10) from late August to early September 2024. Using outage records and meteorological observations, we computed lag correlations between outage occurrence and key meteorological variables, including wind gusts and rainfall, and compared these relationships across the regions of Japan. This regional analysis provides new insights into the hazard mechanisms that lead to power outages during tropical cyclones and contributes to improved outage risk assessment and disaster preparedness, by identifying characteristic lag structures, regional differences, and relative meteorological drivers of outages.
2. Data and Methods
2.1. Data
Power-outage data were collected from publicly available outage information provided by electric power companies in Japan 20,21,22,23,24,25,26,27,28,29,30. These data comprise power-outage information collected and aggregated hourly from the official websites of 10 electric power companies nationwide, reflecting the information available to each company at the time of publication. Outage information typically includes whether an outage occurred at a specific time, affected locations (prefecture; city/ward/gun; town/village), number of households affected, and cause of the outage. The publicly available outage information analyzed represents customer outages associated with distribution systems and does not include failures in extra-high-voltage transmission systems (66 kV and above). Furthermore, because the information is intended for public reporting, it excludes outages associated with customer-owned low-voltage facilities, service lines, extra-high-voltage customers, and momentary interruptions that occurred before the information was updated. In this analysis, we estimated the duration of power outages by examining the number of affected households per hour after excluding factors unrelated to weather conditions, such as utility company operations, aging infrastructure, earthquakes, contact with flying debris, and animal intrusion. As the outage information was collected at approximately one-hour intervals, outages that occurred and were restored between successive observations may not have been captured. Consequently, the estimated outage duration may have an uncertainty of approximately one hour. Furthermore, since the publicly available power-outage data does not include outages caused by damage to low-voltage lines and service lines, the number of affected households could have been underestimated. The original outage records were obtained at the municipal level (city, ward, gun, town, and village). For the regional time-series and lag-correlation analyses, these municipality-level outage records were aggregated into the predefined regions described in Section 2.2, and municipality-level data were retained for mapping and descriptive analyses.
Meteorological observations from the Automated Meteorological Data Acquisition System (AMeDAS) 31 operated by the Japan Meteorological Agency (JMA) were used to examine the relationship between outages and meteorological conditions. Hourly precipitation and wind data were extracted for each station. For wind conditions, the maximum gust speed was used as the primary indicator of wind intensity. For precipitation, hourly rainfall totals were used. Moreover, to understand the synoptic-scale rainfall and gust conditions when the target typhoon passed over Japan, supplementary rainfall data from the JMA Radar-AMeDAS 32 were used. To obtain an overview of weather conditions, we used JMA weather maps 33 and typhoon track data based on JMA best-track data 34.
Each power-outage location was associated with an AMeDAS station within the same region (defined in the next section) that contained valid observations for both wind and precipitation. The analysis focuses on Typhoon SHANSHAN (2024), which affected Japan from August 27 to September 4, 2024, and caused widespread outages across multiple regions.
2.2. Regional Classification
For the regional analyses presented in this study, municipality-level outage records were aggregated into broader geographic regions to facilitate nationwide comparison. The same regional classification was applied to the AMeDAS stations used in this study. The regions were defined based on prefecture polygons from the Ministry of Land, Infrastructure, Transport and Tourism (MLIT) National Land Numerical Information dataset. Thereafter, each prefecture was mapped to a regional classification designed to correspond approximately to electric power service areas. The regional categories used in this study are Hokkaido, Tohoku, Kanto, Tokai, Kinki, Chugoku, Shikoku, Kyushu, and Okinawa (Fig. 1 ). Regions with an insufficient number of outage events during the analysis period were excluded from the lag correlation analysis.
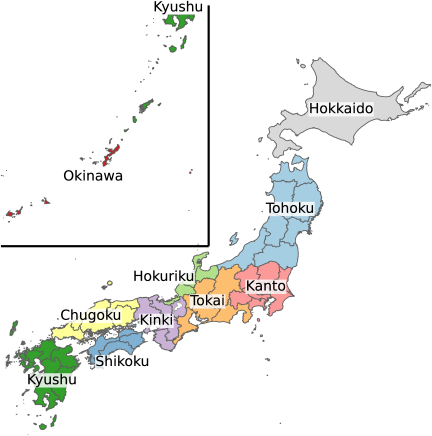
Fig. 1. Map of regional divisions in Japan used in this study. Each region is color-coded, and the region names are labeled on the map. The regional classifications are designed to correspond approximately to the service areas of the 10 major electric power companies in Japan.
2.3. Lag Correlation Analysis
To quantify the temporal (time \(t\)) relationship between meteorological forcing \(M(t)\) and outage occurrence \(O(t)\), lag (time \(\tau\)) correlations \(r(\tau)\) were computed between outage time series and meteorological variables as follows:
For each region and meteorological variable, correlations were evaluated across a range of temporal lags. Positive lag values (\(\tau >0\)) indicate that outages occur after the meteorological forcing. To focus on physically plausible relationships, only positive correlations (\(r>0\)) and non-negative lag times were considered when selecting the representative lag.
As outages may be triggered within a limited time window around meteorological forcing, event selection was performed using an event window centered on outage onset time. The chief analysis used a window of \(\pm 3\) h, while additional sensitivity analyses were performed using \(\pm 1\) and \(\pm 2\) h windows to confirm that the lag time does not vary significantly depending on the event window. The data within each event window were aggregated across all events to construct the time series used for correlation analysis. The resulting time series is not continuous in real time but is constructed by concatenating event-centered segments. This event window was introduced to account for potential spatiotemporal mismatches between outage occurrences and meteorological variables. As outages are localized phenomena, and meteorological variables are represented by regional aggregates, their temporal correspondence may shift. In addition, outage occurrence may not respond instantaneously to meteorological forcing but may reflect accumulated or delayed effects, such as vegetation failure or hydrological processes. Therefore, the event window allows for a more robust association by capturing temporal uncertainties. Lag correlations were computed using these time series by shifting the meteorological variables relative to the outage series in time.
A lag corresponding to the maximum positive correlation was identified for each region and variable. The lag search range was set to 0 to \(+24\) h, based on the assumption that outages occur after meteorological forcing. The corresponding correlation coefficient and lag time were used to summarize regional characteristics of outage–meteorology relationships.
2.4. Significance Testing
Statistical significance of the lag correlations was evaluated using three complementary approaches. First, conventional \(p\)-values associated with the Pearson correlation coefficient were computed for each lag. However, because the lag corresponding to the maximum correlation was selected from multiple candidates, these \(p\)-values may have been affected by selection bias and should be interpreted with caution. Therefore, they were used as a supplementary indicator of correlation strength rather than as a definitive measure of statistical significance.
Second, because correlations were evaluated across multiple lag values (\(0\) to \(+24\) h) and multiple event windows (\(\pm 1\) h, \(\pm 2\) h, and \(\pm 3\) h), a Bonferroni correction was applied to account for the total number of comparisons. The number of tests was defined as the product of the number of lag steps and event windows. The adjusted \(p\)-values were reported as \(\mathit{pBonf}\). This correction reduces the likelihood of false positives arising from repeated hypothesis testing across the examined lag windows.
Finally, a circular shift test was conducted to account for both temporal autocorrelation and the effect of lag selection. In this procedure, the meteorological time series is randomly shifted in time relative to the outage series while preserving the internal temporal structure of each series. The correlation statistic is recomputed for each shift to generate a null distribution of correlations under the hypothesis of no physical relationship between the variables. For each shifted meteorological data, the maximum correlation over the same lag range (\(0-24\) h) was used as the test statistic, ensuring consistency with the procedure applied to the original data. Thereafter, the significance level (\(pC\)) is estimated as the fraction of shifted correlations exceeding the observed correlation.
Together, these three tests provide a hierarchical evaluation of statistical significance. While the Pearson \(p\)-value offers an initial indication of correlation strength, the Bonferroni correction accounts for multiple testing, and the circular-shift test provides a more robust assessment in the presence of temporal autocorrelation.
3. Results
3.1. Meteorological Overview of Typhoon SHANSHAN (2024)
Figure 2 presents the synoptic-scale environment and associated precipitation during the approach and landfall of Typhoon SHANSHAN (2024) from August 27 to 30, 2024. The upper panels demonstrate surface weather maps at 09 JST for each day, whereas the lower panels illustrate the corresponding daily accumulated precipitation derived from the JMA Radar-AMeDAS dataset.
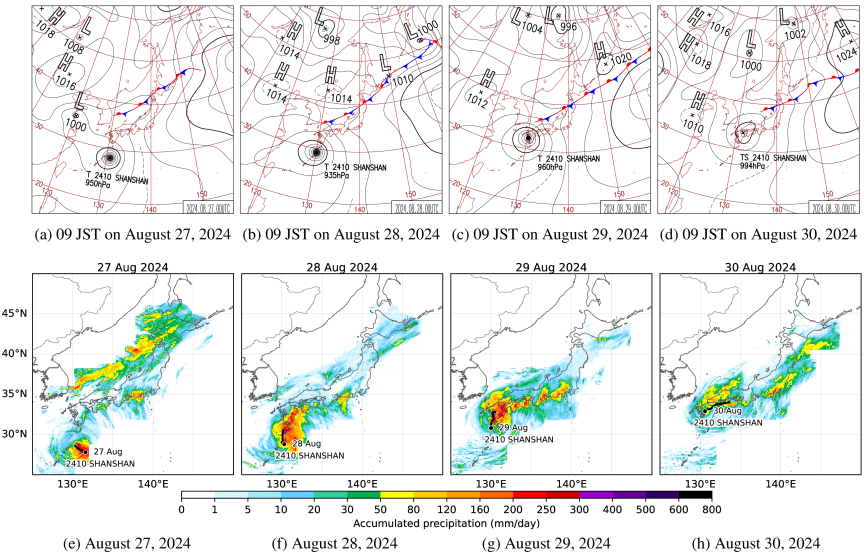
Fig. 2. Surface weather map (top figure) during the approach and landfall of Typhoon SHANSHAN (2024), and daily precipitation [mm/day] based on the JMA’s Radar-AMeDAS rainfall data (bottom figure). (a) to (d) present charts at 09 JST on August 27, 28, 29, and 30, 2024, respectively. (e) to (h) in the lower figure correspond to August 27, 28, 29, and 30, 2024, respectively. In each of the lower figures, the position of the typhoon’s center at 00 JST on that day is indicated by a black filled circle, and its path over the subsequent 24 h is indicated by a solid black line.
On August 27 (Figs. 2(a) and (e)), the typhoon was located south of Japan near Okinawa and began to move northward toward Kyushu. During this stage, substantial precipitation was observed over the Pacific side of western and central Japan, extending from Kyushu to Kanto. Notably, enhanced rainfall appeared over central Japan, including the Tokai region, despite the large distance from the typhoon center, indicating the remote effect of the typhoon, which is likely associated with strong moisture transport and outer rainbands. In addition, precipitation was observed along a frontal zone extending over the Sea of Japan, particularly in northern Tohoku and Hokkaido.
This rainfall was associated with a pre-existing baroclinic zone rather than the direct influence of the typhoon. Frontal precipitation weakened by August 28 (Figs. 2(b) and (f)), suggesting that its intensity varied independently before being modulated by interaction with the approaching typhoon circulation.
By August 28 (Figs. 2(b) and (f)), as the typhoon approached Kyushu, intense precipitation became more organized near the storm center, particularly over southern Kyushu. Simultaneously, a band of precipitation persisted over eastern Japan, suggesting the continued influence of moisture inflow from the typhoon circulation. The spatial extent of rainfall highlights that the impact of the typhoon was not confined to its immediate vicinity.
On August 29 (Figs. 2(c) and (g)), the typhoon made landfall over Kyushu and moved inland. Heavy rainfall was observed in a band of coastal areas on the Pacific side along a southwest-northeast oriented band, extending from western to eastern Japan. Concurrently, pronounced precipitation developed over northern Japan, particularly from Tohoku to Hokkaido. The surface weather map (Fig. 2(c)) indicates the presence of a pre-existing frontal zone in this region, which was likely intensified through interaction with the typhoon circulation. Enhanced low-level convergence and moisture supply along the front contributed to widespread and sustained rainfall.
On August 30 (Figs. 2(d) and (h)), after the typhoon weakened and moved further northeast, precipitation remained significant over eastern and northern Japan.
Subsequently, Typhoon SHANSHAN (2024) weakened into a tropical depression on August 31, and on September 1, it moved northward from the ocean off the Tokai region, made landfall in the Tokai region, and dissipated (not indicated in the figure). The rainfall distribution continued to reflect both the residual influence of the typhoon and the enhanced frontal activity. Overall, the precipitation associated with Typhoon SHANSHAN (2024) was characterized by a combination of direct forcing near the storm center, interaction with a pre-existing frontal system over northern Japan, and remote effects that produced substantial rainfall in regions far from the typhoon. These features demonstrate that the impact of the typhoon was governed not only by its track and intensity, but also by its interaction with the surrounding synoptic-scale environment.
However, according to AMeDAS observations, during Typhoon SHANSHAN (2024), the spatial distributions of maximum wind gusts and daily precipitation exhibited distinct but complementary patterns across Japan (Figs. 3 and 4). Strong wind gusts were concentrated on the right side of the storm track, particularly over southern Kyushu, reflecting the asymmetric wind structure associated with storm motion. Additionally, coastal areas nationwide experienced relatively high maximum wind gust speeds. In contrast, heavy precipitation formed a broad, band-like distribution extending from northern Kyushu to Chugoku, with extreme daily totals exceeding several hundred millimeters, likely enhanced by orographic effects. These results indicate that wind and rainfall-related hazards were spatially separated to some extent, implying regionally different mechanisms driving power outages during the event. For example, the largest wind gusts were concentrated in southern Kyushu, near the typhoon track, whereas intense precipitation extended over much broader areas, including the Tokai region and parts of northern Japan. These regional differences in meteorological intensity provide an important meteorological background for understanding regional variability in power-outage occurrences, as described in the following section.
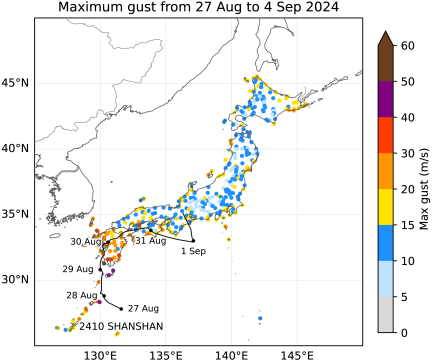
Fig. 3. Maximum gust speeds at each AMeDAS observation site from 00 JST, August 27 to 23 JST, September 24, 2024. The position of the typhoon and tropical depression’s center at 00 JST on that day is indicated by a black filled circle, and its path over the subsequent 24 h is indicated by a solid black line. The AMeDAS observation sites presented are the 413 valid sites that had no missing data during the target period.
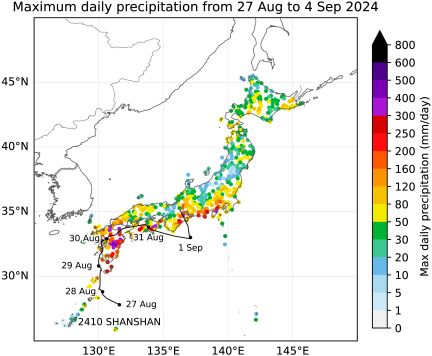
Fig. 4. Same as Fig. 3 but for daily maximum precipitation. The AMeDAS observation sites presented are valid sites with no missing data during the target period; this number totals to 621 sites.
3.2. Spatio-Temporal Distribution of Power Outages Associated with Typhoon SHANSHAN (2024)
3.2.1. Spatial Distribution of Power Outages
Figure 5 presents the daily evolution of the spatial distribution of power outages across Japan during Typhoon SHANSHAN (2024). Initially, outages were limited to August 27–28 (Figs. 5(a) and (b)) but expanded rapidly in both number and spatial extent as the typhoon approached the Japanese Archipelago, with peak activity observed on August 29–30 (Figs. 5(c)–(e)).
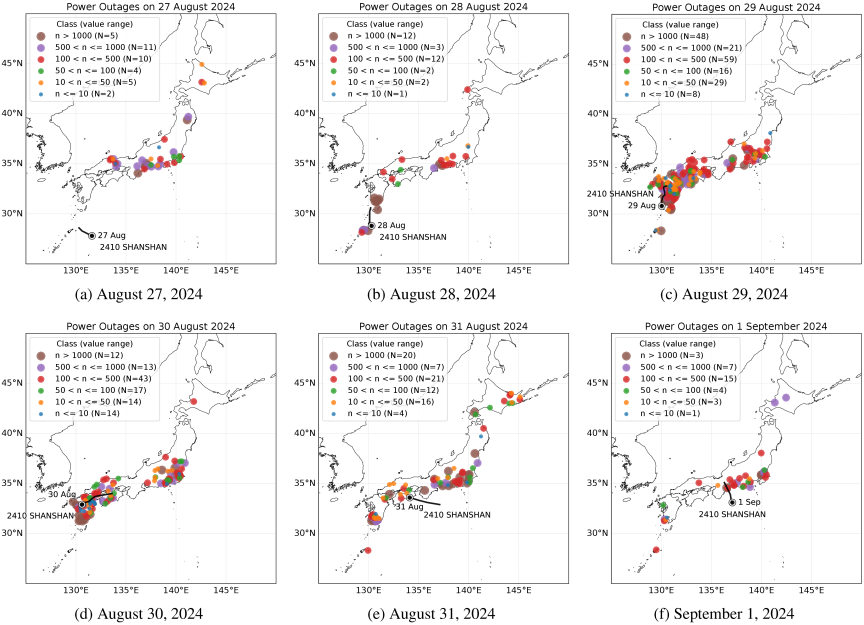
Fig. 5. Daily spatial distribution of power outages across Japan from August 27 to September 1, 2024, associated with Typhoon SHANSHAN (2024). Each panel corresponds to one day. Circles denote outage occurrences, and their color and size represent the number of customers without power according to the class ranges presented in the legend. The number of circles (ranks) for each category depicted in the figure is indicated by the value of “\(N=\)” in the legend.
On August 27, despite the typhoon center remaining near Okinawa (Fig. 2(a)), notable outage clusters were observed in parts of the Tokai and Chugoku regions (Fig. 5(a)). This suggests the influence of the remote effects of the typhoon, likely associated with its outer rainbands (Fig. 2(e)). In addition, outages were observed in areas from Tohoku to Hokkaido, where frontal rainfall occurred. In contrast, although Kyushu was closer to the center of the typhoon, reports of power outages decreased. However, as the data used in this analysis do not include information on outages caused by damage to low-voltage lines and service lines, further investigation is needed.
As the typhoon approached Kyushu on August 28, large-scale outages occurred in Kyushu and extended to Shikoku and Chugoku. Significant outages continued in the Tokai region, whereas minimal outage activity was observed in Tohoku and Hokkaido (Fig. 5(b)).
On August 29, when the typhoon made landfall in Kyushu, outages became widespread across Japan during the study period. Large-scale outages were observed over Kyushu, Shikoku, and in the Tokai and Kanto regions, whereas relatively few outages occurred in Kinki, Hokuriku, Tohoku, and Hokkaido (Fig. 5(c)).
On August 30, widespread outages occurred in Kyushu, Shikoku, Chugoku, Tokai, and Kanto. From August 30 to 31, as the typhoon track shifted eastward, the regions of large-scale outages migrated eastward, with extensive outages occurring over eastern Japan from Tokai and Kanto to Tohoku and Hokkaido (Figs. 5(d) and (e)).
On September 1, although the system had weakened into a tropical depression, large-scale outages continued in regions east of the track, particularly over Tokai and Kanto (Fig. 5(f)).
The spatial distribution of the outages corresponds closely to the meteorological conditions presented in Figs. 2–4. In particular, the outage clusters are co-located with regions of strong wind gusts (Fig. 3) and heavy precipitation (Fig. 4), and their evolution reflects the development and movement of typhoon rainbands and wind fields (Fig. 2).
These results indicate that both the direct impacts of the typhoon, primarily strong winds associated with the storm core, and remote effects, such as heavy rainfall and associated hazards occurring away from the storm center, were instrumental in outage occurrence, with distinct regional and temporal variations. To quantitatively evaluate these relationships and identify relative drivers of outages, we next analyze lag correlations between outage occurrence and key meteorological variables, including wind gusts and precipitation.
3.2.2. Timeline of the Power Outages
Figure 6 presents the regional time series of power outages across Japan during Typhoon SHANSHAN (2024) from August 27 to September 4, 2024. Each panel represents a different region and illustrates the temporal evolution of the number of households affected by power outages. The figure reveals pronounced regional differences in both the timing and number of households with power outages. In western Japan, particularly in Kyushu and Shikoku, outages increased rapidly and peaked on August 29, coinciding with the typhoon’s landfall. The number of households with power outages in Kyushu is significantly larger than that in other regions, indicating the severe impact of the typhoon’s landfall.
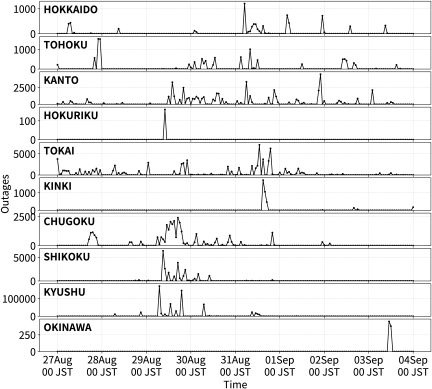
Fig. 6. Regional time series of the number of households of power outages across Japan during Typhoon SHANSHAN (2024) from August 27 to September 4, 2024. Each panel demonstrates the progression of power outages in a specific region. From top to bottom, they represent the Hokkaido, Tohoku, Kanto, Hokuriku, Tokai, Kinki, Chugoku, Shikoku, Kyushu, and Okinawa regions.
In contrast, regions in eastern Japan, including Tokai and Kanto, indicate delayed peaks, with outage activity persisting through August 30–31 and, in some cases, into September 1. This temporal shift reflects the eastward movement of the typhoon and the associated migration of strong winds and heavy precipitation events. Another notable feature is that the municipality-level outage records indicate intermittent large-scale outages in several parts of the Tokai region from the early hours of August 27, preceding the widespread outages observed in Kyushu and Shikoku. In some regions such as Tohoku and Hokkaido, although the number of households affected by power outages is relatively small, municipality-level outage records indicate that localized outages occurred intermittently during the study period. These outages coincided with precipitation associated with the frontal system and its interaction with typhoon circulation, as described in Section 3.1. Additionally, multiple peaks are observed in several regions, suggesting that outage occurrence is influenced by successive meteorological disturbances, including rainbands and evolving wind fields.
Overall, these results indicate that outage occurrence is strongly controlled by the spatial and temporal evolution of key meteorological drivers, that is, wind gusts and rainfall, and that the response varies substantially across regions. These regional differences in outage occurrence should be interpreted in conjunction with the regional variations in meteorological intensity described in Section 3.1. This consideration provides an important basis for the lag correlation analysis presented in the following section.
3.3. Lag Correlations Between Outages and Meteorological Variables
This section examines lag correlations between outage metrics and key meteorological variables, including wind gusts and precipitation, to quantitatively assess the relationship between outage occurrence and meteorological forcing suggested by the spatial (Fig. 5) and temporal (Fig. 6) analyses.
The regional differences in the timing of outage peaks (Fig. 7) indicate that outages do not occur simultaneously with meteorological extremes but instead exhibit time-lagged responses that vary by region. Rather than following a simple west-east contrast, the timing relationship differs substantially among regions. For example, outages occurring after meteorological peaks in some regions (e.g., Kyushu in Fig. 7(d)) demonstrate near-synchronous behavior in others (e.g., Chugoku in Fig. 7(c)), and exhibit variable lead-lag relationships in eastern and northern Japan (e.g., Hokkaido and Tokai in Figs. 7(a) and (b)). These patterns suggest a region-specific response to the typhoon’s progression.
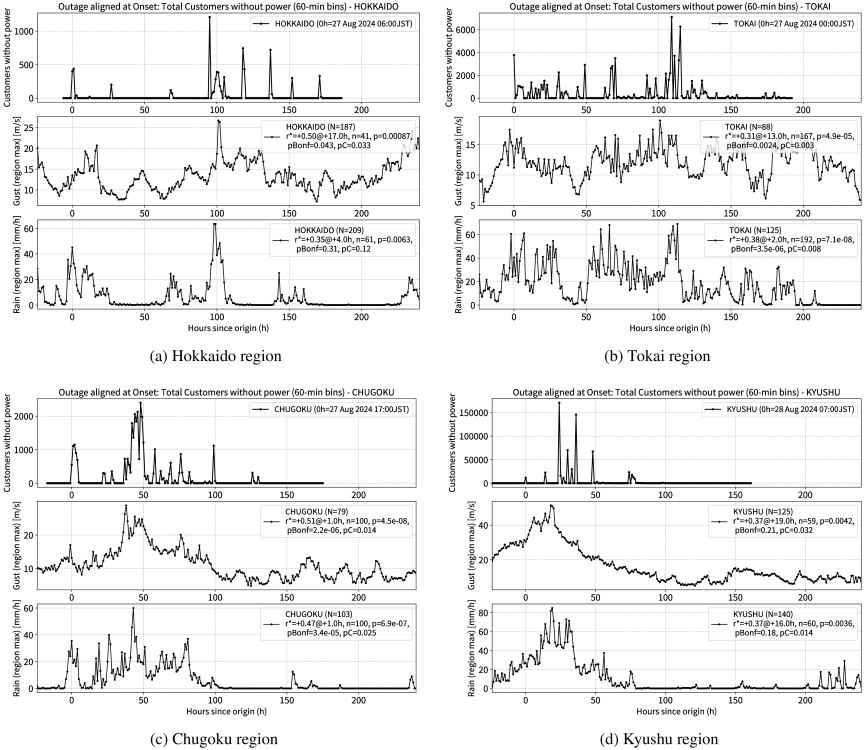
Fig. 7. Time series of the number of households affected by power outages and regional meteorological variables aligned at outage onset (\(0\) h) for four representative regions: (a) Hokkaido, (b) Tokai, (c) Chugoku, and (d) Kyushu. The horizontal axis is plotted on an onset time scale beginning from the time the power outage first occurred (\(0\) h) during the analysis period. The beginning time of the power outage is indicated in the top panel. The top panels for each region present the total number of households (customers) without power (\(60\)-min bins, same as Fig. 6), while the middle and bottom panels present the regional maximum gust [ms\(^{-1}\)] and the regional maximum hourly precipitation [mm/h], respectively. Meteorological variables are defined as the maximum value among AMeDAS observation sites within each region at each time step, and thus represent regional extremes. The value \(N\) denotes the number of AMeDAS stations used to derive these regional maximum values. Lag correlations between outages and meteorological variables were evaluated using a \(\pm 3\) h event-selection window. The correlation coefficient (\(r^{*}\)), optimal lag time (hour, the number after the @ symbol), sample size (\(n\)), and corresponding \(p\)-values are indicated in each panel, including the conventional \(p\)-value (\(p\)), Bonferroni-corrected \(p\)-value (\(\mathit{pBonf}\)), and the \(p\)-value obtained from the circular-shift test (\(pC\)), which accounts for temporal autocorrelation. Note that \(n\) means the number of samples used in the correlation analysis under the \(\pm 3\) h window. A positive lag indicates that meteorological factors precede the occurrence of power outages. These regions were selected to represent a transition from wind- to rainfall-dominated outage mechanisms across Japan.
To capture these relationships, we compute lag correlations between outage occurrence and meteorological variables for each region using an event-selection window of \(\pm 3\) h. This approach allows us to identify the relative drivers of outages and quantify the characteristic time delays between meteorological forcing and outage occurrence. Notably, the lag correlation does not represent the temporal difference between peak values of the time series. Rather, it reflects the overall similarity in temporal evolution between outage occurrence and meteorological variables over the entire analysis period. In addition, meteorological variables are defined as regional maximum values at each time step, which do not necessarily correspond to the local conditions at the outage locations. Fig. 8 summarizes the regional characteristics of lag correlations during Typhoon SHANSHAN (2024) on August 27 to September 4, 2024. Clear regional contrasts are found in both the relative meteorological drivers and the associated lag times. Representative examples for the four regions (Hokkaido, Tokai, Chugoku, and Kyushu) are presented in Fig. 7.
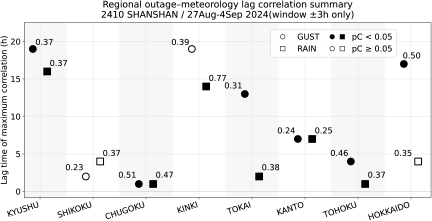
Fig. 8. Regional summary of lag correlations between power outages and meteorological variables (regional maximum gust and hourly precipitation) during Typhoon SHANSHAN (2024) (August 27 to September 4, 2024), based on the \(\pm 3\) h event-selection window. The horizontal axis indicates regions of Japan, while the vertical axis depicts the lag time (\(h\)) at which the maximum correlation is obtained. Circles represent correlations with gust, and squares represent correlations with rainfall. Filled symbols indicate statistically significant correlations based on the circular-shift test (\(pC < 0.05\)), whereas open symbols denote non-significant results (\(pC \ge 0.05\)). Numbers adjacent to each marker indicate the corresponding correlation coefficients (\(r^{*}\)).
In Hokkaido (Fig. 7(a)), the correlation with gusts is larger than that with rainfall, indicating a stronger statistical association with wind. However, rainfall exhibits a shorter lag, suggesting a more immediate temporal linkage to outage occurrence. Considering that the correlation magnitude and lag represent different aspects of the relationship, these results do not necessarily imply that wind is the dominant driver. Instead, they indicate that wind and rainfall contribute to the outages through different temporal mechanisms. This apparent delay (lag) should be interpreted in terms of the overall temporal relationship between the time series rather than the difference in peak timing.
In Tokai (Fig. 7(b)), which experienced the earliest onset of outages (August 27, 00 JST) and several outage cases comparable to Shikoku, and second only to Kyushu, the correlation with rainfall exceeds that with gusts. The lag associated with rainfall is very short (approximately \(+2\) h), indicating a near-synchronous response of the outages to intense precipitation.
In Chugoku (Fig. 7(c)), the correlation with gusts is stronger than that with rainfall, similar to Hokkaido; however the lag time is much shorter (approximately \(+1\) h). This suggests a rapid outage response to peak wind conditions in this region.
In Kyushu (Fig. 7(d)), where the largest number of outages was observed, the correlations with gusts and rainfall are comparable. Notably, the lag times are relatively long (approximately \(+16\)–19 h), indicating that outages are influenced by the delayed or accumulated effects of meteorological forcing rather than immediate responses. This reflects the temporal structure of the time series rather than a simple shift between the peak values.
The nationwide summary (Fig. 8 ) further reveals that regions located along the typhoon track do not necessarily exhibit short lag times. Instead, relatively short lags (approximately \(+1\)–7 h) are found in regions strongly affected by the remote influence of the typhoon, including Shikoku, Chugoku, Tokai, Kanto, and Tohoku. These results suggest that indirect meteorological processes associated with typhoons, such as frontal and outer rainbands, can trigger outages with minimal delay.
Overall, these findings demonstrate that the relative contributions of wind and rainfall and the temporal response of outages vary substantially across regions. Rather than indicating a single dominant driver, the results suggest that wind and rainfall are associated with outages in various ways. In northern regions, outages tend to exhibit longer lag times with respect to wind, whereas in central Japan, shorter lags are often observed with respect to rainfall. In other regions, including those directly affected by the typhoon core, more complex and delayed responses are evident, reflecting the combined influence of multiple meteorological processes. These results indicate that outage risk cannot be explained solely by proximity to the typhoon center but must also account for regional differences in wind and rainfall and their associated temporal response characteristics.
3.4. Regional Differences in Relative Drivers of Power Outages
To further investigate the physical mechanisms underlying the regional differences identified in the lag correlation analysis, we compared the relative contributions of wind and rainfall to outage occurrence across regions (Fig. 9). By directly comparing correlations with rainfall and wind gusts, this analysis provides an indicative comparison of the relative associations of wind and rainfall with outage occurrence, without implying that their effects are independent.
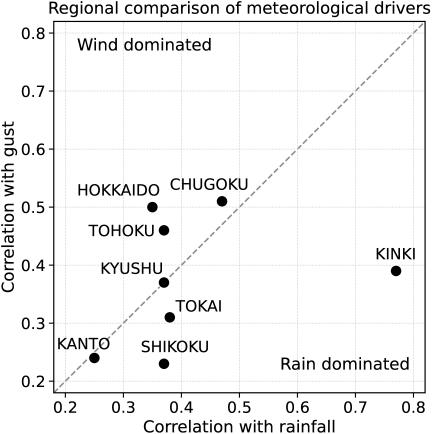
Fig. 9. Regional comparison of relative meteorological drivers of power outages during Typhoon SHANSHAN (2024) August 27 to September 4, 2024. The horizontal axis represents the correlation coefficient between outages and regional maximum hourly precipitation, while the vertical axis represents the correlation with regional maximum wind gust. Each point corresponds to a region of Japan. The dashed line indicates equal correlation with rainfall and gust. Regions above (below) the line are interpreted as wind-dominated (rainfall-dominated) in terms of outage drivers.
Figure 9 summarizes the correlation coefficients between outages and the regional maximum gust (vertical axis) and regional maximum hourly precipitation (horizontal axis) for each region. The dashed line indicates equal correlation; regions located above (below) the line indicate stronger correlations with wind (rainfall) relative to the other variable in terms of outage drivers.
As wind and rainfall are physically related and often co-occur within tropical cyclones, the correlations presented here do not represent the independent contributions of each variable. A more rigorous separation of their effects would require multivariate approaches such as multiple regression or partial correlation analysis. Therefore, the present comparison should be interpreted as a descriptive measure of relative association rather than a causal attribution.
The results reveal clear regional contrasts in relative meteorological drivers. In northern Japan, including Hokkaido and Tohoku, outages indicate a relatively stronger association with wind than with rainfall, as indicated by stronger correlations with gusts than with rainfall. This is consistent with the long lag times identified in Section 3.3, suggesting that outages in these regions are linked to delayed impacts of strong winds, such as tree falls and infrastructure damage.
In contrast, central Japan exhibits a greater influence of rainfall. In particular, Tokai is characterized by a stronger correlation with precipitation than with gusts, indicating a rainfall-dominated outage mechanism. This result is consistent with the short lag times (\(\sim\) \(+2\) h) identified in Section 3.3, suggesting that outages in this region occur nearly simultaneously with intense rainfall events, which are likely associated with rainbands and frontal precipitation. Moreover, the Kinki region demonstrates a strong rainfall signal, although its lag structure differs from that of Tokai, indicating regional variability even within rainfall-dominated regimes.
Western Japan demonstrates a more complex behavior. Chugoku lies slightly above the equality line, indicating a wind-dominated but rapid-response regime, consistent with the short lag (\(\sim\) \(+1\) h) identified in Section 3.3. In contrast, Kyushu, which experienced the largest number of outages, is located close to the equality line, indicating comparable levels of association with both wind and rainfall. Combined with the long lag times (\(\sim\)16–19 h), this suggests that outages in Kyushu are influenced by both strong winds and accumulated rainfall, as well as indirect or delayed, widespread damage processes.
Overall, these results indicate that the relative drivers of outages vary systematically across Japan, reflecting differences in the meteorological forcing associated with typhoon structure. The regions directly affected by the typhoon core do not necessarily exhibit wind-dominated behavior; instead, mixed or delayed responses are observed. Conversely, regions influenced by remote meteorological processes, such as outer rainbands or frontal systems, often exhibit rainfall-dominated or rapid-response outage mechanisms. These findings demonstrate that outage mechanisms cannot be explained solely by proximity to the typhoon center but must be understood in terms of region-specific combinations of meteorological drivers and response times. This highlights the importance of incorporating both wind and rainfall effects and their temporal characteristics in outage risk assessment and modeling.
| Region | Var | Window | \(\boldsymbol{n}\) | \(\boldsymbol{r}\) | Lag \(\boldsymbol{\tau}\) | \(\boldsymbol{p}\) | pBonf | \(\boldsymbol{pC}\) |
| HOKKAIDO | GUST | \(\pm\)1 h | 12 | 0.65 | \(+\)17 h | 0.023 | 1 | 0.092 |
| HOKKAIDO | GUST | \(\pm\)2 h | 26 | 0.50 | \(+\)17 h | 0.0091 | 0.45 | 0.001 |
| HOKKAIDO | GUST | \(\pm\)3 h | 41 | 0.50 | \(+\)17 h | 8.7e-04 | 0.043 | 0.033 |
| HOKKAIDO | RAIN | \(\pm\)1 h | 23 | 0.59 | \(+\)3 h | 0.0034 | 0.16 | 0.15 |
| HOKKAIDO | RAIN | \(\pm\)2 h | 48 | 0.41 | \(+\)3 h | 0.0039 | 0.19 | 0.069 |
| HOKKAIDO | RAIN | \(\pm\)3 h | 61 | 0.35 | \(+\)4 h | 0.0063 | 0.31 | 0.12 |
| TOHOKU | GUST | \(\pm\)1 h | 26 | 0.57 | \(+\)3 h | 0.0025 | 0.12 | 0.094 |
| TOHOKU | GUST | \(\pm\)2 h | 54 | 0.50 | \(+\)4 h | 1.0e-04 | 0.0049 | 0.016 |
| TOHOKU | GUST | \(\pm\)3 h | 86 | 0.46 | \(+\)4 h | 7.8e-06 | 3.8e-04 | 0.001 |
| TOHOKU | RAIN | \(\pm\)1 h | 14 | 0.53 | \(+\)12 h | 0.05 | 1 | 0.001 |
| TOHOKU | RAIN | \(\pm\)2 h | 54 | 0.41 | \(+\)4 h | 0.0023 | 0.11 | 0.038 |
| TOHOKU | RAIN | \(\pm\)3 h | 116 | 0.37 | \(+\)1 h | 3.7e-05 | 0.0018 | 0.013 |
| KANTO | GUST | \(\pm\)1 h | 93 | 0.32 | \(+\)5 h | 0.0015 | 0.074 | 0.015 |
| KANTO | GUST | \(\pm\)2 h | 148 | 0.27 | \(+\)7 h | 1.0e-03 | 0.05 | 0.017 |
| KANTO | GUST | \(\pm\)3 h | 188 | 0.24 | \(+\)7 h | 9.8e-04 | 0.048 | 0.01 |
| KANTO | RAIN | \(\pm\)1 h | 99 | 0.38 | \(+\)7 h | 1.2e-04 | 0.0059 | 0.016 |
| KANTO | RAIN | \(\pm\)2 h | 148 | 0.27 | \(+\)7 h | 9.4e-04 | 0.046 | 0.012 |
| KANTO | RAIN | \(\pm\)3 h | 188 | 0.25 | \(+\)7 h | 5.7e-04 | 0.028 | 0.001 |
| TOKAI | GUST | \(\pm\)1 h | 111 | 0.33 | \(+\)13 h | 4.6e-04 | 0.023 | 0.001 |
| TOKAI | GUST | \(\pm\)2 h | 141 | 0.32 | \(+\)13 h | 1.4e-04 | 0.0069 | 0.001 |
| TOKAI | GUST | \(\pm\)3 h | 167 | 0.31 | \(+\)13 h | 4.9e-05 | 0.0024 | 0.003 |
| TOKAI | RAIN | \(\pm\)1 h | 130 | 0.40 | \(+\)2 h | 3.2e-06 | 1.5e-04 | 0.009 |
| TOKAI | RAIN | \(\pm\)2 h | 164 | 0.39 | \(+\)2 h | 1.7e-07 | 8.3e-06 | 0.008 |
| TOKAI | RAIN | \(\pm\)3 h | 192 | 0.38 | \(+\)2 h | 7.1e-08 | 3.5e-06 | 0.008 |
| KINKI | GUST | \(\pm\)1 h | 5 | 0.81 | \(+\)21 h | 0.098 | 1 | 0.19 |
| KINKI | GUST | \(\pm\)2 h | 16 | 0.50 | \(+\)20 h | 0.048 | 1 | 0.12 |
| KINKI | GUST | \(\pm\)3 h | 26 | 0.39 | \(+\)19 h | 0.048 | 1 | 0.19 |
| KINKI | RAIN | \(\pm\)1 h | 8 | 0.92 | \(+\)14 h | 0.0011 | 0.052 | 0.14 |
| KINKI | RAIN | \(\pm\)2 h | 18 | 0.82 | \(+\)14 h | 3.4e-05 | 0.0016 | 0.049 |
| KINKI | RAIN | \(\pm\)3 h | 27 | 0.77 | \(+\)14 h | 2.6e-06 | 1.3e-04 | 0.032 |
| CHUGOKU | GUST | \(\pm\)1 h | 56 | 0.53 | \(+\)5 h | 2.8e-05 | 0.0014 | 0.032 |
| CHUGOKU | GUST | \(\pm\)2 h | 73 | 0.52 | \(+\)5 h | 2.2e-06 | 1.1e-04 | 0.013 |
| CHUGOKU | GUST | \(\pm\)3 h | 100 | 0.51 | \(+\)1 h | 4.5e-08 | 2.2e-06 | 0.014 |
| CHUGOKU | RAIN | \(\pm\)1 h | 75 | 0.50 | \(+\)1 h | 6.1e-06 | 3.0e-04 | 0.017 |
| CHUGOKU | RAIN | \(\pm\)2 h | 90 | 0.47 | \(+\)1 h | 3.0e-06 | 1.5e-04 | 0.014 |
| CHUGOKU | RAIN | \(\pm\)3 h | 100 | 0.47 | \(+\)1 h | 6.9e-07 | 3.4e-05 | 0.025 |
| SHIKOKU | GUST | \(\pm\)1 h | 37 | 0.31 | \(+\)2 h | 0.064 | 1 | 0.17 |
| SHIKOKU | GUST | \(\pm\)2 h | 55 | 0.22 | \(+\)2 h | 0.11 | 1 | 0.36 |
| SHIKOKU | GUST | \(\pm\)3 h | 68 | 0.23 | \(+\)2 h | 0.061 | 1 | 0.32 |
| SHIKOKU | RAIN | \(\pm\)1 h | 37 | 0.38 | \(+\)2 h | 0.02 | 0.99 | 0.15 |
| SHIKOKU | RAIN | \(\pm\)2 h | 48 | 0.38 | \(+\)4 h | 0.0071 | 0.35 | 0.11 |
| SHIKOKU | RAIN | \(\pm\)3 h | 62 | 0.37 | \(+\)4 h | 0.0027 | 0.13 | 0.072 |
| KYUSHU | GUST | \(\pm\)1 h | 27 | 0.50 | \(+\)10 h | 0.0083 | 0.41 | 0.001 |
| KYUSHU | GUST | \(\pm\)2 h | 45 | 0.41 | \(+\)8 h | 0.0046 | 0.23 | 0.06 |
| KYUSHU | GUST | \(\pm\)3 h | 59 | 0.37 | \(+\)19 h | 0.0042 | 0.21 | 0.032 |
| KYUSHU | RAIN | \(\pm\)1 h | 28 | 0.52 | \(+\)7 h | 0.0041 | 0.2 | 0.038 |
| KYUSHU | RAIN | \(\pm\)2 h | 45 | 0.40 | \(+\)7 h | 0.0059 | 0.29 | 0.053 |
| KYUSHU | RAIN | \(\pm\)3 h | 60 | 0.37 | \(+\)16 h | 0.0036 | 0.18 | 0.014 |
3.5. Sensitivity of Results to Event Window Definition
To assess the robustness of the lag correlation results, we examined the sensitivity of the analysis to the definition of an event selection window. Table 1 summarizes the lag-correlation statistics for three event window sizes (\(\pm 1\) h, \(\pm 2\) h, and \(\pm 3\) h) for each region and meteorological variable.
Overall, the results reveal that the primary characteristics of the lag-correlation analysis are largely insensitive to the choice of the event window. The estimated lag times corresponding to the maximum correlations remain remarkably consistent across the different window sizes. For most regions, variations in the lag are within a few hours, indicating that the temporal relationship between outages and meteorological forcing is robust and not strongly dependent on specific event selection criteria.
In contrast, the magnitude of the correlation coefficients (\(r\)) tends to decrease slightly as the event window increases. This behavior is expected because a wider window includes a larger number of less strongly related samples, thereby reducing the peak correlation. However, these changes are generally modest and do not alter the overall interpretation of the relative relationships.
Moreover, statistical significance remains broadly consistent across window sizes. In many cases, correlations that are significant for the \(\pm 1\) h window remain significant for \(\pm 2\) h and \(\pm 3\) h, particularly for key regions such as Hokkaido, Tokai, Chugoku, and Kyushu. Although some marginal cases exhibit reduced significance at larger window sizes, the overall pattern of statistically significant relationships is preserved.
These results indicate that the identified lag structures and dominant meteorological drivers are robust with respect to the event selection window. Therefore, the conclusions drawn in this study do not depend sensitively on the specific choice of \(\pm 3\) h and can be considered representative of the underlying outage–meteorology relationships.
4. Discussion
The results revealed pronounced regional differences in the relative roles of meteorological factors associated with power outages and a temporal lag between meteorological conditions and outage occurrence. These differences likely reflect a combination of regional hazard processes, infrastructure characteristics, and exposure conditions, as highlighted in previous studies on weather-related power outages 11,14. Notably, correlation magnitude and lag time represent different aspects of the outage–meteorology relationship. While correlation indicates the strength of covariability, lag time provides information on the temporal responsiveness of outages to meteorological conditions. Therefore, a variable with a smaller correlation but shorter lag may be instrumental in triggering outages.
In northern Japan, particularly in Hokkaido, outages demonstrate a relatively stronger association with strong winds than with rainfall and exhibit a relatively long lag of approximately \(+17\) h between the peak gust and outage occurrence. This delayed response suggests that outages are not always triggered immediately by peak wind conditions but may instead reflect secondary processes occurring after the strongest winds. One possible explanation is that these delayed responses reflect the time required for weather-related damage to develop and be reflected in the reported outage records owing to the fact that the power supply area is more extensive than in other prefectures. Previous studies have suggested that delayed outages may be associated with vegetation interactions and other weather-related damage processes in distribution systems 2,3,8. However, the present dataset does not permit the identification of the specific physical mechanisms responsible for individual outages.
In contrast, the Tohoku region exhibits shorter lag times of roughly \(+1\)–4 h, with both gust and rainfall indicating significant correlations with outage occurrence. This pattern suggests a more immediate outage response to meteorological conditions. Such shorter lags may indicate that outages are associated with strong wind loading or rainfall-related hazards such as localized flooding, slope instability, or debris flows that affect the electrical infrastructure shortly after intense precipitation events. These rapid responses are consistent with those of previous studies linking meteorological conditions to infrastructure failure 6,12.
In central Japan, particularly in the Tokai region, the analysis reveals a distinct contrast in the temporal characteristics of wind and rainfall. Rainfall indicates a short lag of approximately \(+2\) h, whereas gusts exhibits a longer lag of approximately \(+13\) h. The short lag associated with rainfall suggests a rapid response of outages to precipitation-related processes, although the correlation magnitude alone does not necessarily indicate a dominant contribution. One possible explanation is that rainfall-related outages reflect rapid hydrological responses such as flash flooding or localized ground failures that occur shortly after heavy precipitation, as reported in studies of rainfall-induced hazards 5,17. In contrast, wind-related outages may involve delayed processes such as structural fatigue, progressive vegetation damage, or cascading failures within the distribution network, which is consistent with previous storm-impact studies 1.
In the Kanto region, both gust and rainfall demonstrate comparable levels of association, with moderate lag times of approximately \(+5\) to \(+7\) h. This intermediate behavior likely reflects the interaction of multiple hazard processes in densely populated regions, where both wind and rainfall are associated with infrastructure disruption.
Further, western Japan (Chugoku and Kyushu) demonstrates significant correlations for both meteorological variables, with lag times ranging from approximately \(+1\) to \(+20\) h. In these regions, the relative association of wind- and rainfall-related processes may vary depending on the local topography, land cover, and infrastructure vulnerability, as suggested by previous studies on typhoon-related outages 1,13. In particular, Kyushu exhibits comparable correlations for wind and rainfall together with long lag times, suggesting the influence of both variables as well as delayed or accumulated damage processes.
As wind gusts and heavy rainfall are physically related and often co-occur within tropical cyclones, their effects on outages are not independent. Therefore, the correlations presented here should be interpreted as indicative measures of association rather than the isolated contributions of each variable. A more rigorous separation of individual effects would require multivariate approaches such as multiple regression or partial correlation analysis. Nevertheless, the present results provide useful insights into how different meteorological conditions are temporally related to outage occurrence across regions.
Furthermore, as presented in Figs. 3 and 4, the number of AMeDAS stations measuring rainfall exceeds the number of those measuring wind speed. This imbalance suggests that analyses focusing solely on wind intensity may underestimate the contribution of rainfall variability or localized gusts. To address this limitation, the present study analyzed the full time series of meteorological variables rather than relying only on peak values. This approach enables a more balanced assessment of outage–meteorology relationships and extends the previous statistical approaches used for outage prediction 7,9,11.
Overall, the analysis indicates that the temporal relationship between meteorological conditions and outage occurrence varies substantially among the regions. These regional differences highlight the importance of considering local hazard mechanisms and infrastructure characteristics when interpreting outage–meteorology relationships. Rather than indicating a single dominant driver, the results suggest that wind and rainfall are associated with outages differently, particularly in terms of their temporal characteristics. Moreover, the findings imply that outage forecasting or risk assessment systems may benefit from region-specific parameterizations that account for both the strength of the association and response time of outages to meteorological conditions, consistent with recent studies on climate impacts and outage risk 19.
One limitation of the present study is that the outage records and meteorological observations were analyzed at a regional scale. Consequently, localized severe weather phenomena, such as tornadoes, localized downbursts, and other small-scale convective events, cannot be explicitly evaluated within the present analytical framework. Therefore, their effects were included only as part of the regional aggregated response and could not be isolated using the present dataset.
Notably, the outage records analyzed in this study represent customer outages associated with distribution systems and do not include failures in extra-high-voltage transmission systems (66 kV and above). Furthermore, the available outage data do not identify the specific causes of distribution system failures, such as tree contact, pole failures, conductor damage, or flooding of electrical equipment. Therefore, the physical mechanisms responsible for individual outages cannot be determined directly from the present dataset. Future studies combining higher-resolution meteorological observations with detailed utility damage records would provide further insights into these localized outage mechanisms.
Notably, this analysis focused on a single typhoon. Although the results provide useful insights into the regional characteristics of outage–meteorology relationships, additional events should be analyzed to assess the robustness and generality of the observed patterns. Therefore, future work will extend the analysis to multiple typhoon cases to evaluate whether the regional lag structures identified in this study represent the systematic characteristics of outage responses to meteorological hazards.
5. Conclusion
This study investigated the temporal relationship between meteorological forcing and power-outage occurrence during Typhoon SHANSHAN (2024) in Japan. Using outage records collected from electric power companies and meteorological observations from AMeDAS stations, lag correlations were analyzed between outages and key meteorological variables, that is, wind gusts and rainfall.
The results revealed clear regional differences in the relative roles of wind and rainfall and the associated lag times. In northern Japan, particularly in Hokkaido, outages indicate a stronger association with strong winds and exhibit relatively long lag times, suggesting delayed impacts, such as vegetation-related damage to power lines. In contrast, the Tohoku region demonstrates shorter lag times and significant correlations with both wind and rainfall, indicating a more immediate response of outages to meteorological conditions. In central Japan, particularly in the Tokai region, wind and rainfall exhibit markedly different lag characteristics, with wind-related outages occurring after longer delays and rainfall-related outages occurring shortly after heavy precipitation.
More broadly, the analysis suggests systematic variation in outage–meteorology relationships across Japan, from stronger associations with wind in the northern regions, to stronger associations with rainfall in the central regions, and mixed influences in the western regions. These results indicate that outage occurrence cannot be explained solely by proximity to the typhoon center but instead depends on region-specific combinations of wind, rainfall, and regional characteristics of the outage response.
These findings highlight the importance of considering regional hazard mechanisms when analyzing weather-related power outages. These results have practical implications for disaster preparedness and infrastructure resilience, suggesting that mitigation strategies should be tailored to regional characteristics of meteorological conditions and their temporal responses.
Although this study focused on a single typhoon event, the analysis framework provides a robust and transferable approach for identifying regional outage–meteorology relationships. Future studies should extend this analysis to multiple tropical cyclone events to evaluate the generality of the regional lag structures identified in this study.
Acknowledgments
The authors express their gratitude to the anonymous reviewers for their valuable comments regarding the original manuscript.
- [1] D. W. Wanik, E. N. Anagnostou, M. Astitha, B. M. Hartman, G. M. Lackmann, J. Yang, D. Cerrai, J. He, and M. E. B. Frediani, “A case study on power outage impacts from future hurricane sandy scenarios,” J. of Applied Meteorology and Climatology, Vol.57, No.1, pp. 51-79, 2018. https://doi.org/10.1175/JAMC-D-16-0408.1
- [2] W. O. Taylor, P. L. Watson, D. Cerrai, and E. Anagnostou, “A statistical framework for evaluating the effectiveness of vegetation management in reducing power outages caused during storms in distribution networks,” Sustainability, Vol.14, No.2, Article No.904, 2022. https://doi.org/10.3390/su14020904
- [3] J. Haakana, O. Räisänen, M. Karhunen, I. Láng-Ritter, and J. Lassila, “Impact of wind speed and soil frost on electricity distribution system reliability,” Heliyon, Vol.10, No.24, Article No.e40846, 2024. https://doi.org/10.1016/j.heliyon.2024.e40846
- [4] S.-G. Yum, K. Son, S. Son, and J.-M. Kim, “Identifying risk indicators for natural hazard-related power outages as a component of risk assessment: An analysis using power outage data from Hurricane Irma,” Sustainability, Vol.12, No.18, Article No.7702, 2020. https://doi.org/10.3390/su12187702
- [5] J. M. D. S. R. Neto and N. P. Bhandary, “Influence of localized rainfall patterns on landslide occurrence—A case study of southern Hiroshima with extended radar information network data during the July 2018 heavy rain disasters,” Geosciences, Vol.13, No.8, Article No.245, 2023. https://doi.org/10.3390/geosciences13080245
- [6] E. Rimkus, E. Stonevičius, I. Gečaitė, V. Mačiulytė, and D. Valiukas, “Impact of meteorological conditions on overhead transmission line outages in Lithuania,” Atmosphere, Vol.15, No.11, Article No.1349, 2024. https://doi.org/10.3390/atmos15111349
- [7] R. Nateghi, S. D. Guikema, and S. M. Quiring, “Comparison and validation of statistical methods for predicting power outage durations in the event of hurricanes,” Risk Analysis, Vol.31, No.12, pp. 1897-1906, 2011. https://doi.org/10.1111/j.1539-6924.2011.01618.x
- [8] S. M. Quiring, L. Zhu, and S. D. Guikema, “Importance of soil and elevation characteristics for modeling hurricane-induced power outages,” Natural Hazards, Vol.58, No.1, pp. 365-390, 2011. https://doi.org/10.1007/s11069-010-9672-9
- [9] R. Nateghi, S. Guikema, and S. M. Quiring, “Power outage estimation for tropical cyclones: Improved accuracy with simpler models,” Risk Analysis, Vol.34, No.6, pp. 1069-1078, 2014. https://doi.org/10.1111/risa.12131
- [10] R. Nateghi, S. D. Guikema, and S. M. Quiring, “Forecasting hurricane-induced power outage durations,” Natural Hazards, Vol.74, No.3, pp. 1795-1811, 2014. https://doi.org/10.1007/s11069-014-1270-9
- [11] S. D. Guikema, R. Nateghi, S. M. Quiring, A. Staid, A. C. Reilly, and M. Gao, “Predicting hurricane power outages to support storm response planning,” IEEE Access, Vol.2, pp. 1364-1373, 2014. https://doi.org/10.1109/ACCESS.2014.2365716
- [12] H. Hou, S. Zhu, H. Geng, M. Li, Y. Xie, L. Zhu, and Y. Huang, “Spatial distribution assessment of power outage under typhoon disasters,” Int. J. of Electrical Power & Energy Systems, Vol.132, Article No.107169, 2021. https://doi.org/10.1016/j.ijepes.2021.107169
- [13] S. Nagata, Y. Maruyama, S. Suzuki, S. Sudo, S. Shimizu, K. Yoshimori, S. Yusa, and S. Toride, “Damage to power supply facilities and power outages due to Typhoon Faxai (ty1915),” Natural Disaster Research Report, Vol.57, pp. 55-65, 2022 (in Japanese). https://doi.org/10.24732/nied.00002376
- [14] Y. Li, F. Xiao, X. Zhang, W. Gao, Y. Ruan, N. Zhou, and D. M. Kammen, “Extreme typhoon events trigger long-lasting power outages and require demand-side solutions to enhance energy resiliency,” Commun. Earth Environ., Vol.6, Article No.136, 2025. https://doi.org/10.1038/s43247-025-02126-2
- [15] H. Kotani and K. Nakano, “Household resilience realized by photovoltaic and battery energy system in natural hazard-triggered blackouts: Evidence from Japan,” Int. J. Disaster Risk Reduct., Vol.90, Article No.103656, 2023. https://doi.org/10.1016/j.ijdrr.2023.103656
- [16] R. Tervo, I. Láng, A. Jung, and A. Mäkelä, “Predicting power outages caused by extratropical storms,” Nat. Hazards Earth Syst. Sci., Vol.21, No.2, pp. 607-627, 2021. https://doi.org/10.5194/nhess-21-607-2021
- [17] B. Jin, T. Zeng, S. Liu, Y. Li, L. Gui, B. Zhao, K. Yin, F. Catani, and D. Peduto, “Quantitative risk assessment for rainfall-induced landslides of transmission line towers: The case of Chongqing national transmission protection regions,” Int. J. Disaster Risk Reduct., Vol.128, Article No.105715, 2025. https://doi.org/10.1016/j.ijdrr.2025.105715
- [18] S. Saki, G. Sofia, B. Kar, and E. Anagnostou, “A multi-year analysis of the impact of heatwaves and compound weather events on power outages,” Sci. Rep., Vol.15, Article No.30846, 2025. https://doi.org/10.1038/s41598-025-15065-x
- [19] B. Wang, H. Shi, Y. L. Qiu, N. Deng, D. Nock, X. Shen, Z. Wang, and Y. D. Wang, “Unequal power outages induced by natural disasters,” Nature Comm., Vol.16, Article No.8947, 2025. https://doi.org/10.1038/s41467-025-64012-x
- [20] The Federation of Electric Power Companies of Japan (FEPC), “Power outage information and electricity supply and demand information for each region,” (in Japanese). https://www.fepc.or.jp/sp/bousai/link.html [Accessed March 27, 2026]
- [21] Hokkaido Electric Power Network, Inc., “Power outage information,” (in Japanese). https://teiden-info.hepco.co.jp/ [Accessed March 27, 2026]
- [22] Tohoku Electric Power Network Co., Inc., “Power outage information,” (in Japanese). https://nw.tohoku-epco.co.jp/teideninfo/ [Accessed March 27, 2026]
- [23] TEPCO Power Grid, Inc., “Power outage information,” (in Japanese). http://teideninfo.tepco.co.jp/ [Accessed March 27, 2026]
- [24] Chubu Electric Power Grid Co., Inc., “Power outage information,” (in Japanese). https://teiden.powergrid.chuden.co.jp/p/ [Accessed March 27, 2026]
- [25] Hokuriku Electric Power Transmission & Distribution Company, “Power outage information,” (in Japanese). https://www.rikuden.co.jp/nw/teiden/otj010.html [Accessed March 27, 2026]
- [26] Kansai Transmission and Distribution, Inc., “Power outage information,” (in Japanese). https://www.kansai-td.co.jp/teiden-info/index.php [Accessed March 27, 2026]
- [27] Chugoku Electric Power Transmission & Distribution Co., Inc., “Power outage information,” (in Japanese). https://www.teideninfo.energia.co.jp/LWC39100.html [Accessed March 27, 2026]
- [28] Shikoku Electric Power Transmission & Distribution Company, Inc., “Power outage information,” (in Japanese). https://www.yonden.co.jp/nw/teiden-info/ [Accessed March 27, 2026]
- [29] Kyushu Electric Power Transmission and Distribution Co., Inc., “Power outage information,” (in Japanese). https://www.kyuden.co.jp/td_teiden/kyushu.html [Accessed March 27, 2026]
- [30] The Okinawa Electric Power Company, Inc., “Power outage information,” (in Japanese). https://www.okidenmail.jp/bosai/info/index.html [Accessed March 27, 2026]
- [31] Japan Meteorological Agency (JMA), “Automated meteorological data acquisition system (AMeDAS).” https://www.jma.go.jp/jma/en/Activities/amedas/amedas.html [Accessed March 27, 2026]
- [32] Y. Makihara, “A method for improving radar estimates of precipitation by comparing data from radars and raingauges,” J. Meteor. Soc. Japan. Ser. II, Vol.74, No.4, pp. 459-480, 1996. https://doi.org/10.2151/jmsj1965.74.4_459
- [33] Japan Meteorological Agency (JMA), “JMA weather chart,” (in Japanese). https://www.data.jma.go.jp/yoho/wxchart/archive/index.html [Accessed March 27, 2026]
- [34] Japan Meteorological Agency (JMA) / RSMC Tokyo-Typhoon Center, “RSMC Best Track Data.” https://www.jma.go.jp/jma/jma-eng/jma-center/rsmc-hp-pub-eg/besttrack.html [Accessed March 27, 2026]
This article is published under a Creative Commons Attribution-NoDerivatives 4.0 Internationa License.