
Paper:
Influence of Surface Layer Permeability on Ground Liquefaction Strength During Long-Duration Motions
Yohsuke Kawamata*,†, Kazuhiro Tsurugasaki**, Junji Miyamoto**, and Hikaru Ito**
*Department of Urban Disaster Resilience Engineering, National Research Institute for Earth Science and Disaster Resilience (NIED)
1501-21 Nishikameya, Mitsuda, Shijimicho, Miki, Hyogo 673-0515, Japan
†Corresponding author
**Toyo Construction Co., Ltd.
Nishinomiya, Japan

Conventional assessments of soil liquefaction risk are based on simplified methods using penetration test results. In this approach, soil density is estimated from penetration resistance, and liquefaction strength is calculated based on the estimated soil density. However, this method primarily evaluates risks associated with excess pore water pressure build-up during an earthquake and does not account for changes in water pressure caused by the movement of pore water during and after the earthquake. It is anticipated these effects will be significant when an impermeable layer exists at or below the ground surface, or when long duration seismic motion occurs. Considering the above, two cases of geotechnical centrifugal model tests with and without impermeable surface layer were performed to evaluate its influence on the liquefaction behaviors of soil strata. Long duration sinusoidal motions of various intensities were applied to the specimens. Based on the test results, the surface layer permeability had a significant influence on pore water pressure buildup in the liquefiable strata beneath the surface layer, especially in the shallower portion of the soil. In addition, by plotting the relationships between response accelerations and excess pore water pressure, the liquefaction strength of the ground was assessed. These relationships showed a high potential for evaluating the liquefaction strength of “geo-structures,” and consider not only the properties of “geo-material” determined from cyclic triaxial tests but also the influence of surface layer permeability. Defining the geo-structural liquefaction strength under various conditions is expected to lead to the establishment of a more reasonable method for assessing soil liquefaction risk.
1. Introduction
In past earthquake disasters, soil liquefaction has caused severe damage to structures. Ambitious studies on liquefaction, including full-scale shaking table tests (e.g., 1), have been conducted with the aim of mitigating liquefaction-induced damage, and have yielded significant progress. Among past earthquakes, the 2011 off the Pacific coast of Tohoku earthquake induced notable damage due to ground liquefaction in wide areas, especially along Tokyo Bay 2. In this ocean trench earthquake, the motions observed around the Tokyo Bay area did not have particularly large accelerations, but continued for an extended time. Ground liquefaction results from the accumulation of excess pore water pressure and the liquefaction strength of soil are evaluated based on results from undrained cyclic triaxial tests in all current design standards (e.g., 3,4,5). This design approach is summarized in elsewhere 6. It is important to note that the current standards do not take the dissipation of pore water during earthquake motion into consideration. Because excess pore water pressure has built up almost instantly, within a couple of large motion cycles, in past major near-field earthquake events such as the 1995 southern Hyogo Prefecture earthquake, it is reasonable to assume that pressure dissipation is insignificant for pore water accumulated in such a short time. However, it is likely that a long-duration motion having relatively low acceleration can induce gradual increases in excess pore water pressure, taking a considerably long time to reach complete liquefaction. In this case, pressure dissipation during motion likely plays an important role in the occurrence of liquefaction; that is, pressure builds up only when it is increasing faster than it is dissipating. In addition, it is possible that ground settlement due to drainage of pore water during motion also needs to be considered in a reasonable evaluation of structural damage on the ground.
A series of cyclic triaxial compression tests of sand under controlled, partially drained conditions were conducted 7. Using their results, liquefaction potential in a case with a thin, silty subsurface layer was assessed. They concluded that liquefaction risk drops under well-drained conditions and even a thin low permeability layer may have a significant influence on liquefaction occurrence. Centrifugal model tests on thin liquefiable strata using pore fluids with various viscosities were performed 8. As the viscosity of the pore fluid decreased and apparent permeability rose, the liquefiable layer showed higher liquefaction strength. Another series of cyclic triaxial compression tests was performed under partially drained, undrained, and drained conditions 9. Soil in the field is not under either an ideal drained or undrained condition, and its stiffness depends on the degree of drainage. Numerical single-element analyses using the results of cyclic triaxial compression tests under various drainage conditions were conducted 10. They concluded that the inflow of pore water under partially drained conditions lowers liquefaction strength.
Element tests and numerical analyses have mainly been performed to obtain a better understanding of liquefaction-induced instability, settlement and lateral spreading by investigating volume changes due to the inflow and outflow of pore fluid after shaking. The relationship between volumetric strain after liquefaction and the safety factor against liquefaction was assessed 11. The amount of liquefaction-induced settlement was evaluated based on the difference between the maximum and minimum densities 12. A series of cyclic triaxial compression tests with controlled pore water inflows were performed 13. Their results indicated that upward pore water inflow generated significantly large shear strain resulting in flow failure. Some research has also focused on volume change due to pore fluid flow during shaking. For instance, cyclic triaxial compression tests under controlled partially drained conditions were conducted 14. It was concluded that a sand sample that is stable under undrained conditions becomes unstable even if volumetric expansion due to the inflow of pore fluid is extremely minor. Numerical analyses were performed to assess liquefaction-induced damage in port facilities with and without considering the effects of pore water drainage during earthquake motion 15. It indicated that responses of the structures differ under the two scenarios. A chamber in the ground for a series of centrifuge tests was placed and the flow of pore water was controlled 16. They concluded that a flow of pore fluid toward the ground surface during motion induced large settlement, and therefore, the undrained condition, which is the conventional assumption for liquefaction assessment, is unrealistic for liquefaction phenomena in actual field conditions.
Based on the above studies, it is obvious that pore water flow and drainage conditions have considerable influence on liquefaction, liquefaction-induced settlement and ground deformation. However, a simplified approach for assessing liquefaction-induced risk with careful consideration of the influence of drainage conditions needs to be established, especially for long duration motions in possible future ocean trench earthquake events, such as the expected Nankai megathrust earthquake in Japan. Considering this, two centrifugal model tests were performed using test specimens with different surface layers, one with an unsaturated permeable layer and the other with an impermeable layer. The aim was to gain a better understanding of the effect of surface layer permeability on liquefaction. Long duration sinusoidal motions were applied to the specimens. In this paper, fundamental information of the tests including dimensions and specifications of the test specimens and input excitations are described first. Then, the test results for two cases with different permeable conditions are compared. Based on the comparison, influence of surface layer drainage conditions on the liquefaction process are discussed.
2. Experimental Procedure
2.1. Testing Device
A geotechnical centrifuge device belonging to Toyo Construction Co., Ltd. was used in this study. The device, which has a 2.2 m rotation radius, is equipped with a shaking table working under centrifugal acceleration. Its payload is 250 kg and the maximum centrifugal acceleration is 250 g. Its dynamic strain data acquisition system has 30 channels in a wireless LAN for collecting measurements. This device has been used for various kinds of research 17,18. In this study, the test specimen for each case was loaded into a soil container, placed on the platform and tested under 50 g centrifugal acceleration.
2.2. Test Specimens
Figure 1 illustrates the test setup for the two experimental cases. Case 1 had no impermeable surface layer and Case 2 had an impermeable surface layer. The inner dimensions of the soil container were 550 mm (W) \(\times\) 400 mm (H) \(\times\) 150 mm (D). The test specimens were composed of a 200 mm thick liquefiable sand layer, a 50 mm thick surface layer and a weight placed at the center on the ground surface. Silica sand #6 (\({e_{\mathrm{min}}=0.569}\), \({e_{\mathrm{max}}=0.934}\)) was used for the test ground. The first 200 mm of the test specimen from the bottom of the container, was produced using the air pluviation method and had a relative density of 50% (\({\gamma _{t}=14.9}\) kN/m\(^3\), \({\gamma'=9.24}\) kN/m\(^3\)). Subsequently, the test specimen was saturated with de-aerated viscous fluid in a centrifugal field. After removing free water above the ground surface in a 1 g field, a 50 mm-thick surface soil layer was created on top of it in Case 1. Since this surface soil layer is not completely dry due to capillary rise effects, it is defined here as unsaturated soil. For Case 2, a 50 mm thick PVC plate (section dimensions: 520 mm (W) \(\times\) 145 mm (D), weight (\(W_1\)): 72.3 N, \({\gamma=19.2}\) kN/m\(^3\)) was placed on the 200 mm thick liquefiable sand layer as an impermeable surface layer. There were concerns in constructing an impermeable layer on low-permeability clay soil that significant settlement would occur in the structure model as the centrifuge accelerated. To prevent this, PVC plate was used in this experiment, even though this creates extremely impermeable conditions compared to actual soil. 15 mm clearance was set up on both sides of the PVC surface layer in the shaking direction to control the saturation process because liquid for saturation could not be uniformly infiltrated if the test ground was fully impermeable. In addition, there was a gap approximately 2.5 mm wide on both sides of the PVC surface layer in the direction perpendicular to the shaking. The gap was filled with grease-infiltrated sponge, a flexible but impermeable material. These boundary treatments enable the PVC plate to settle with the liquefied soil. The liquefiable layers were saturated with Metolose solution to adjust the permeability of the soil under 50 g centrifugal acceleration. The weight represented a 2-story wooden house and its contact pressure (\(p\)) was adjusted to 19.0 kPa under 50 g centrifugal acceleration. Its sectional dimensions were 100 mm (W) \(\times\) 145 mm (D) and it weighed 5.5 N (\(W_2\)). In this paper, all the data except for time and frequency were converted to prototype scale.
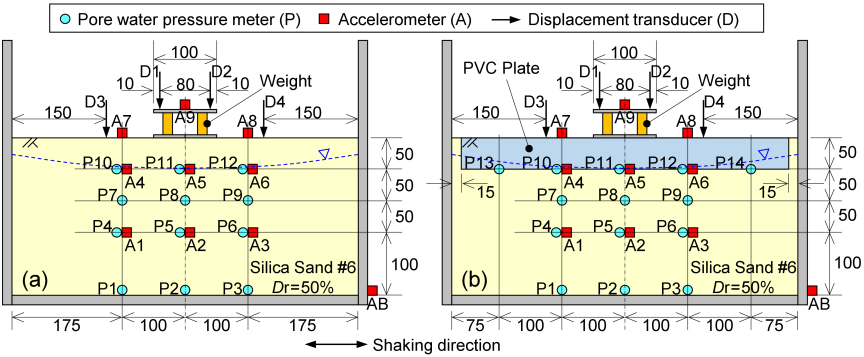
Fig. 1. Test setup: (a) Case 1 with unsaturated surface layer and (b) Case 2 with impermeable surface layer.
2.3. Input Excitation
Two cases of experiments were conducted by repeatedly applying excitation to a test specimen while gradually increasing the input level. After waiting for the excess pore water pressure and increase of settlement caused by the previous excitation level to reach zero, the next excitation was applied. The target input excitation used was a sinusoidal wave with tapered portions at its beginning and end as shown in Fig. 2. Its frequency was 50 Hz (1 Hz in prototype) and its duration was 1.2 s (1 min), including a 0.1-second taper-up phase and a 0.1-second taper-down phase.
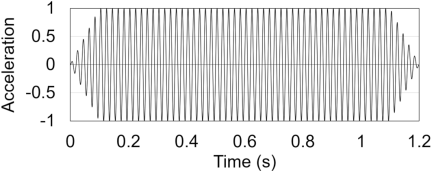
Fig. 2. Target input motion: 50 Hz sinusoidal wave with tapers at the beginning and end.
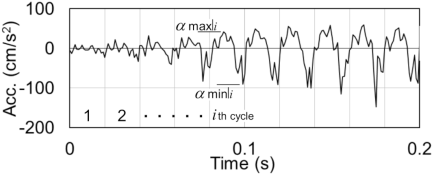
Fig. 3. Concept for calculating average acceleration.
Observed input motions recorded by accelerometer AB showed deviations between accelerations in the positive and negative directions (Fig. 3). Since the aim of this study is to develop a simplified evaluation method, although the input waveform is not a smooth sinusoidal wave, it will be evaluated as an equivalent sinusoidal motion. For each input excitation, average acceleration (\(\alpha_{\mathrm{ave}}\)) was calculated by
| Case 1 | Case 2 | |||
| Test No. |
Acceleration [cm/s\(^{2}\)] |
Test No. |
Acceleration [cm/s\(^{2}\)] |
|
| 1 | 16.3 | 1 | 25.5 | |
| 2 | 29.3 | 2 | 52.6 | |
| 3 | 89.6 | 3 | 93.6 | |
| 4 | 104.8 | 4 | 98.4 | |
| 5 | 124.1 | 5 | 140.7 | |
| 6 | 135.9 | 6 | 141.0 | |
| 7 | 184.8 | |||
Since the test specimen was subjected to multiple shaking, it is important to consider the effects of the shaking history such as densification and the rearrangement of soil particles when evaluating the experimental results. Fig. 4 shows the cumulative settlement measured after each shaking. In Case 1, no significant settlement occurred from shaking 1-1 to 1-6, but settlement progressed significantly after shaking 1-7. This implies that the effects of the shaking history are minor in Case 1. On the other hand, in Case 2, settlement has been progressing gradually from 2-3, suggesting that the excitation history has a major influence. Comparing D3 and D4, Case 2 ultimately resulted in a differential settlement of approximately 0.17 m; however, when converted to a inclination, this is approximately 0.8°, suggesting that the impact of ground surface inclination on the experimental results is minor.
Additionally, the influence of an impermeable layer at the ground surface has been indicated that once full liquefaction occurs, the density of the deeper portion of the liquefied layer increases, while the density of the shallower portion decreases 19. Since it is possible that the repeated shaking loosened the shallow layer in Case 2, making it more susceptible to liquefaction, careful interpretation of the data is required.
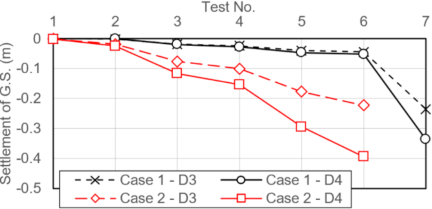
Fig. 4. Settlement of ground surface after each shaking.
3. Test Results and Discussions
3.1. Time Histories of Acceleration and Excess Pore Water Pressure Ratio
Test results for Cases 1-7 and 2-5 are compared here because significant excess pore water pressure buildup was observed in the entire liquefiable layer in these cases. The time histories of the acceleration recorded in the two cases are compared in Fig. 5. Sensor P11 malfunctioned and recorded no data during Case 2. The following observations are clear from the comparison: (1) Acceleration reduction due to ground liquefaction appeared in both cases. The reduction is more significant in Case 2-5 than in Case 1-7. This corresponds to higher excess pore water pressure recorded in Case 2-5. (2) Some of the acceleration time histories for Case 1-7 show drift components. This likely resulted from inclination of the accelerometers placed in the liquefied layer. (3) Except for sensor A2, all the responses at the same depth were similar at any location of the soil container until the acceleration reduction appeared. A2 recorded only about half the acceleration at A1 and A3, and the cause of this discrepancy is still unknown. The time histories, until the acceleration reduction or drift appeared, were used to calculate the average acceleration in the below data analysis. The records from A2 were not used, being deemed unreliable data.
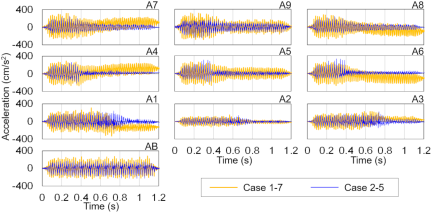
Fig. 5. Comparison of acceleration time histories.
Figure 6 compares the time histories of excess pore water pressure. The approach used to calculate effective overburden stress at each location is illustrated in Fig. 7. As shown in this figure, because the mechanisms by which the dead weight of the superstructure is transmitted to the ground differ between the two cases, and there is a difference in unit weight between the PVC plate and the unsaturated soil, there is a difference in the effective overburden stress of the soil between the two cases. Due to this difference, the liquefaction strength of the soil cannot be said to be strictly equivalent in the two cases, making it difficult to perform a quantitative evaluation based on a simple comparison of the experimental results. Therefore, this paper focuses on discussing qualitative tendencies.
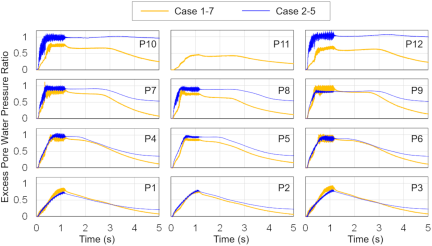
Fig. 6. Comparison of excess pore water pressure ratio time histories.
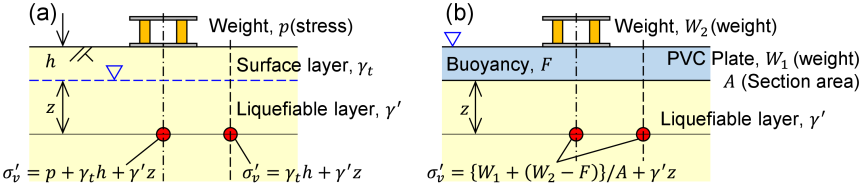
Fig. 7. Concept for calculating effective overburden stress: (a) Case 1 and (b) Case 2.
In Case 2, the water in the liquefiable layer flowed upward through the gap between the container and the PVC plate, and the water table appeared right above the ground surface while the centrifugal acceleration rose. Therefore, the water table was assumed to be at the ground surface to calculate the effective overburden stress in Case 2. As shown in Fig. 4, the ground has settled overall, and the installation depth of the pore water pressure sensors has changed accordingly; however, since the amount of settlement at the sensor locations is unidentified, the excess pore water pressure ratio in this paper was calculated using the initial overburden stress for convenience. Consequently, the excess pore water pressure ratio may vary to some extent, and interpretation of the results requires careful consideration. Moreover, if the calculated excess pore water pressure ratio exceeds 1.0, that ratio is defined as 1.0. As noted above, transducer P11 malfunctioned, so it recorded no data in Case 2. The following is drawn by this comparison: (1) In Case 2-5 the pore water pressure ratio was considerably higher than in Case 1-7 in the shallow parts of the ground. The difference decreased at larger depths. As shown in Fig. 4, although the settlement in the Case 2 test specimen had progressed due to the previous shaking, and the effects of repeat shaking must be taken into account, this result implies that the influence of drainage conditions may be more significant in the shallow layers of the soil. (2) The pore water pressure buildup was suppressed at the beginning of the shaking in Case 1-7, but progressed smoothly in Case 2-5. This implies that the permeable surface layer allows the pore water pressure around the water table to dissipate even during shaking. (3) In both cases, the pore water pressure dissipated proceeding from the deeper portion, and this took longer in Case 2-5 than in Case 1-7. This is because the impermeable surface layer hampered the pore water pressure dissipation.
3.2. Relationship Between Acceleration and Excess Pore Water Pressure Ratio
Figure 8 shows the relationship between the response accelerations and the maximum excess pore water pressure ratios measured by accelerometers and their adjacent pore water pressure transducers. The response accelerations are the average acceleration calculated by Eq. (1). This figure shows insignificant pore water pressure buildup in Case 1 when the response accelerations were below 150 cm/s\(^2\), and all the maximum pressure ratios other than a single exception were less than 0.2. However, the excess pore water pressure built up significantly when the response acceleration was greater than 170 cm/s\(^2\). This tendency was observed at all depths and is independent of the effective overburden stress. Furthermore, this result is consistent with the fact that, as shown in Fig. 4, the ground surface showed almost no settlement up to Case 1-6 but settled significantly in Case 1-7. On the other hand, considerable excess pore water pressure buildup was observed in Case 2 even when the acceleration was less than 50 cm/s\(^2\), and tended to be proportional to the response acceleration. It is significant that the shallow soil layer at G.L. \(-\)2.5 m reached complete liquefaction when the input acceleration in Case 2-3 was less than 100 cm/s\(^2\). In the cases where full liquefaction had already occurred in the previous shaking (Cases 2-4 and 2-5), simple comparisons are difficult because soil particle rearrangement takes place and the effects of repeated excitation become considerable; however, even when comparing only the tendencies leading up to full liquefaction, a remarkable difference can be observed between Case 1 and Case 2. This indicates that, particularly in the shallow layers, the drainage conditions of the surface layer have a significant impact on the increase in pore water pressure. These significant differences between Cases 1 and 2 indicate that the drainage condition of the surface layer has considerable influence on the liquefaction strength of the ground, especially in the shallower portions. In addition, the complete liquefaction observed in Case 2 during small motion implies that pore water flowed from the deeper to the shallower portion of the ground and became trapped beneath the impermeable surface layer, enabling liquefaction. This indicates that pore water pressure builds up more than occurs in cyclic triaxial tests under undrained conditions described in the literature 10 which had no inflow of pore water. Therefore, undrained cyclic triaxial tests may overestimate liquefaction strength of ground with an impermeable surface layer.
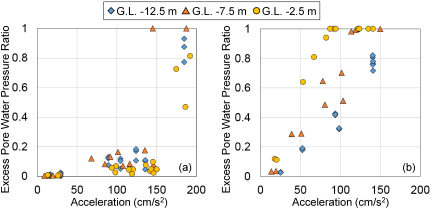
Fig. 8. Average acceleration versus maximum pore water pressure ratio: (a) Case 1 and (b) Case 2.
Comparisons between Case 1 and Case 2 at each depth are shown in Fig. 9. These figures show that the difference between the cases is relatively small at large depths and increases at smaller depths, indicating that the influence of the surface layer drainage condition is more significant near the surface. This implies that a well-permeable surface layer has a large potential to mitigate liquefaction-induced damage of superstructures because damage done to them on liquefiable ground is highly dependent on the liquefaction intensity in the shallower portions of the ground 20.
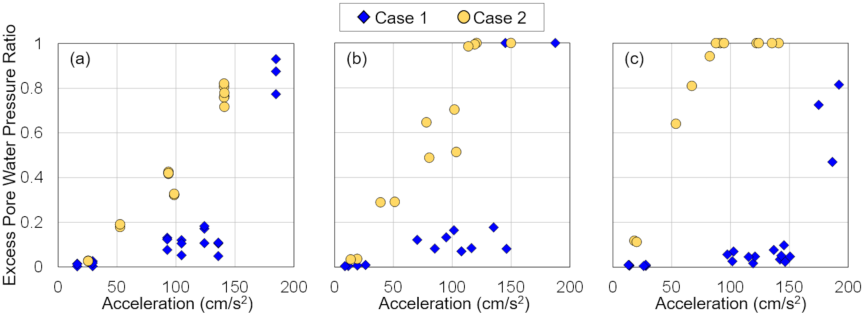
Fig. 9. Acceleration-pore water pressure ratio relationship comparison between Cases 1 and 2 at depths of (a) G.L. \(-12.5\) m, (b) G.L. \(-7.5\) m, and (c) G.L. \(-2.5\) m.
3.3. Profiles of Excess Pore Water Pressure Ratio
Profiles of excess pore water pressure ratios in Cases 1-7 and 2-5 are shown in Figs. 10 and 11, respectively. Because the duration of the input motion was 1.2 s, it is defined the pressure accumulation phase as the time up to 1.2 s and the pressure dissipation phase as occurring after that. From Fig. 10, it is found that the excess pore water pressure rose only to approximately 0.5 at a depth of G.L. 2.5 m and the maximum ratio appeared at G.L. \(-7.5\) m deep in Case 1-7. The rate of the excess pore water pressure buildup was relatively small, and the maximum ratio was less than 0.4 even at 0.7 s. In addition, the pore water pressure ratio dissipated promptly, dropping to approximately 0.2 at 5 s. On the other hand, the excess pore water pressure was greater at smaller depths, and the maximum ratio always appeared at a depth of G.L. \(-2.5\) m in Case 2-5. The pressure built up relatively quickly, and the ratio rose to about 0.9 at 0.7 s. In the dissipation phase, the pressure went down very slowly, and the ratio was approximately 0.8 even at 10 s.
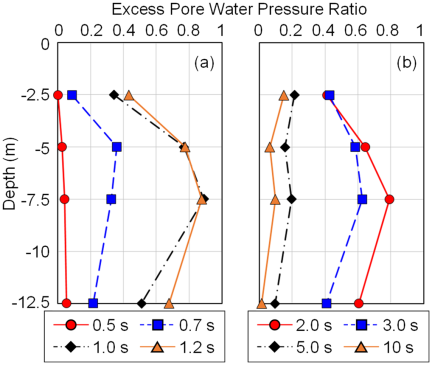
Fig. 10. Profiles of pore water pressure (Case 1-7) (a) in accumulation phase and (b) in dissipation phase.
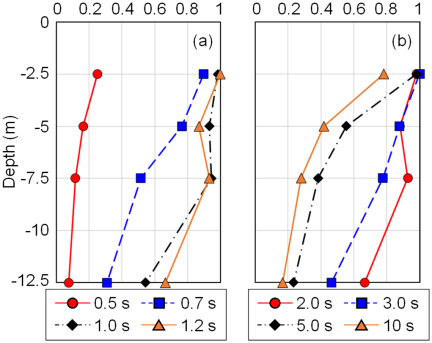
Fig. 11. Profiles of pore water pressure (Case 2-5) (a) in accumulation phase and (b) in dissipation phase.
Based on the above, ground with an impermeable surface layer appears to be more liquefiable and keeps its high excess water pressure ratio for longer than ground with a permeable surface. If the interval between a main shock and a large aftershock is quite short, the aftershock is likely to excite the ground before the pore water pressure is completely dissipated. Furthermore, due to the influence of the impermeable layer at the ground surface, it is likely that the sedimentation rate of soil particles after liquefaction may decrease as high excess pore water pressure remains for extended durations, resulting in relatively loose deposition. Therefore, these continuous motions need to be considered as coupled, not as independent excitations, and the liquefaction characteristics of ground with undissipated pressure need to be reasonably assessed in design practice and liquefaction risk evaluation, especially where there is an impermeable surface layer.
3.4. Relationship Between Excess Pore Water Pressure and Settlement
Figures 12 and 13 show the relationship between excess pore water pressure, the settlement of the weight and that of the ground surface in Cases 1-7 and 2-5, respectively. In Case 1-7, the weight and ground surface settled an average of approximately 70 cm and 24 cm, respectively. The settlement of the weight was much larger than the settlement of the ground surface. On the other hand, the settlements of the weight and ground surface averaged approximately 13 cm and 11 cm in Case 2-5, respectively. This is because the PVC plate, placed as the impermeable surface layer, provided a more uniform distribution of the overburden stress to the liquefiable layer. A comparison of Case 2-5 and Case 1-7 indicates that, despite a larger increase in excess pore water pressure in the former, settlement of the ground surface was smaller. As shown in Fig. 4, in Case 1, full liquefaction was first reached in Case 1-7, resulting in a significant increase in settlement; however, in Case 2, the shallow layers reached full liquefaction in Case 2-3, and repeated liquefaction occurred in Cases 2-4 and 2-5. As a result, settlement has been gradually accumulating since Case 2-3. Therefore, it is considered that the settlement in Case 2-5 was smaller than in Case 1-7 because the volumetric strain caused in the shaking is reduced due to residual shear strain in the ground liquefied in the previous shaking and densification during repeated excitation 21,22.
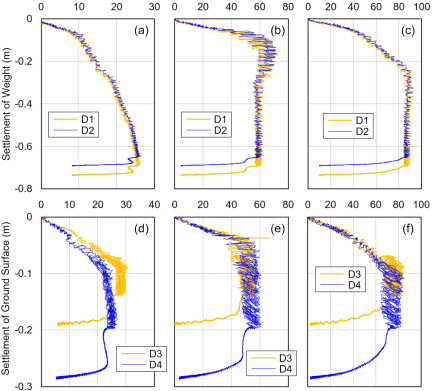
Fig. 12. Relationship between settlement of weight (D1 and D2), ground surface (D3 and D4), and excess pore water pressure (Case 1-7) at depths of (a) G.L. \(-2.5\) m (P11), (b) G.L. \(-5.0\) m (P8), (c) G.L. \(-7.5\) m (P5), (d) G.L. \(-2.5\) m (P10 or P12), (e) G.L. \(-5.0\) m (P7 or P9), and (f) G.L. \(-7.5\) m (P4 or P6).
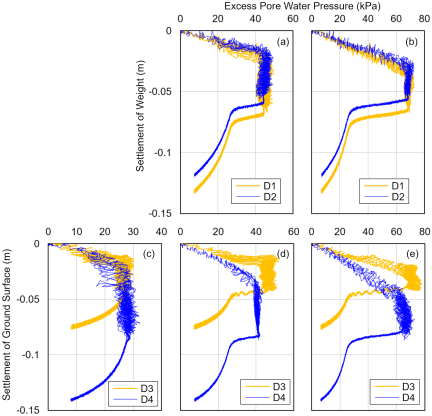
Fig. 13. Relationship between settlement of weight (D1 and D2), ground surface (D3 and D4), and excess pore water pressure (Case 2-5) at depths of (a) G.L. \(-5.0\) m (P8), (b) G.L. \(-7.5\) m (P5), (c) G.L. \(-2.5\) m (P10 or P12), (d) G.L. \(-5.0\) m (P7 or P9), and (e) G.L. \(-7.5\) m (P4 or P6).
In Case 1-7, the weight settled gradually during shaking as the pore water pressure built up, and suddenly stopped settling at the beginning of the dissipation phase. On the other hand, the settlement of the ground surface also progressed gradually during shaking as the pore water pressure built up, but it continued settling even in the dissipation phase. At a depth of G.L. \(-7.5\) m, the settlement increased as the pore water pressure dissipated starting at the end of the shaking. On the other hand, at depths of G.L. \(-2.5\) m and \(-5\) m, the pore water pressure did not dissipate for a while after the shaking stopped. This indicates that the ground settled from the deeper to the shallower portions because the pore water moved upward through the shallower ground.
In Case 2-5, the weight and the ground surface settled during shaking as the excess pore water pressure built up. Except for Fig. 13(c), settlement at all the measured points paused even though the pore water pressure gradually decreased, and resumed after the pore water pressure dissipated to some extent. The pore water moved upward and the pressure dissipated from the deeper to the shallower portions of the ground, but the water was trapped beneath the impermeable surface layer and formed a water film 23. Therefore, it implies that settlement was suppressed until the water trapped under the impermeable surface layer drained through the gap between the PVC plate and the container wall.
Based on the above, it is concluded that the settlement of the weight representing a wooden house and the ground surface need to be evaluated not only due to volumetric strain after shaking as the pore water pressure dissipated, but also during shaking. Therefore, pressure dissipation during shaking and the duration of motion need to be carefully considered to reasonably estimate the settlement of a liquefiable stratum.
3.5. Liquefaction Strength Curve of Geo-Structure
The relationship between response acceleration level and the number of cycles taken for the excess pore water pressure ratio to reach 0.1, 0.3, 0.5, and 0.9 is shown in Fig. 14. Note that this figure also includes the effects of repeated excitation. The number of cycles is calculated by multiplying the time the average excess pore water pressure reached the above values (refer to Fig. 15) by the frequency of the input motion, 50 Hz in this study. In these charts, liquefaction strength is expressed in terms of possible excess pore water pressure buildup. The dashed lines parallel to the horizontal axis in the figures indicate response accelerations up to the height of the line did not cause the excess pore water pressure ratio to reach 0.1 in this series of tests. Because the charts for Case 2 have considerable numbers of the plotted points, trend curves for each level of pore water pressure buildup are also drawn in Figs. 14(d)–(f). For Case 1, it was difficult to plot trend curves because of a lack of data. These curves can be defined as the liquefaction strength of the “geo-structure,” including the influence of its drainage condition, not as the liquefaction strength of the “geo-material” determined from cyclic loading tests of soil elements. Theoretically, the curves for each level of pore water pressure should be closer for higher accelerations because pore water pressure builds up more quickly in larger excitations. More data are needed to prove these curves are reasonable, especially for large input motions. Based on Fig. 14, the follows are drawn: (1) More significant differences appeared at shallower depths when comparing the two cases. This indicates that the drainage condition has a larger influence in the shallower ground. (2) Even at a depth of G.L. \(-2.5\) m in Case 1 with the most significant influence of drainage condition, a considerable pore water pressure buildup was recorded when large motions were input. Based on this, it can be reasonably hypothesized that drainage condition effects become insignificant when large input motions induce instantaneous liquefaction. On the other hand, drainage condition effects are more obvious at small accelerations and for long duration motions. (3) Assuming that excess pore water pressure ratios of less than 0.1 are negligible, there is threshold level of response acceleration that induces inconsequential pore water pressure buildup. When the response acceleration is less than this threshold, pore water pressure does not build up even in an infinite number of cycles. Because, for instance, the threshold levels at G.L. \(-2.5\) m were 150 cm/s\(^2\) in Case 1 and almost zero in Case 2, it is obvious that the level depends significantly on the ground’s drainage condition. This is likely due to the balance between the rates of pore water pressure accumulation and dissipation. (4) By plotting the relationship between response acceleration and number of cycles, the liquefaction strength of the “geo-structure,” including the influence of drainage conditions and motion duration can be defined. By conducting experiments under various conditions and accumulating the liquefaction strength curves of “geo-structures,” it becomes possible to assess liquefaction risk with greater accuracy based on the magnitude and duration of the input seismic motion.
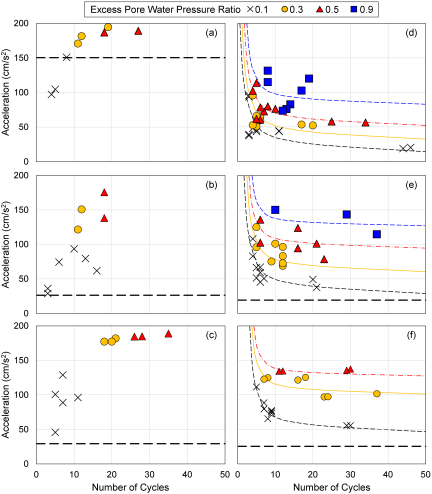
Fig. 14. Liquefaction strength of test ground at given depths. Case 1: (a) G.L. \(-2.5\) m, (b) G.L. \(-7.5\) m, and (c) G.L. \(-12.5\) m; Case 2: (d) G.L. \(-2.5\) m, (e) G.L. \(-7.5\) m, and (f) G.L. \(-12.5\) m.
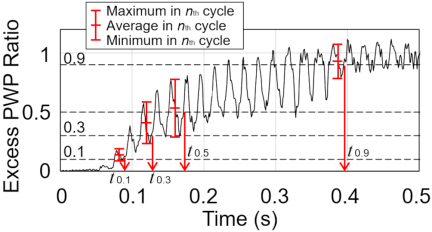
Fig. 15. Definition of times when excess pore water pressure ratio reached 0.1, 0.3, 0.5, and 0.9.
4. Conclusions
A series of centrifugal liquefaction model tests with permeable and impermeable surface layers was performed by applying long duration motions to obtain acceleration, settlement, and pore water pressure records under different drainage conditions. The data obtained were used to assess the effects of drainage on the soil liquefaction process and settlement of a structure and the ground surface. Based on the tests results, the follows were drawn:
(1) In the case with a permeable surface layer, excess pore water pressure buildup was insignificant for small input motions, but it suddenly became considerable when the input motion was beyond a certain value. On the other hand, in the case with an impermeable surface, considerable pore water pressure built up even for small accelerations and was almost proportional to the intensity of input excitations. This difference indicates that drainage through the surface layer suppresses the accumulation of pore water pressure. In addition, pore water pressure buildup right below the impermeable layer for even small motions implies that inflow of pore water from the deeper to the shallower portion of the ground contributes to this pressure accumulation.
(2) In the case with a permeable surface layer, the maximum pore water pressure ratio appeared in the middle of the liquefiable layer because of restrained excess pore water pressure buildup around the water table. However, higher excess pore water pressure ratios appeared at shallower levels in the case with an impermeable surface layer. However, in this study, since the shallower soil layers have undergone liquefaction several times due to repeated excitation, it is necessary to take this effect into account in order to conduct a quantitative comparison. At large depths, the pore water pressure ratios in both cases were similar, indicating that the permeability of the surface layer has a larger influence in shallower ground.
(3) A weight representing a wooden house and the ground surface settled considerably during shaking and the settlement continued while the excess pore water pressure dissipated after the shaking stopped. Therefore, both the drainage condition and shaking duration need to be carefully considered to reasonably evaluate settlement of structures and the ground surface.
(4) By plotting the relationship between intensity of pore water pressure buildup and number of cycles, it is found that there is a threshold level of acceleration below which the excess pore water pressure is insignificant even when the duration of the motion is considerably long. The threshold level and the liquefaction strength of the ground are both highly dependent on the drainage condition; that is, the shaking level that causes no concern and the liquefaction strength are both higher with better drainage. In addition, the liquefaction strength of the ground, including the effects of drainage conditions and motion duration can be defined from the relationships. By utilizing the liquefaction strength of the ground, it becomes possible to make simplified assessment of liquefaction risk by considering the magnitude and duration of potentially occurring earthquakes.
- [1] R. Motamed, I. Towhata, T. Honda, K. Tabata, and A. Abe, “Pile group response to liquefaction-induced lateral spreading: E-Defense large shake table test,” Soil Dyn. Earthq. Eng., Vol.51, pp. 35-46, 2013. https://doi.org/10.1016/j.soildyn.2013.04.007
- [2] S. Yasuda, I. Towhata, I. Ishii, S. Sato, and T. Uchimura, “Liquefaction-induced damage to structures during the 2011 Great East Japan Earthquake,” J. JSCE, Vol.1, No.1, pp. 181-193, 2013. https://doi.org/10.2208/journalofjsce.1.1_181
- [3] The Overseas Coastal Area Development Institute of Japan, “Technical standards and commentaries for port and harbour facilities in Japan,” 2009.
- [4] Japan Road Association, “Specifications for highway bridges: Part V seismic design,” 2016.
- [5] Architectural Institute of Japan, “Recommendations for design of building foundations,” 2019 (in Japanese).
- [6] K. Ishihara, “Liquefaction and flow failure during earthquakes,” Geotechnique, Vol.43, No.3, pp. 351-451, 1993. https://doi.org/10.1680/geot.1993.43.3.351
- [7] Y. Umehara, K. Zen, and K. Hamada, “Evaluation of soil liquefaction potentials in partially drained conditions,” Soils Found., Vol.25, No.2, pp. 57-72, 1985. https://doi.org/10.3208/sandf1972.25.2_57
- [8] M. Okamura, T. H. Abdoun, R. Dobry, M. K. Sharp, and V. M. Toboada, “Effects of sand permeability and weak aftershocks on earthquake-induced lateral spreading,” Soils Found., Vol.41, No.6, pp. 63-77, 2001. https://doi.org/10.3208/sandf.41.6_63
- [9] Y. P. Vaid and A. Eliadorani, “Undrained and drained (?) stress-strain response,” Can. Geotech. J., Vol.37, No.5, pp. 1126-1130, 2000. https://doi.org/10.1139/t00-036
- [10] R. Kamai and R. W. Boulanger, “Single-element simulations of partial-drainage effects under monotonic and cyclic loading,” Soil Dyn. Earthq. Eng., Vol.35, pp. 29-40, 2012. https://doi.org/10.1016/j.soildyn.2011.10.002
- [11] K. Ishihara and M. Yoshimine, “Evaluation of settlements in sand deposits following liquefaction during earthquakes,” Soils Found., Vol.32, No.1, pp. 173-188, 1992. https://doi.org/10.3208/sandf1972.32.173
- [12] K. Ishihara, K. Harada, W. F. Lee, C. C. Chan, and A. M. M. Safiullah, “Post-liquefaction settlement analyses based on the volume change characteristics of undisturbed and reconstituted samples,” Soils Found., Vol.56, No.3, pp. 533-546, 2016. https://doi.org/10.1016/j.sandf.2016.04.019
- [13] N. Sento, M. Kazama, R. Uzuoka, H. Ohmura, and M. Ishimaru, “Possibility of postliquefaction flow failure due to seepage,” J. Geotech. Geoenviron. Eng., Vol.130, No.7, pp. 707-716, 2004. https://doi.org/10.1061/(ASCE)1090-0241(2004)130:7(707)
- [14] Y. P. Vaid and A. Eliadorani, “Instability and liquefaction of granular soils under undrained and partially drained states,” Can. Geotech. J., Vol.35, No.6, pp. 1053-1062, 1998. https://doi.org/10.1139/t98-061
- [15] J. Wang, M. Sato, N. Yoshida, H. Kurose, and K. Ozeki, “Liquefaction analysis of seawall structures under both drained and undrained conditions,” 12th World Conf. Earthq. Eng. (WCEE), 2000.
- [16] O. Adamidis and S. P. G. Madabhushi, “Experimental investigation of drainage during earthquake-induced liquefaction,” Geotechnique, Vol.68, No.8, pp. 655-665, 2018. https://doi.org/10.1680/jgeot.16.P.090
- [17] H. Akamoto, M. Miyake, M. Wada, and A. Murayama, “Liquefaction of the ground reclaimed by urban refuse ash,” Proc. Int. Conf. Centrifuge 94, pp. 251-255, 1994.
- [18] T. Satoh, K. Tsurugasaki, T. Nagata, and M. Miyake, “Deformation of caisson type quay wall during earthquake,” Proc. Int. Conf. Centrifuge 98, pp. 339-344, 1998.
- [19] National Research Council, “Liquefaction of soils during earthquakes,” The National Academies Press, 1985. https://doi.org/10.17226/19275
- [20] Architectural Institute of Japan, “Recommendations for design of small building foundations,” 2008 (in Japanese).
- [21] N. Sento, M. Kazama, and R. Uzuoka, “Experiment and idealization of the volumetric compression characteristics of clean sand after undrained cyclic shear,” J. JSCE, Vol.2004, No.764, pp. 307-317, 2004 (in Japanese). https://doi.org/10.2208/jscej.2004.764_307
- [22] T. Unno, N. Sento, Y. Ono, and K. Hayashi, “A method for evaluating volumetric strain resulting from liquefaction of sandy soil based on cyclic shear strain history,” J. Jpn. Soc. Civ. Eng., Ser. C (Geosph. Eng.), Vol.68, No.4, pp. 680-694, 2012 (in Japanese). https://doi.org/10.2208/jscejge.68.680
- [23] T. Kokusho, “Current state of research on flow failure considering void redistribution in liquefied deposits,” Soil Dyn. Earthq. Eng., Vol.23, No.7, pp. 585-603, 2003. https://doi.org/10.1016/S0267-7261(03)00067-8
This article is published under a Creative Commons Attribution-NoDerivatives 4.0 Internationa License.