Survey Report:
Downscaled Climate Projections for Rainfall Extremes and Drought in Pampanga River and Pasig-Marikina-Laguna-Lake Basin
Ralph Allen E. Acierto*,†
 , Tomoki Ushiyama*
, Patricia Ann Jaranilla-Sanchez**, and Miho Ohara*,***
, Tomoki Ushiyama*
, Patricia Ann Jaranilla-Sanchez**, and Miho Ohara*,***
*International Centre for Water Hazard and Risk Management (ICHARM), Public Works Research Institute (PWRI)
1-6, Minamihara, Tsukuba, Ibaraki 305-8516, Japan
†Corresponding author
**University of the Philippines Los Baños
Los Baños, Philippines
***The University of Tokyo
Tokyo, Japan

The Philippines is one of the most climate-vulnerable countries in the world, with Central Luzon often experiencing extreme rainfall, floods, and droughts that are expected to worsen with ongoing warming. Using regional evidence from CORDEX–SEA (CMIP5) and CMIP6 multi-model ensembles, which show stronger rainfall extremes across Southeast Asia, this study produces basin-scale projections for the Pampanga River Basin and the Pasig-Marikina-Laguna-Lake Basin. High-resolution (5 km) climate projections were created with the Weather Research and Forecasting (WRF) model, dynamically downscaled from MRI-AGCM 3.2H (60 km) and 3.2S (20 km), and bias-corrected using the quantile-mapping method. The study analyzed projected changes in seasonal rainfall, heavy-rainfall indices (≥50 mm/day; 95th–99th percentiles), drought indicators (CDD, CWD), and design rainfall (from annual maxima) under RCP2.6 and RCP8.5 scenarios. The results show a clear intensification of heavy rainfall in both basins, especially during the southwest monsoon and under RCP8.5, with annual-maximum rainfall distributions indicating a consistent rise in extreme values and higher design rainfall for all return periods. Spatial patterns vary by basin: Pampanga has the largest increases in the lower western catchment, while the Pasig-Marikina-Laguna-Lake Basin shows a more uniform increase across the basin. At the same time, more consecutive dry days (CDD) and fewer consecutive wet days (CWD) suggest increased hydroclimatic variability, with wetter wet seasons and drier dry periods. These basin-specific, bias-corrected projections offer physically consistent data for flood and drought hazard assessment, agricultural and economic modeling, and climate-resilient water infrastructure design.
Projected design-rainfall change factors
1. Introduction
The Philippines ranks among the most climate-vulnerable nations globally, frequently affected by extreme rainfall, floods, and droughts that are projected to intensify under global warming scenarios 1. With increasing urbanization and exposure in flood-prone areas such as the Pampanga River Basin and the Pasig-Marikina-Laguna-Lake Basin, understanding projected rainfall changes is essential for anticipating future hydroclimatic risks. The country has already observed a rise in high-intensity rainfall and longer dry periods 2, consistent with global projections of intensified hydrological extremes. However, rainfall projection studies at local scales remain limited, and most infrastructure planning still relies on historical climatology.
At the regional scale, multi-model regional climate simulations from the CORDEX–SEA ensemble, driven by CMIP5 global climate models (GCMs), present a consistent view of rainfall intensification across Southeast Asia. Tangang et al. 3 and Supari et al. 4 reported that under RCP4.5 and RCP8.5 scenarios, rainfall extremes (RX1day, RX5day, R95p, and R20mm) are projected to increase by 20%–40% over the Philippines and northern Borneo, accompanied by longer dry spells (higher CDD), indicating a shift toward shorter but more intense wet seasons. These findings identify the Philippines as a regional hotspot for future heavy rainfall events. In a complementary approach, Ito et al. 5 showed that the Meteorological Research Institute Atmospheric General Circulation Model (MRI-AGCM), multi-SST ensemble reproduces land precipitation climatology across Southeast Asia with higher spatial fidelity than the CMIP5 multi-model ensemble and projects robust increases in both mean and extreme rainfall toward the late 21st century, particularly across the Maritime Continent, consistent with an intensified monsoon circulation. Using CMIP6 ensembles, Ge et al. 6 further confirmed widespread intensification of precipitation extremes across Southeast Asia, with strong inter-model agreement for the Philippines and Luzon subregion—showing increases in total wet-day rainfall and short-duration extremes alongside a rise in consecutive dry days. More recently, Lin et al. 7 demonstrated that thermodynamic processes, primarily enhanced atmospheric moisture, account for roughly 75%–77% of the projected increases in Southeast Asian precipitation extremes, with dynamic effects further amplifying extremes in localized monsoon hotspots. Together, these studies indicate a consistent regional pattern of rainfall intensification, suggesting that Luzon and nearby areas of the Maritime Continent will experience more frequent and intense heavy-rainfall events, interspersed with longer dry periods under continued warming. Although these regional-scale experiments consistently show stronger and more variable rainfall regimes under future warming, their spatial resolutions (25 km 3,4, 20 km and 60 km 5, and 100–250 km 6,7) are not sufficient to capture the complex topography and mesoscale processes that influence rainfall over the Philippine archipelago. The interaction of monsoon flows, tropical cyclones, and orographic lifting across Luzon creates strong spatial heterogeneity that coarse-scale projections cannot fully represent. Therefore, basin-specific downscaling studies are necessary to translate regional signals into actionable local projections for water resource management and disaster risk reduction.
Several studies have assessed future rainfall in major Philippine basins using downscaled or bias-corrected climate projections. In the Pampanga River Basin, Jaranilla-Sanchez et al. 8 combined multiple GCM outputs with a hydrological model and projected increases in wet-season rainfall and flood peaks. Ushiyama et al. 9 used dynamically downscaled MRI-AGCM 3.2H/S data and found a 10%–30% rise in extreme rainfall frequency, especially in the upper basin. Using the same climate data sets, Gusyev et al. 10 reported stronger rainfall variability and short-duration extremes associated with ENSO events. Tolentino et al. 11 analyzed downscaled CMIP5 simulations and found intensified monsoon rainfall and higher runoff during the wet season. For the Pasig-Marikina-Laguna-Lake Basin, Monjardin et al. 12 used statistically downscaled HadCM3 data and projected a 15%–25% increase in monsoonal rainfall, while Robles and Monjardin 13 also showed that rainfall extremes are projected to become more erratic for the Angat Dam watershed, affecting reservoir inflows and drought occurrence.
Collectively, these studies show a consistent pattern of rainfall intensification across Central Luzon 8,9,10,11,12,13 and Southeast Asia 3,4,5,6,7. However, limitations in spatial resolution and inter-model consistency in rainfall projections remain, which highlight the need for high-resolution, physically based simulations.
This study addresses these gaps by using a regional climate model (RCM) forced by two high-resolution atmospheric global climate models (AGCMs) from the Meteorological Research Institute (MRI) 14 to generate dynamically downscaled climate projections for two critical river basins in Luzon. The 5-km downscaled projections are bias-corrected using the quantile-mapping (QM) method, following Ushiyama et al. 9. The climate change impact assessment on the 5-km rainfall projections examines projected changes in seasonal rainfall and rainfall extremes (\(\geq 50\) mm/day, 95th–99th percentiles, and return periods) under RCP2.6 and RCP8.5 scenarios. The results provide important insights into the future intensity and spatial distribution of rainfall in Luzon and support the integration of climate-informed design in flood control, water resources, and disaster risk management.
The objectives of this study are (1) to generate high-resolution (5 km) dynamically downscaled climate projections for the Pampanga River Basin and the Pasig-Marikina-Laguna-Lake Basin using the Weather Research and Forecasting (WRF) model driven by MRI-AGCM 3.2H and 3.2S outputs; (2) to evaluate projected changes in rainfall climatology, heavy rainfall indices (\(\geq 50\) mm/day, 95th and 99th percentiles), and drought indicators (CDD and CWD) under RCP2.6 and RCP8.5 scenarios; and (3) to estimate future design rainfall for multiple durations and return periods through frequency analysis of annual maximum rainfall. Beyond establishing localized climate projections, the outputs of this study are intended to support downstream impact modeling, including flood and drought hazard assessments, agricultural productivity simulations, and economic impact analyses. By providing basin-specific, bias-corrected climate information, this work supports climate-adaptive planning and disaster risk reduction strategies for these two critical river basins near Metro Manila.
2. Data and Methodology
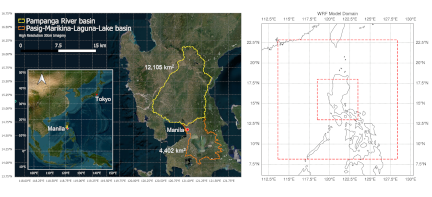
Fig. 1. Locations of the Pampanga River and Pasig-Marikina-Laguna-Lake Basins in the Philippines and the WRF model domain for 5-km downscaling of global climate projections.
2.1. Study Area Description
This study examines the Pampanga River Basin and the Pasig-Marikina-Laguna-Lake Basin, both located on Luzon Island, Philippines, as shown in Fig. 1. These basins are highly vulnerable to hydrometeorological hazards and are critical to the country’s agriculture, water resources, and urban infrastructure systems.
The Pampanga River Basin covers approximately 12,105 km\(^2\) in the Central Luzon region. It drains into Manila Bay and includes a broad alluvial floodplain with low elevations and flat terrain, especially in the lower areas. The basin also contains the Candaba Swamp, a seasonal wetland that helps retain floodwaters. In comparison, the Pasig-Marikina-Laguna-Lake Basin spans about 4,402 km\(^2\) in Metro Manila and nearby provinces. It includes Laguna de Bay (the largest lake in the Philippines), the Marikina River, and the Pasig River, which flows west into Manila Bay. This basin consists of both urban lowlands and hilly uplands, particularly within the Marikina watershed.
The Pampanga River Basin is primarily agricultural, with rice and sugarcane as the main crops, and is vulnerable to flooding and seasonal water shortages. The Pasig-Marikina-Laguna-Lake Basin is densely populated and highly urbanized, particularly in Metro Manila, which increases its risk of urban flooding during periods of extreme rainfall.
Both basins have a tropical monsoon climate, with a distinct wet season from May to October influenced by the southwest monsoon and frequent tropical cyclones, and a relatively dry season from November to April. Annual rainfall usually exceeds 2,000 mm, with significant year-to-year variation due to ENSO.
2.2. Climate Projections and Downscaling Approach
This study utilized climate projections from two versions of the MRI-AGCM 14,developed by the Japan Meteorological Agency. Recent global experiments with the MRI-AGCM multi-SST ensemble show that the model reproduces regional precipitation climatology with higher spatial accuracy than many CMIP5 models 5. In most tropical land areas, including Southeast Asia and the Maritime Continent, the MRI-AGCM projects increases in both mean and extreme rainfall toward the late 21st century, consistent with intensification of the Asian monsoon under global warming. The magnitude and spatial pattern of these projected increases closely match the multi-model CMIP5 ensemble, but with less inter-model variation, which indicates MRI-AGCM’s reliability for high-resolution rainfall projection studies in the region 5. In addition, a recent multi-model evaluation study 15 shows that MRI-AGCM3.2 reproduces seasonal-to-annual precipitation climatology and extreme-precipitation statistics as well as, or better than, a broad set of CMIP5/CMIP6 AMIP and HighResMIP atmospheric models, supporting its suitability for extreme-rainfall applications. MRI-AGCM3.2 is also among the highest-resolution global AGCM configurations in HighResMIP-class comparisons, which provides an advantage for resolving regional precipitation structures important for downscaling and basin-scale hazard assessment.
We used two versions of MRI-AGCM 3.2, which were further refined through downscaling to provide basin-scale climate projections. MRI-AGCM 3.2H has a horizontal resolution of approximately 60 km, and MRI-AGCM 3.2S operates at a finer resolution of approximately 20 km. Both models are widely used in CMIP5-based climate projection studies and can simulate large-scale atmospheric phenomena, such as monsoonal systems and tropical cyclone activity. Simulations covered a historical baseline period (1979–2003) and future climate scenarios under two Representative Concentration Pathways (RCPs): RCP 2.6 and RCP 8.5, which represent low and high greenhouse gas emission trajectories, respectively. For comparison with CMIP6 Shared Socioeconomic Pathways (SSP), RCP 2.6 is broadly comparable to SSP1-2.6, and RCP 8.5 is broadly comparable to SSP5-8.5 in terms of end-of-century radiative-forcing class, but they differ in emissions composition and transient evolution. Therefore, the correspondence is approximate, not exact 16.
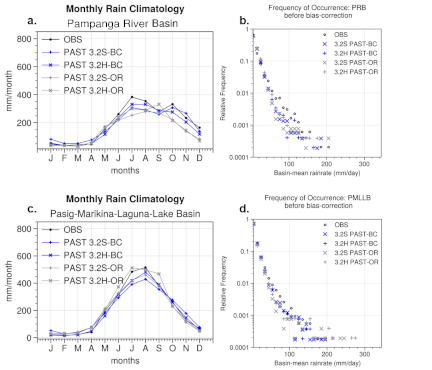
Fig. 2. Comparison of observed and modeled rainfall climatology and extremes for the Pampanga River and Pasig-Marikina-Laguna-Lake Basins showing bias-corrected simulations (labeled as BC) and original downscaled simulations (labeled as OR). Plots (a, c) show basin-averaged monthly rainfall and (b, d) show frequency distributions of basin-mean daily rainfall (log scale on \(y\)-axis).
To refine the coarse-resolution outputs of the GCMs for basin-scale impact analysis, we used dynamical downscaling with the WRF model version 3.7.1 17. The WRF model settings followed those in Ushiyama et al. 9. However, the domain configuration used a wider area, with a \(110 \times 110 \times 40\) grid for the 15-km domain and a \(112 \times 112 \times 40\) grid for the 5-km domain. We also used three-dimensional variables (U: zonal wind, V: meridional wind, Q: specific humidity, T: temperature) at their original resolutions (S: 20 km, H: 60 km) instead of the 1.25-degree resolution. Our model configuration shows a significantly lower bias compared to the previous study 9 in reproducing monthly rainfall climatology over the Pampanga River Basin, as shown in Fig. 2.
Although the improved resolution and physical representation enhance the results, the downscaled WRF output still shows systematic biases, especially in precipitation magnitudes. To correct this, we applied statistical bias correction using the Quantile Mapping (QM) method, following Ushiyama et al. 9. This method adjusts the cumulative distribution function (CDF) of the model outputs to match that of observed rainfall data from 38 ground-based gauges collected by the Philippine Atmospheric, Geophysical and Astronomical Services Administration (PAGASA) and the Metro Manila Development Authority (MMDA).
The complete modeling workflow includes selecting GCM outputs (MRI-AGCM 3.2H and 3.2S), downscaling with WRF to 5 km resolution, applying QM bias correction, and computing rainfall climatology, extreme precipitation indices (such as heavy rain or drought indicators), and frequency analysis to calculate design rainfall. This methodological framework provides high-resolution, physically consistent, and statistically reliable climate projections that support disaster risk reduction and water resource planning in the Philippines.
2.3. Heavy Rainfall and Drought Indicators, and Design Rainfall Calculation
Three categories of hydroclimatic indicators were derived from the bias-corrected daily rainfall data set to evaluate future changes across the study basins. First, basin-averaged rainfall climatology was assessed by calculating monthly and annual mean precipitation, as well as the spatial distribution of annual mean rainfall, to understand spatial variability in changes. Second, rainfall-extreme indicators were analyzed. For heavy rainfall, the 95th and 99th percentile rainfall values were calculated, and the number of days exceeding 50 mm/day was determined. For drought, the consecutive dry days (CDD) and consecutive wet days (CWD) indices were calculated using a 1 mm/day rainfall threshold, following definitions from the Expert Team on Climate Change Detection and Indices (ETCCDI) 18. These were calculated for both the historical baseline (1981–2000) and future period (2075–2100) to evaluate changes in drought persistence and wet spell duration. Lastly, to understand the impact of changes in heavy rainfall on the design rainfall that is typically used as design criteria for infrastructures, the annual maximum rainfall (in multiple durations 1-day to 5-day) were calculated and frequency analysis was done using Gumbel distribution.
Given the limited duration of available annual maximum rainfall records (25 years), the Gumbel distribution is a statistically sound and practical choice for extreme value analysis in hydrology. As a special case of the Generalized Extreme Value (GEV) distribution with a shape parameter (ξ) of zero, the Gumbel model is often preferred when the data length is insufficient to estimate tail behavior reliably 19,20. Unlike the GEV distribution, which requires stable estimation of a third (shape) parameter, the Gumbel model performs well with 25–30 years of annual maxima in data-limited regions 21. The GEV distribution, while more flexible, introduces uncertainty through its third parameter, which is particularly problematic for short series where the shape parameter is poorly constrained. In these cases, the added complexity of GEV may result in overfitting or unstable extrapolations 22. The Gumbel distribution has proven effective in estimating moderate return periods (e.g., 10–50 years), making it a widely adopted model for infrastructure design rainfall and disaster planning.
3. Results and Discussion
3.1. Historical Model Evaluation
The evaluation shows that the MRI-AGCM3.2-driven WRF simulations capture the seasonal rainfall cycle in both the Pampanga River and Pasig-Marikina-Laguna-Lake Basins, with a clear wet-season peak during June-July-August-September that matches observations. In both basins, the models reproduce the timing of monsoon onset and peak rainfall well, although the original (OR) simulations display some amplitude biases, especially during peak monsoon months. Bias correction (BC) improves agreement with observed monthly totals by reducing wet-season overestimation and dry-season bias. This improvement is more significant in the Pampanga River Basin, where BC simulations better match the observed amplitude and phase of the seasonal cycle. In the Pasig-Marikina-Laguna-Lake Basin, the corrected runs slightly underestimate peak monsoon rainfall but still maintain a realistic seasonal pattern. For rainfall extremes, the frequency-of-occurrence plots indicate that both downscaled GCMs represent the general shape of the observed distribution, including the rapid decrease in relative frequency at higher rain rates. However, the original simulations under-represent very high basin-mean rain rates (greater than 150–200 mm/day), revealing a limitation in capturing the upper tail. Bias correction partially adjusts the distribution and improves agreement with observed mid-to-high intensity bins, but some differences persist at the most extreme values. Overall, the simulations show credible skill in reproducing basin-scale rainfall climatology and daily rainfall distributions, supporting their use for climate change assessment. Remaining differences in the extreme tail highlight the need for explicit evaluation of heavy-rainfall statistics when interpreting projected changes in mean and extreme precipitation for both study basins.
3.2. Rainfall Climatology Trends
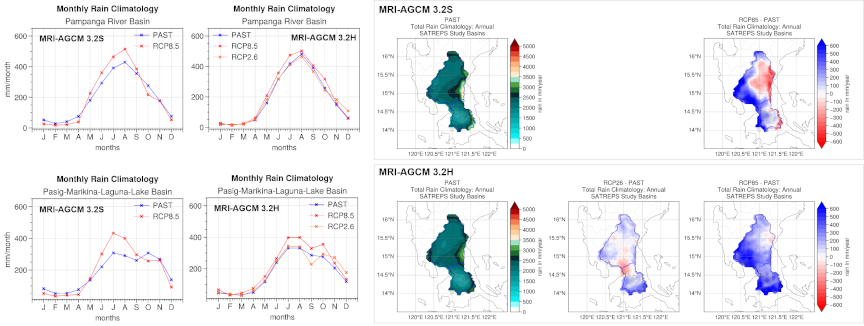
Fig. 3. Projected changes in monthly and annual rainfall climatology for the Pampanga River and Pasig-Marikina-Laguna-Lake Basins under historical and future climate scenarios. Left: basin-averaged monthly rainfall trends. Right: spatial distribution of mean annual rainfall and projected differences for RCP8.5 and RCP2.6 compared to the historical baseline.
The dynamically downscaled and bias-corrected climate projections show clear spatial and temporal trends in rainfall climatology across the Pampanga River and Pasig-Marikina-Laguna-Lake Basins under future climate scenarios. Analyses used 5 km resolution outputs for 1979–2003 (historical baseline) and 2075–2100 (future), based on MRI-AGCM 3.2H and 3.2S under RCP 2.6 and RCP 8.5.
3.2.1. Basin-Averaged Monthly Climatology and Frequency of Heavy Rainfall Events (\(\geq 50\) mm/day)
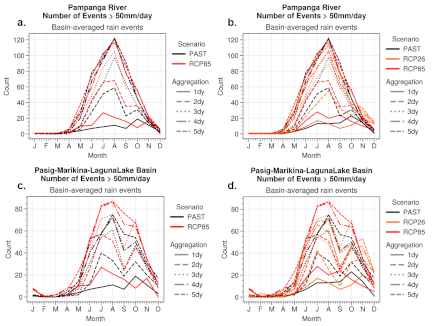
Fig. 4. Monthly frequency of basin-averaged rainfall events exceeding 50 mm/day under historical and future climate scenarios (RCP8.5 and RCP2.6) for the Pampanga River and Pasig-Marikina-Laguna-Lake Basins.
Figure 3 shows that the wet season intensifies under future scenarios, especially under RCP 8.5. In both basins, rainfall peaks during the southwest monsoon period (May to October), with projected monthly totals higher and more concentrated in the middle of the season (June to August). Under RCP 2.6, seasonal patterns remain similar to the historical period, with only moderate increases in rainfall during the early monsoon months. These changes indicate a shift toward stronger monsoonal rainfall and potentially shorter, more intense wet seasons. The projected changes in monthly rainfall climatology are closely linked to the frequency of heavy rainfall events. As monthly rainfall increases, particularly during the southwest monsoon season (June to September), the number of days with precipitation exceeding 50 mm also rises. This pattern shows that the increase in monsoonal rainfall under RCP 8.5 results from more intense rainfall episodes rather than simply more frequent wet days. As a result, seasonal peaks in total rainfall align with months that have the highest counts of heavy-rain events, reinforcing the connection between changes in mean climate and extremes. Fig. 4 demonstrates this relationship, showing that months with the greatest rainfall increases under future scenarios also experience the largest rises in the frequency of heavy-rain events exceeding 50 mm/day. Changes in the monthly occurrence of heavy rainfall events (\(>50\) mm/day) consistently intensify during the southwest monsoon months, matching the increases in monthly mean rainfall shown in Fig. 3. For both basins, MRI-AGCM 3.2 simulations show that the frequency of heavy rainfall rises significantly from May to October under RCP 8.5, with the largest increases between June and August. Under RCP 2.6, projected changes are smaller and remain closer to historical levels, indicating that strong mitigation could limit the frequency of extreme rainfall.
In the Pampanga River Basin, the number of heavy-rain days increases throughout the wet season, peaking around July to September across all aggregation periods (1–4 days). The increase is most pronounced for multi-day events (3-day and 4-day totals), indicating a higher likelihood of prolonged heavy rainfall episodes and potential flooding in downstream areas.
In the Pasig-Marikina-Laguna-Lake Basin, basin-wide increases in heavy rainfall frequency are observed. From March to November, heavy rainfall events become more frequent, with the most significant increases occurring in June–September under RCP 8.5. The consistent rise across all aggregation durations indicates stronger clustering of extreme rainfall events during the monsoon period, aligning with projected increases in mean rainfall for the basin (Fig. 3). These findings indicate that climate change in both basins leads to greater seasonal rainfall totals and more frequent high-intensity events, which may increase flood hazards in the coming decades.
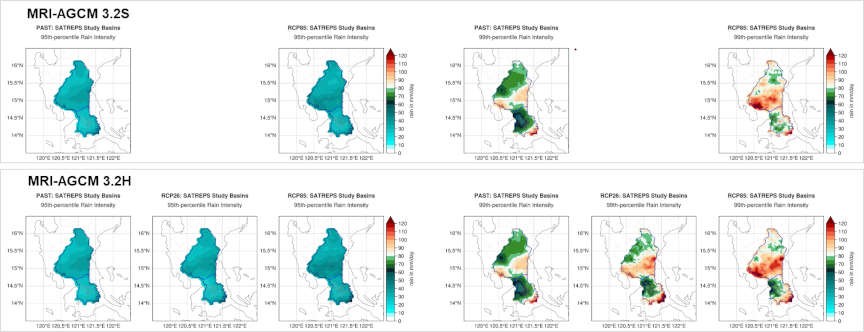
Fig. 5. Spatial distribution of 95th and 99th percentile rainfall intensities under historical and projected climate scenarios (MRI-AGCM 3.2H and 3.2S) for both basins.
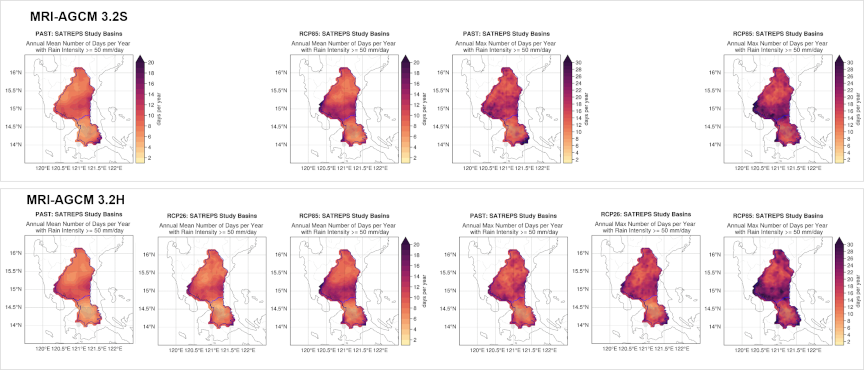
Fig. 6. Mean and maximum annual number of days with rainfall exceeding 50 mm/day under historical and future climate scenarios (RCP8.5 and RCP2.6) for both basins, based on MRI-AGCM 3.2H and 3.2S outputs.
3.2.2. Changes in Annual Rain Climatology
The annual spatial distribution in Fig. 3 shows clear basin-specific responses. In the Pampanga River Basin, rainfall changes display significant spatial variation. Under RCP 8.5, annual mean rainfall is projected to increase substantially in the lower western part of the basin, while the upper eastern catchment is expected to see decreases. RCP 2.6 presents a similar spatial pattern but with smaller changes, including modest increases in the northern and western areas and slight reductions in the south. In contrast, the Pasig-Marikina-Laguna-Lake Basin is projected to experience a more consistent increase in annual rainfall across the basin for both scenarios. The increase is greater under RCP 8.5, with the largest changes in the eastern and central regions. This pattern, along with projected monthly rainfall increases from March to November, suggests a higher risk of flooding in the urbanized lowlands of Metro Manila and nearby areas.
3.3. Changes in Extreme Rainfall Events
Analysis of extreme rainfall events shows a consistent increase in both intensity and frequency under future climate scenarios, especially under RCP 8.5. Key indices are daily rainfall thresholds (\(\geq 50\) mm/day), percentile-based extremes (95th and 99th percentiles), and design rainfall estimates for 1-in-5, 1-in-30, and 1-in-100-year return periods.
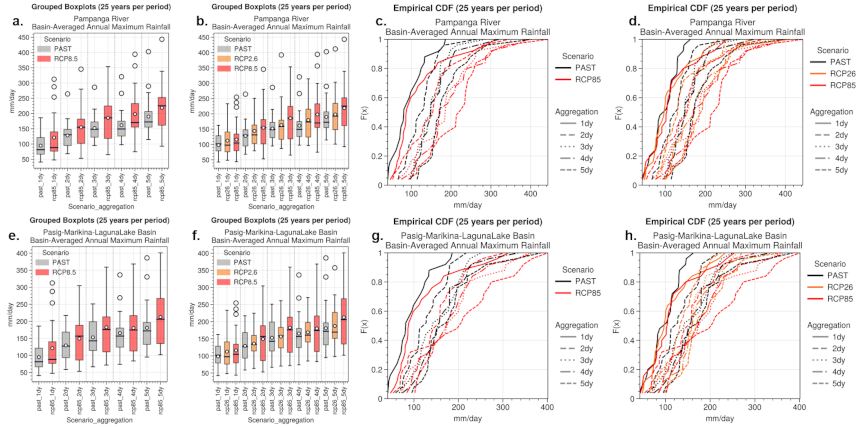
Fig. 7. Boxplots and cumulative distribution functions (CDFs) of annual maximum rainfall for 1- to 5-day durations under historical and RCP8.5 scenarios, illustrating increased frequency and intensity of extremes.
Spatial patterns of extreme rainfall intensity at the 95th and 99th percentiles (Fig. 5) and the frequency of heavy rainfall events exceeding 50 mm/day (Fig. 6) show consistent intensification under future climate scenarios. In both basins, MRI-AGCM 3.2 simulations indicate an overall increase in high-percentile rainfall, especially under RCP 8.5. The 95th-percentile maps show widespread increases across both basins, while the 99th-percentile fields reveal localized amplification in the lower Pampanga River Basin and the central to eastern areas of the Pasig-Marikina-Laguna-Lake Basin. These hotspots align with areas of stronger monsoon moisture convergence and orographic enhancement, indicating a physical connection between intensified monsoon dynamics and localized extremes.
The spatial analysis of heavy rain frequency in Fig. 6 supports this intensification. The annual mean and maximum number of days with rainfall greater than 50 mm per day both increase across the study area, with the largest rises under RCP 8.5. In the Pampanga River Basin, extreme-rain days become more frequent in the lower western catchment near the Manila Bay outlet, while the Pasig-Marikina-Laguna-Lake Basin shows a more uniform increase across its urban and eastern highland zones. Under RCP 2.6, increases are modest, indicating that mitigation can substantially limit the rise in heavy-rainfall frequency. These results show that climate change is likely to increase both the intensity and frequency of extreme rainfall events, supporting earlier findings of greater monsoon rainfall concentration and suggesting a compounded rise in flood hazard potential in both basins.
3.3.1. Changes in Annual Maximum Rainfall
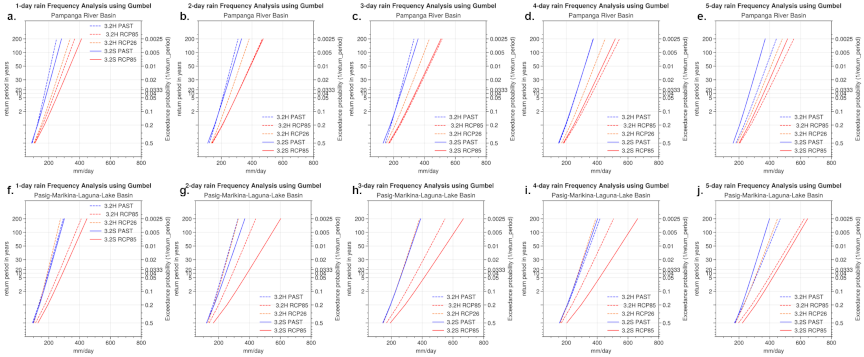
Fig. 8. Frequency analysis of annual maximum 1- to 5-day rainfall events using the Gumbel distribution for the (a) Pasig-Marikina-Laguna-Lake Basin and (b) Pampanga River Basin, based on MRI-AGCM 3.2H (upper panel) and 3.2S (lower panel) simulations.
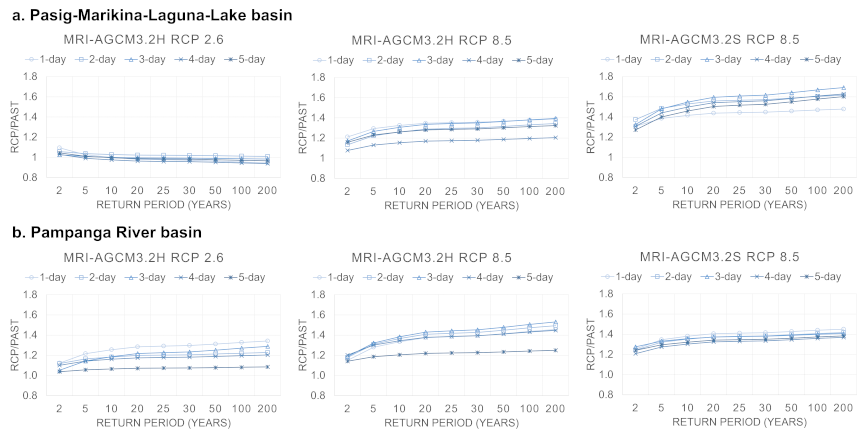
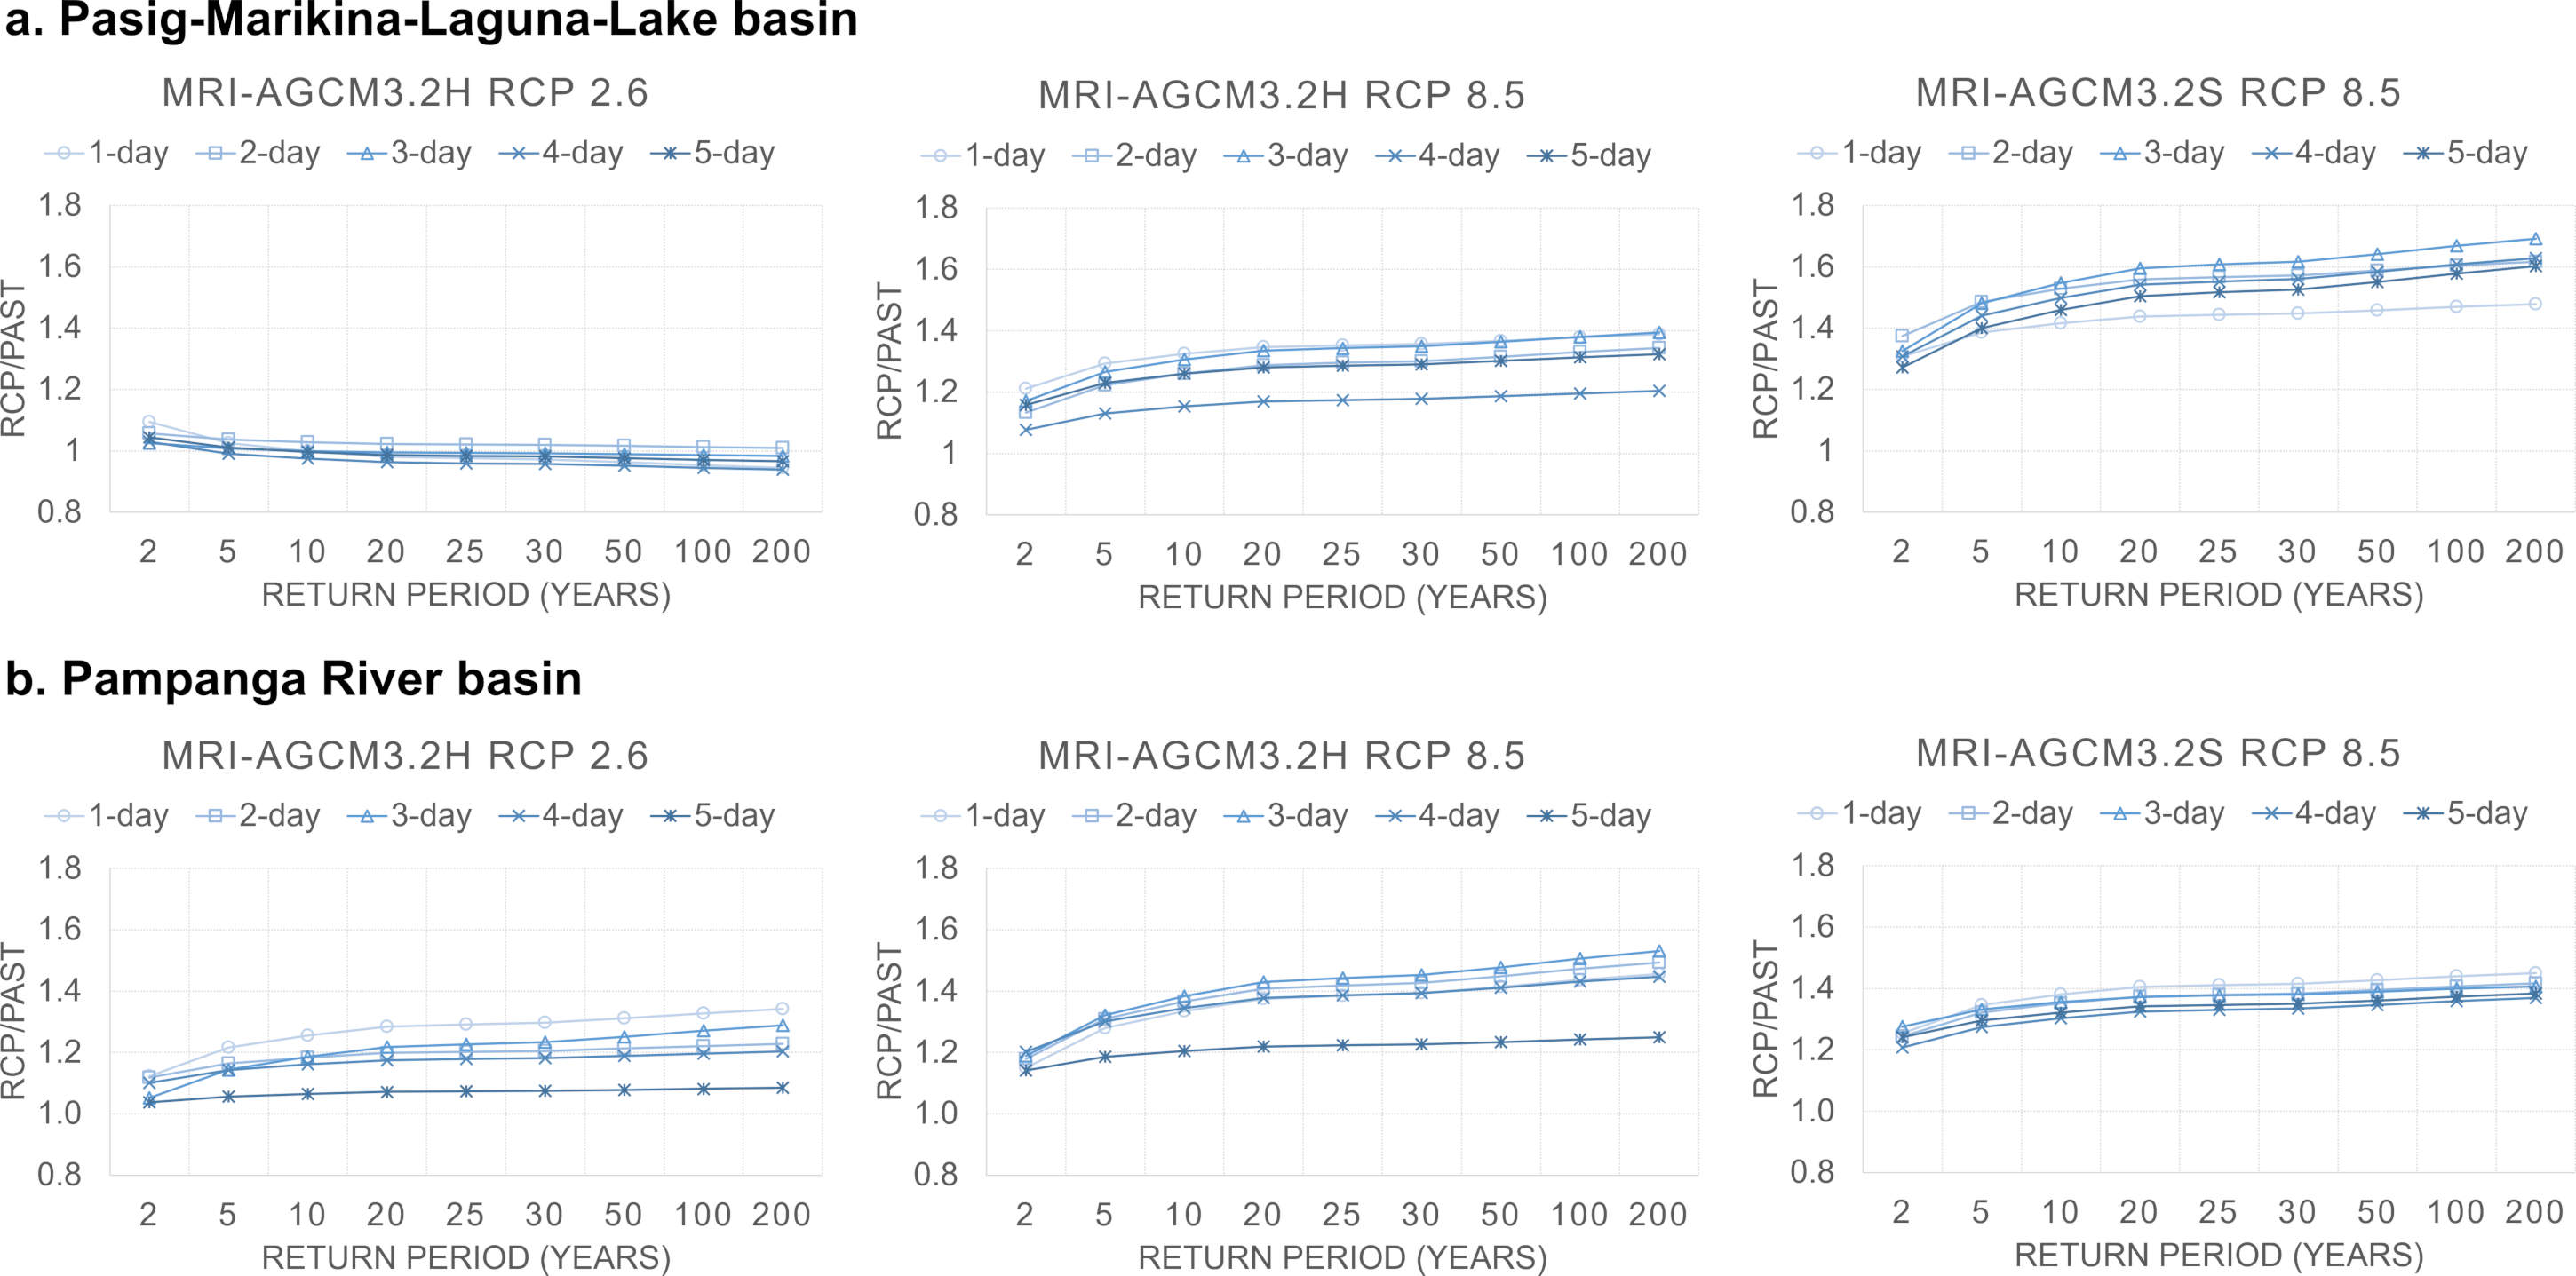
Fig. 9. Ratios of future-to-historical design rainfall for multiple durations and return periods derived from frequency analysis using Gumbel distribution for both basins.
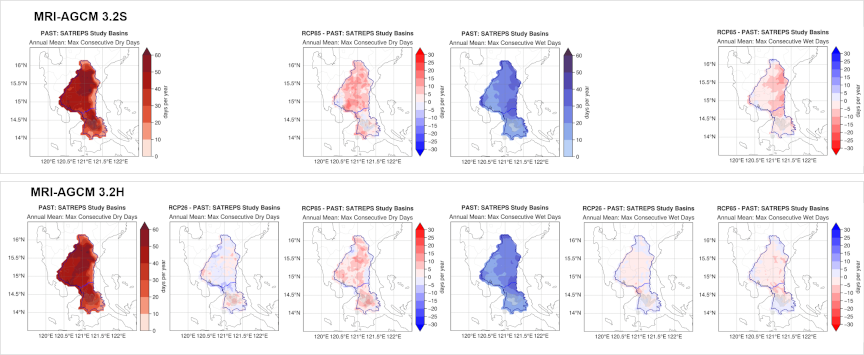
Fig. 10. Annual mean maximum CDD and CWD in the Pampanga River and Pasig-Marikina-Laguna-Lake Basins, based on MRI-AGCM 3.2H and 3.2S simulations. Maps show baseline conditions and projected changes under RCP2.6 and RCP8.5 scenarios.
The observed increase in both the frequency and spatial extent of heavy rainfall events leads to higher annual maximum precipitation. To quantify these changes and assess their implications for design applications, basin-averaged annual maximum rainfall for multiple accumulation durations (1–5 days) was analyzed, as shown in Fig. 7. This analysis directly measures how projected climate change affects the magnitude and recurrence of extreme rainfall events, linking the statistical behavior of observed extremes to design rainfall estimates under future scenarios.
Figure 7 shows the distributions and empirical cumulative distribution functions (CDFs) of annual maximum precipitation for both basins under historical and future scenarios. The boxplots indicate a consistent rise in median and upper-quartile rainfall across all aggregation periods under RCP 8.5, suggesting an overall increase in extreme rainfall events. The empirical CDFs display a rightward shift in the distribution, meaning that for any given non-exceedance probability, future rainfall totals are higher than those in the past. This shift becomes more pronounced with longer event durations, especially for 3-day and 4-day aggregations, indicating a greater likelihood of prolonged heavy rainfall episodes. Under RCP 2.6, the distributions show only modest or minimal changes, suggesting that lower-emission pathways can limit increases in extreme rainfall intensity.
3.3.2. Changes in Design Rainfall Estimates
Building on the distributional shifts seen on the annual maximum rainfall, frequency analysis using the Gumbel distribution was done to understand its impact to design rainfall estimates for return periods ranging from 2 to 200 years. The resulting frequency curves (Fig. 8) indicate higher magnitudes under RCP 8.5 for all durations and both basins compared to the past, suggesting that extreme rainfall events for a given return period will be significantly more intense in the future climate. Short-duration extremes (1 to 2 days) show the largest increases, consistent with increased convective activity. Longer durations (3 to 4 days) show intensified multi-day accumulation events, which could lead to more severe basin-wide flooding.
Figure 9 summarizes the magnitude of these changes by showing the ratio of design rainfall between future scenarios and historical periods (RCP/PAST). Under RCP 8.5, both basins show clear increases across durations and return periods, with ratios reaching 1.6 to 1.7 for longer return periods in the Pasig-Marikina-Laguna-Lake Basin and about 1.4 to 1.6 in the Pampanga River Basin. Under RCP 2.6, the ratios remain close to one (0.9 to 1.1), indicating stable or slightly decreasing design rainfall values under mitigated climate forcing. The combined evidence from CDF shifts, frequency curves, and design rainfall ratios shows a consistent and physically robust pattern: climate change is projected to increase both the intensity and frequency of extreme rainfall events, especially under high-emission scenarios. The stronger scaling for short-duration rainfall indicates growing risks of flash flooding in urban catchments downstream of the Pasig-Marikina-Laguna-Lake Basin, while increases over multiple days suggest greater potential for large-scale flooding in basins such as Pampanga. These results highlight the need to include climate-adjusted design rainfall estimates in hydrological design, flood-control planning, and risk-reduction frameworks to maintain infrastructure resilience in a warming climate.
3.4. Changes in Drought Indicators
To assess potential changes in drought characteristics, we analyzed two key indices: CDD and CWD, as summarized in Fig. 10. The projections show a clear intensification of dry conditions, especially under the high-emission RCP 8.5 scenario.
In the Pampanga River Basin, future climate scenarios indicate a consistent increase in maximum CDD throughout the basin, with the largest changes in the northern and central regions. Under RCP 8.5, several areas experience dry spells exceeding 5 consecutive days compared to the historical baseline. At the same time, CWD shows a declining trend, reflecting shorter wet periods and reduced persistence of rainfall events. These changes indicate a higher risk of agricultural droughts, especially during the transition months between wet and dry seasons.
In the Pasig-Marikina-Laguna-Lake Basin, similar patterns are observed. The central and eastern sectors show the greatest increases in CDD, particularly under MRI-AGCM 3.2S simulations. CWD decreases are less spatially uniform but remain common, especially in the lower catchment near Laguna Lake. These changes are critical for urban water supply and ecosystem services because they affect both runoff and groundwater recharge.
Overall, the projections indicate a dual hazard: more intense short-duration floods due to extreme rainfall and longer dry periods with potentially greater socio-economic consequences. The combined changes in wet and dry spells highlight the need for integrated flood-drought risk management frameworks in both basins, considering spatiotemporal variability and sector-specific vulnerabilities.
3.5. Comparison Across Climate Models
The use of two global climate models, MRI-AGCM 3.2H (60 km resolution) and MRI-AGCM 3.2S (20 km resolution), allowed a comparative assessment of projection uncertainty in flood and drought indicators. Both models generally agree on the direction of change under future climate scenarios, with projections indicating intensified rainfall extremes and longer dry spells. However, they differ in the magnitude, spatial distribution, and seasonal timing of projected effects.
MRI-AGCM 3.2S consistently projects higher frequencies of 50 mm/day rainfall events, especially in localized hotspots such as the southern Pampanga River Basin and eastern Metro Manila. This likely results from its finer spatial resolution, which better captures mesoscale convective processes, orographic enhancement, and localized storm systems. In contrast, MRI-AGCM 3.2H produces smoother spatial patterns and slightly lower estimates of design rainfall for high return periods (e.g., 1-in-100-year events).
For drought indicators, both models project increased maximum CDD, but MRI-AGCM 3.2S indicates more severe and spatially variable drought conditions, particularly in transitional zones between wet and dry climates. Reductions in CWD are generally more pronounced in MRI-AGCM 3.2H, although these differences are less significant than those observed for CDD.
Inter-model discrepancies highlight the need to consider model structural uncertainty when using downscaled climate projections for disaster risk assessments. High-resolution models such as 3.2S provide greater detail and local realism, which are important for urban flood planning, but they may also be more sensitive to initial conditions and internal variability. In contrast, coarser models such as 3.2H may under-represent extremes but offer smoother trends that are useful for long-term regional planning.
Using both models increases the study’s robustness by capturing a plausible range of climate futures and supplying essential information for risk-informed adaptation. This approach also demonstrates the importance of ensemble methods, where multiple GCMs and downscaling pathways are combined to better quantify uncertainty and support resilient infrastructure design.
4. Conclusions
This study assessed projected changes in rainfall climatology, extreme precipitation, and drought conditions in the Pampanga River Basin and Pasig-Marikina-Laguna-Lake Basin using high-resolution dynamically downscaled simulations from MRI-AGCM 3.2H and 3.2S. The results show a consistent intensification of rainfall under RCP 8.5, with notable increases in both mean seasonal rainfall and high-percentile extremes (95th and 99th percentiles). Extreme rainfall events with a 100-year return period are projected to intensify significantly, increasing potential flood risks in both basins. The frequency and duration of intense rainfall days (\(\geq 50\) mm/day) are also projected to rise, especially during the Southwest Monsoon season. These trends indicate a shift toward more hydrologically variable conditions, which challenges flood management, infrastructure resilience, and urban water systems.
In contrast, drought indicators reveal additional concerns. Longer CDD are projected in both basins, particularly under RCP 8.5, while CWD are expected to decrease. These more intense rainfall events and longer dry spells highlight increasing variability in the hydroclimate regime. The uncertainty between model versions (3.2H and 3.2S) indicates that while the direction of change is consistent, the magnitude varies, emphasizing the importance of ensemble analysis. The findings support the urgent need for integrated climate adaptation strategies that address both flood and drought hazards, using localized bias-corrected climate projections. These results can inform regional development planning, early warning systems, and resilient infrastructure design, especially in vulnerable basins experiencing rapid land use change and urbanization.
Acknowledgments
This study is supported by the “Development of a Hybrid Water-Related Disaster Risk Assessment Technology for Sustainable Local Economic Development Policy under Climate Change in the Philippines (HyDEPP)” project of the Science and Technology Research Partnership for Sustainable Development (SATREPS), a collaboration between the Japan International Cooperation Agency (JICA) and the Japan Science and Technology Agency (JST). The authors would also like to thank PAGASA and mmDA for providing observed rain gauge data in the study areas.
- [1] Intergovernmental Panel on Climate Change (IPCC), “Climate change 2021 – The physical science basis,” Cambridge University Press, 2023. https://doi.org/10.1017/9781009157896.
- [2] R. Lasco et al., “State of the 2020 Philippine climate,” Oscar M. Lopez Center for Climate Change Adaptation and Disaster Risk Management Foundation, Inc., 2023.
- [3] F. Tangang et al., “Projected future changes in rainfall in Southeast Asia based on CORDEX–SEA multi-model simulations,” Clim. Dyn., Vol.55, Nos.5-6, pp. 1247-1267, 2020. https://doi.org/10.1007/s00382-020-05322-2
- [4] Supari et al., “Multi-model projections of precipitation extremes in Southeast Asia based on CORDEX-Southeast Asia simulations,” Environ. Res., Vol.184, Article No.109350, 2020. https://doi.org/10.1016/j.envres.2020.109350
- [5] R. Ito et al., “Uncertainties in climate change projections covered by the ISIMIP and CORDEX model subsets from CMIP5,” Geosci. Model Dev., Vol.13, No.3, pp. 859-872, 2020. https://doi.org/10.5194/gmd-13-859-2020
- [6] F. Ge et al., “Future changes in precipitation extremes over Southeast Asia: Insights from CMIP6 multi-model ensemble,” Environ. Res. Lett., Vol.16, No.2, Article No.024013, 2021. https://doi.org/10.1088/1748-9326/abd7ad
- [7] Z. Lin et al., “Projected changes in precipitation extremes over Southeast Asia: Unraveling the roles of thermodynamic and dynamic contributions,” Clim. Dyn., Vol.63, No.1, Article No.1, 2024. https://doi.org/10.1007/s00382-024-07491-w
- [8] P. A. Jaranilla-Sanchez et al., “Hydrological impacts of a changing climate on floods and droughts in Philippine river basins,” J. Japan Soc. Civ. Eng., Ser. B1 (Hydraul. Eng.), Vol.69, Issue 4, pp. I_13-I_18, 2014. https://doi.org/10.2208/jscejhe.69.i_13
- [9] T. Ushiyama et al., “Dynamic downscaling and bias correction of rainfall in the Pampanga River Basin, Philippines, for investigating flood risk changes due to global warming,” Hydrol. Res. Lett., Vol.10, No.3, pp. 106-112, 2016. https://doi.org/10.3178/hrl.10.106
- [10] M. Gusyev et al., “Evaluation of water cycle components with standardized indices under climate change in the Pampanga, Solo and Chao Phraya basins,” J. Disaster Res., Vol.11, No.6, pp. 1091-1102, 2016. https://doi.org/10.20965/jdr.2016.p1091
- [11] P. L. M. Tolentino et al., “Projected impact of climate change on hydrological regimes in the Philippines,” PLoS ONE, Vol.11, No.10, Article No.e0163941, 2016. https://doi.org/10.1371/journal.pone.0163941
- [12] C. E. Monjardin et al., “Impact of climate change on the frequency and severity of floods in the Pasig-Marikina River Basin,” E3S Web Conf., Vol.117, Article No.00005, 2019. https://doi.org/10.1051/e3sconf/201911700005
- [13] K. P. V. Robles and C. E. F. Monjardin, “Forecasting climate change impacts on water security using HEC-HMS: A case study of Angat Dam in the Philippines,” Water, Vol.17, No.14, Article No.2085, 2025. https://doi.org/10.3390/w17142085
- [14] R. Mizuta et al., “Climate simulations using MRI-AGCM3.2 with 20-km grid,” J. Meteorol. Soc. Jpn., Vol.90, No.A, pp. 233-258, 2012. https://doi.org/10.2151/jmsj.2012-A12
- [15] S. Kusunoki et al., “Evaluation of precipitation simulated by the atmospheric global model MRI-AGCM3.2,” J. Meteorol. Soc. Jpn., Vol.102, No.2, pp. 285-308, 2024. https://doi.org/10.2151/jmsj.2024-013
- [16] C. Tebaldi et al., “Climate model projections from the Scenario Model Intercomparison Project (ScenarioMIP) of CMIP6,” Earth Syst. Dyn., Vol.12, No.1, pp. 253-293, 2021. https://doi.org/10.5194/esd-12-253-2021
- [17] W. Skamarock et al., “A description of the Advanced Research WRF Version 3,” Tech. Rep., 2008. https://doi.org/10.5065/D6DZ069T
- [18] X. Zhang et al., “Indices for monitoring changes in extremes based on daily temperature and precipitation data,” Wiley Interdiscip. Rev. Clim. Change, Vol.2, No.6, pp. 851-870, 2011. https://doi.org/10.1002/wcc.147
- [19] S. Coles, “An introduction to statistical modeling of extreme values,” Springer London, 2001. https://doi.org/10.1007/978-1-4471-3675-0
- [20] R. W. Katz et al., “Statistics of extremes in hydrology,” Adv. Water Resour., Vol.25, Nos.8-12, pp. 1287-1304, 2002. https://doi.org/10.1016/S0309-1708(02)00056-8
- [21] S. M. Papalexiou et al., “How extreme is extreme? An assessment of daily rainfall distribution tails,” Hydrol. Earth Syst. Sci., Vol.17, No.2, pp. 851-862, 2013. https://doi.org/10.5194/hess-17-851-2013
- [22] J. R. M. Hosking and J. R. Wallis, “Regional frequency analysis,” Cambridge University Press, 1997. https://doi.org/10.1017/CBO9780511529443
This article is published under a Creative Commons Attribution-NoDerivatives 4.0 Internationa License.