Paper:
Comparing a Single-Hazard Map and a Multi-Risk Overlay Map Based on Design with Nature Process
Misato Uehara*1,†
 , Daiki Shinkai*1, Tomohiro Ichinose*2
, Juichi Yamazaki*3, and Ryohei Yamashita*4
, Daiki Shinkai*1, Tomohiro Ichinose*2
, Juichi Yamazaki*3, and Ryohei Yamashita*4
*1Graduate School of Science and Engineering, Shinshu University
8304 Minami-Minowa, Kamina, Nagano 399-4598, Japan
†Corresponding author
*2Faculty of Environment and Information Studies, Keio University
Fujisawa, Japan
*3Graduate School of Engineering, Kobe University
Kobe, Japan
*4Ishikawa Prefectural University
Nonoichi, Japan

The magnitude 9.0 earthquake and tsunami that struck Japan’s Tohoku region in 2011 highlighted the critical need to integrate disaster risk prediction into post-disaster reconstruction. Building on this perspective, this study evaluates the predictive accuracy and practical utility of two risk assessment methods—the Ministry of Land, Infrastructure, Transport and Tourism hazard map, which is based on single-hazard, uniform physical criteria (single-hazard map), and a multi-hazard overlay map based on McHarg’s ecological planning approach—in the context of the 2024 Noto Peninsula Earthquake and subsequent rainfall-induced sediment disasters in Wajima City. Using QGIS-based spatial analysis, we quantified and compared the spatial overlap between pre-disaster risk predictions and actual sediment-disaster damage. We also examined the relationship between potential housing relocation sites identified through interviews and the two risk maps. The results show that the single-hazard map explained only 16% of the damaged areas in Wajima City and 9% in the Najimi District, whereas the multi-hazard overlay map accounted for all affected zones and clarified the underlying environmental factors. Moreover, the official single-hazard map showed minimal spatial overlap with proposed post-disaster relocation sites. In contrast, the overlay map not only visualized complex multi-hazard risks but also provided insight into differences in disaster risk among potential residential relocation sites and their underlying causes. These findings suggest that reliance on single-hazard maps may result in substantial blind spots in both disaster preparedness and post-disaster recovery. By contrast, overlay-based composite mapping demonstrates both quantitative and qualitative potential for comprehensive regional evaluation and visualization in risk assessment and reconstruction planning.
Design with Nature explains damage patterns beyond single hazards
1. Introduction
The magnitude 9.0 earthquake and tsunami that struck Japan’s Tohoku region in 2011, along with the meltdown at the Fukushima Daiichi nuclear power plant, became one of the world’s worst compound disasters 1. In a sense, the region was forced to rebuild from a level of devastation comparable to damage from extreme rainfall driven by climate change or from conflict. A total of 22,325 people were killed or went missing (including disaster-related deaths) across 12 prefectures, mainly in Tohoku 2. Despite a reconstruction budget of 32 trillion yen—40% of which came from a post-disaster tax increase—approximately 380,000 residents from the hardest-hit prefectures (Iwate, Miyagi, and Fukushima) relocated to other regions 3. This fact highlights the importance not only of reducing casualties through disaster prediction, but also of post-disaster reconstruction planning.
Accurately predicting disaster risks and incorporating this information into reconstruction planning is essential for achieving sustainable urban development. Risk prediction and its application influence post-disaster land use and reconstruction strategies, beyond merely minimizing damage. Moreover, this approach underscores key principles in the technological cycle illustrated by the circular economy’s butterfly diagram, such as maintenance and longevity, sharing, reuse and reallocation, renovation and remanufacturing, and recycling 4. These efforts align with international goals, including SDG Goal 11 (“Sustainable cities and communities”) and Goal 13 (“Climate action”) 5, and carry high policy and ethical significance.
To assess the accuracy and utility of disaster prediction in reconstruction planning, it is necessary to evaluate the spatial consistency between hazard maps and both actual damage and reconstruction decisions. Specifically, quantitative analysis is required to determine how well pre-disaster hazard maps predicted the areas that were ultimately affected, and how these maps informed the selection of relocation sites and the formulation of recovery strategies.
However, current hazard maps are typically created for individual disaster types, limiting their ability to capture the complexity of compound disasters. In cases where disasters such as tsunamis, heavy rainfall, and landslides occur simultaneously or in close succession, the separate maps hinder a comprehensive understanding of overall risk. The implicit assumption that risk sources are independent has significant limitations, such as overlooking potential interactions between hazards and cascading effects 6. Furthermore, unassessed (blank) areas on maps may be misinterpreted as “safe,” complicating rational spatial decision-making before and after disasters. The validity and adequacy of using a single-hazard approach have been increasingly questioned 7.
To address these challenges, spatial assessments using overlay maps—where different disaster risks are superimposed—are considered effective. Previous studies have examined their utility. For example, Uehara et al. compared the actual damage from the Great East Japan Earthquake with multiple hazard maps and assessed the explanatory power of each 8. Their findings indicated that overlay-based evaluations of relative disaster risk provided high spatial consistency with observed damage.
Nonetheless, few studies have examined the spatial relationship between pre-disaster risk assessments and post-disaster reconstruction plans within the same affected areas. Although Uehara et al. examined the predictive value of comprehensive environmental assessments, they did not evaluate their usefulness in recovery planning. Therefore, this study aims to address this gap by continuously and spatially assessing the explanatory power and contributions of hazard maps and multi-hazard overlay maps to the selection of potential reconstruction sites in Wajima City, Ishikawa Prefecture, which experienced an earthquake and tsunami in 2024, followed by flooding and sediment disasters triggered by record-breaking rainfall in October of the same year.
2. Method
This study examined how information on different disaster risks was used and interpreted both before and after a disaster. The effectiveness of pre-disaster information was evaluated by analyzing the spatial overlap between designated hazard areas and actual sediment disaster-affected areas, using polygon data from the 2024 earthquake- and heavy rainfall-induced landslides in Wajima City, Ishikawa Prefecture 9,10.
The usefulness of post-disaster information was assessed by calculating the proportion of designated relocation sites for damaged homes that overlapped with areas identified on hazard maps. The analysis focused on the Najimi District of Wajima City, Ishikawa Prefecture. Potential relocation sites were identified through interviews conducted with local residents in April 2025 and included both village-level relocation plans and plans involving the consolidation of multiple villages.
This analysis contrasted two mapping approaches: (1) a single-hazard map developed by the Ministry of Land, Infrastructure, Transport and Tourism (MLIT) 11, which overlays individual disaster hazard zones by hazard type; and (2) a multi-hazard map based on McHarg’s Design with Nature overlay method 12, which evaluates relative disaster risk according to environmental characteristics.
Uehara et al. previously assessed the predictive accuracy of both hazard maps and overlay maps for large-scale complex disasters 8. In this study, we applied and reassessed McHarg’s Design with Nature environmental assessment—one of the pioneering approaches to multi-risk evaluation—by digitizing historical materials that had originally been produced as paper maps for application to Japan’s national land planning 13 framework. Based on this process, we evaluated both the predictive accuracy and post-disaster usefulness of this information by applying the digitized assessment to a different compound disaster case from the 2011 Great East Japan Earthquake, namely the series of compound disasters that occurred in Ishikawa Prefecture in 2024.
The disaster risk assessments compared in this study include: (1) the MLIT hazard maps on the Hazard Map Portal Site (hereafter referred to as the “single-hazard map”), developed and published by MLIT; and (2) the Environmental Inventory (hereafter “JNLA environmental inventory”), published by the Japanese National Land Agency (JNLA) of Japan in 1980.
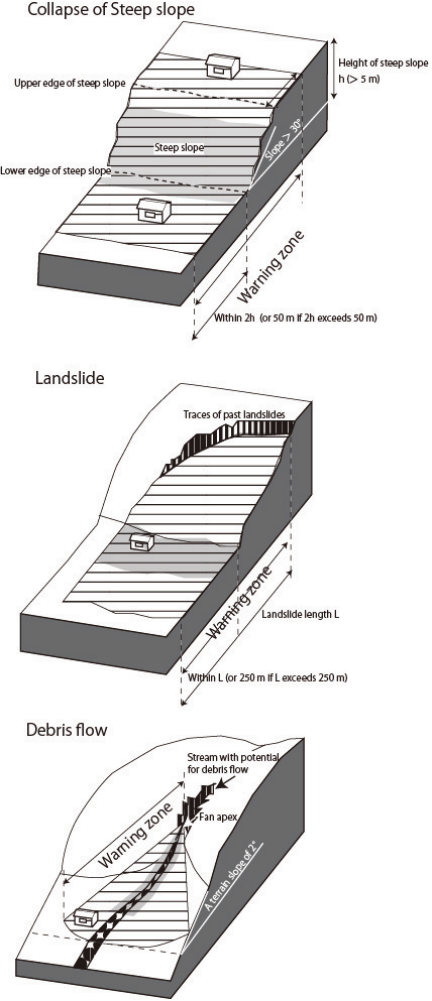
Since 2007, the MLIT has maintained Japan’s national hazard database via the MLIT Hazard Map Portal Site, which is freely accessible and provides up-to-date disaster risk assessments. The map primarily includes flood- and slope-related hazards. However, flood risk assessments are limited to major rivers and do not cover tributaries. Sediment disaster hazards include landslides, debris flows, slope failures, and avalanches. These damage prediction areas are designated uniformly across the country based primarily on physical conditions such as slope angle (30° or greater) and traces of past landslides (Appendix A) 11.
In 1980, the JNLA published maps for the Third National Land Development Plan (NLDP), which included a comprehensive environmental inventory for the Tohoku region 13. The First and Second NLDPs, formulated in 1962 and 1969, provided long-term visions for the development of urban areas, housing, and infrastructure. The third plan, formulated in 1977, was influenced by McHarg’s ecological planning approach and sought to harmonize development with environmental conservation. At the time, large parts of Tohoku remained undeveloped, offering a unique opportunity to implement environmentally sensitive spatial planning that incorporated natural constraints such as disaster risk.
The JNLA Environmental Inventory consists of four the-matic maps: (1) vegetation and land use, (2) geology, (3) slope, and (4) topography. These maps include at-tributes such as liquefaction risk, vegetation rarity (Appendix B.1) , earthquake and landslide risk, water permeability (Appendix B.2), slope failure risk (Appendix B.3), flood risk, and water retention (Appendix B.4). Risk levels and public green infrastructure functions are classi-fied into four categories: high, relatively high, relatively low, and low (Appendix B).
The original environmental assessment inventory created by the national government (environmental classification maps and the relative disaster risk scores associated with those classifications) covers only the six Tohoku prefectures and is not currently publicly available. The National Diet Library also does not hold an archive of this inventory, and thus no institution other than the authors’ laboratory has been able to verify it, to the best of the authors’ knowledge. In this study, to examine the applicability of this inventory to regions outside Tohoku, we linked it to separately developed, publicly available digital environmental classification data.
3. Result
3.1. Overview of the Disaster
On January 1, 2024, a magnitude 7.6 earthquake struck the Noto Peninsula in Ishikawa Prefecture, Japan, causing widespread structural damage, ground deformation, and numerous landslides. In addition, a severe rainfall event struck the Noto Peninsula of Ishikawa Prefecture between September 21 and 23, 2024. Widespread flooding and numerous sediment disasters occurred, particularly in the northern region of the peninsula, resulting in 16 fatalities 14. According to an investigation conducted by the National Research Institute for Earth Science and Disaster Resilience, approximately 1,900 locations experienced sediment outflows due to the heavy rainfall—approaching the scale of the roughly 2,200 sites affected by the Noto Peninsula Earthquake earlier that year 15.
Field observations revealed notable differences between the damage caused by the earthquake and that caused by the heavy rainfall. While the earthquake primarily resulted in structural collapses (Fig. 1), the post-rainfall landscape showed not only large-scale slope failures but also massive outflows of sediment and uprooted vegetation along rivers (Figs. 2 and 3). The extensive damage from the heavy rainfall may have been exacerbated by ground conditions weakened by the earthquake six months earlier.
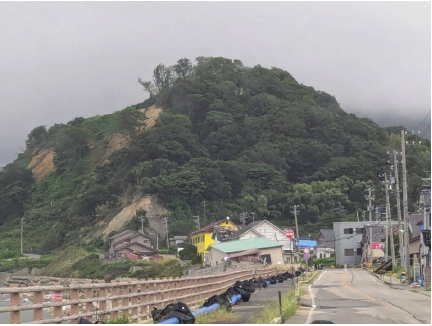
Fig. 1. Slope collapse due to the 2024 Earthquake disaster (Wajima City).
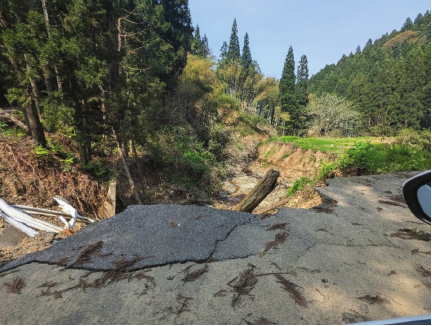
Fig. 2. Slope collapse due to the 2024 Heavy Rainfall disaster (Najimi District).
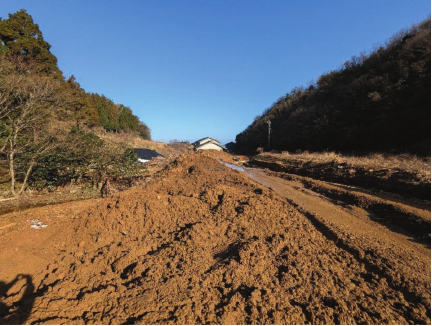
Fig. 3. Debris flow due to the 2024 Heavy Rainfall disaster (Najimi District).
Indeed, it has been noted that the expansion of collapse areas caused by the recent earthquake, as well as the occurrence of numerous new slope failures in locations where little collapse had been observed during the earthquake, represents a noteworthy phenomenon 16.
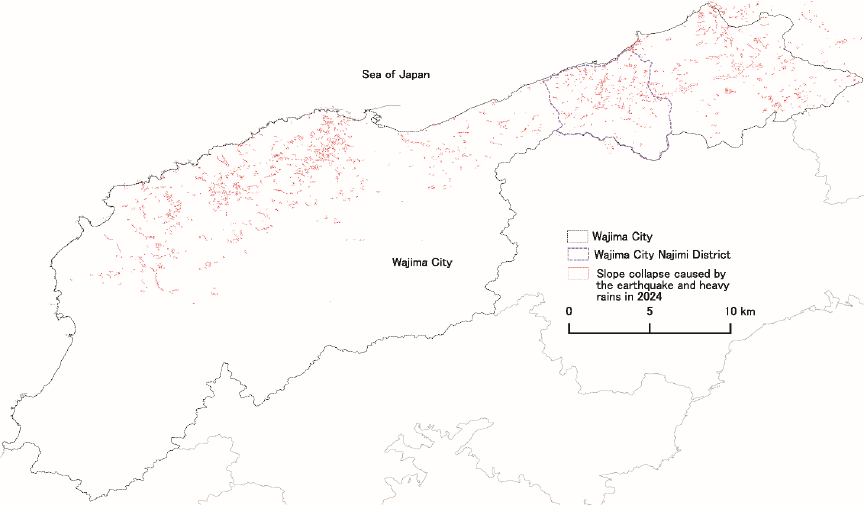
Fig. 4. Integrated data on landslide areas in 2024.
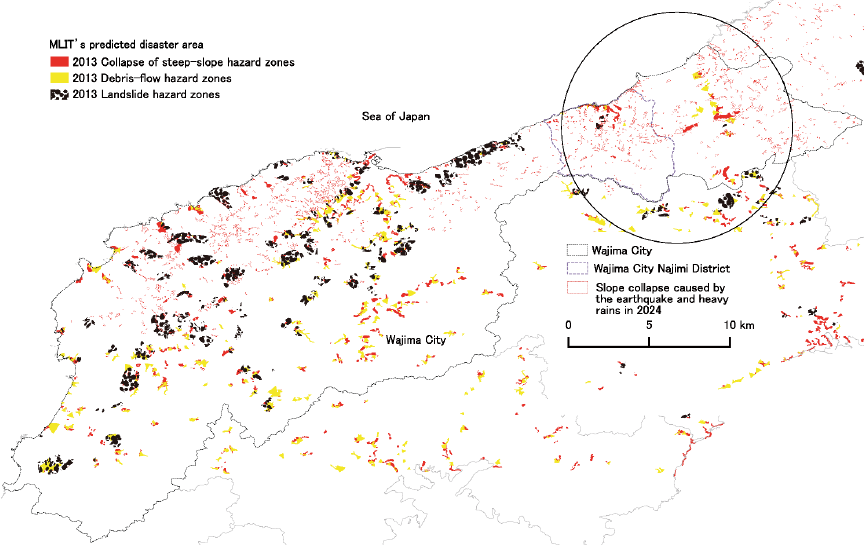
Fig. 5. Original landslide single-hazard map published by MLIT in 2013.
3.2. Compilation and Construction of Base Maps
Figure 4 presents a GIS-based integration of sediment-disaster-affected areas resulting from the 2024 Noto Peninsula Earthquake 9 and the heavy rainfall that occurred six months later 10.
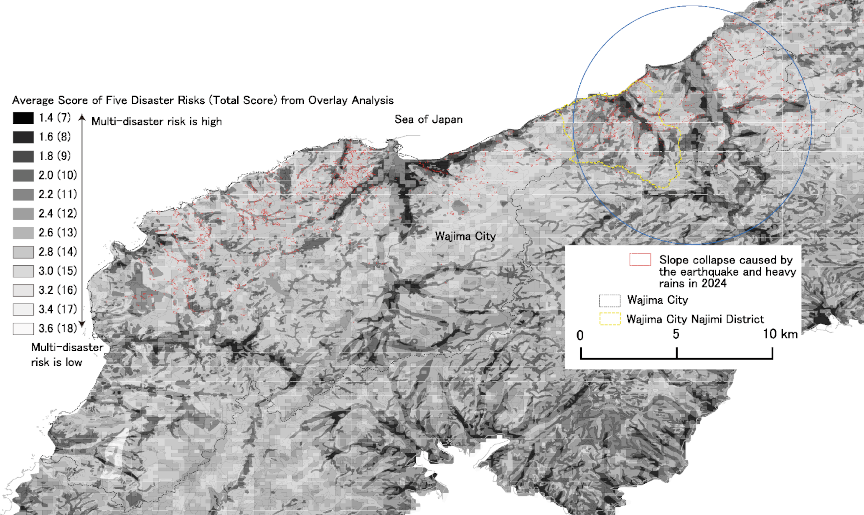
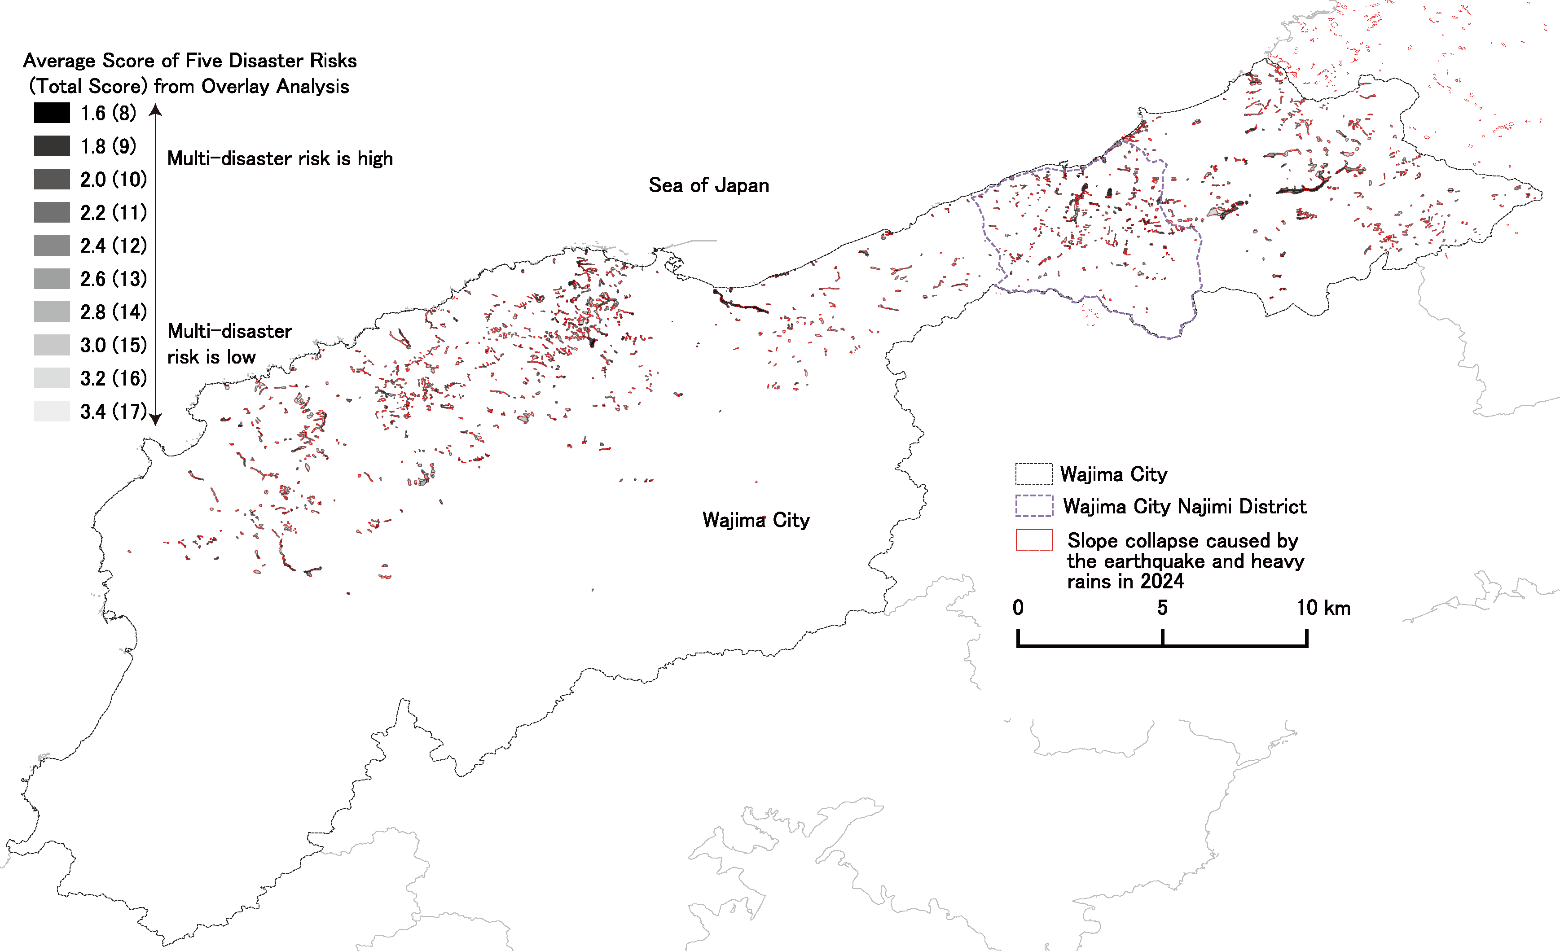
Fig. 6. Composite disaster risk overlay map based on Ishikawa’s environmental classification maps and the JNLA inventory (1980).
This study examines two types of environmental assessments: (1) single-hazard maps that delineate individually predicted disaster zones (Appendix A) and (2) a multi-hazard overlay map based on geology, topography, vegetation and land use, and slope classification, integrating the relative risks of earthquakes, landslides, floods, liquefaction, and slope failure (Appendix B). These two approaches are evaluated in terms of both their predictive accuracy and their applicability to post-disaster reconstruction planning. For this purpose, Fig. 5 presents sediment disaster area data published by MLIT, which were downloaded and processed for analysis.
Figure 6 illustrates a composite disaster risk overlay map newly constructed by the authors’ laboratory. It was developed by linking the digital environmental classification maps of Ishikawa Prefecture with the 1980 inventory from JNLA, which adapts the integrated environmental evaluation method used in the United States for application to national land planning in Japan.
As in Uehara et al.’s study comparing risk assessments across the six Tohoku prefectures, the present overlay analysis enables a relative assessment of composite disaster risk across the study area by visualizing the overlap of five hazard types. While the single-hazard maps designate areas predicted to experience specific phenomena—such as slope failures, debris flows, and landslides—the JNLA-based overlay map visualizes composite risk at a regional scale using varying black tones. Darker tones indicate areas with relatively high cumulative risk from all five hazard types: two sediment-related hazards, earthquakes, liquefaction, and flooding.
Figure 5 (MLIT’s 2013 single-hazard map) predicted a high concentration of sediment disaster zones on the western side of Wajima City. In contrast, Fig. 6 (the composite disaster risk overlay map) identified additional high-risk zones in central and northern Wajima, including the city center and the Najimi District.
The actual distribution of sediment disaster damage caused by the earthquake and the subsequent heavy rainfall (Fig. 4) indicates that, contrary to the single-hazard map’s 2013 predictions, the damage was not concentrated in the eastern part of Wajima City (Fig. 5). Please note the areas indicated by circles in Figs. 5 and 6.
In addition, in the western coastal area of Wajima City, large-scale slope failures that had not occurred during the earthquake were triggered by heavy rainfall approximately six months later (Fig. 4). These coastal hazards were not captured by the single-hazard map (Fig. 5). In contrast, the composite overlay map (Fig. 6) predicted these zones as high-risk areas, as shown by the darker tones along the coastline.
3.3. Evaluation of Prediction Accuracy at Different Spatial Scales
This section presents a detailed comparative analysis of the predictive and explanatory capacities of two GIS-based risk assessment datasets in relation to actual disaster events: (1) sediment disaster hazard zones published by MLIT and (2) a composite disaster risk overlay map constructed using the JNLA inventory and the Design with Nature process.
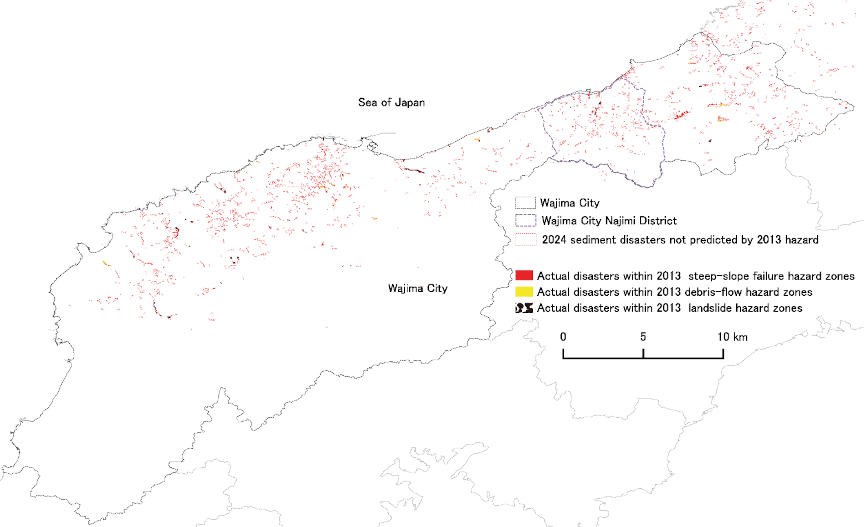
Fig. 7. The intersecting areas between MLIT landslide single-hazard map and actual sediment disaster sites in Wajima City.
To evaluate prediction accuracy at different spatial scales, the spatial overlap between actual damage and the two risk maps was analyzed using the “Intersection” geoprocessing tool in QGIS. This process generated intersecting polygons, and their total area was calculated for the entirety of Wajima City.
A finer-scale analysis was also conducted at the district level, focusing on the Najimi District, which includes the Shiroyone Senmaida rice terraces designated as a Globally Important Agricultural Heritage System site. In this area, the overlap between actual sediment disaster damage and candidate residential relocation sites—identified during community meetings held in April 2025—was also measured.
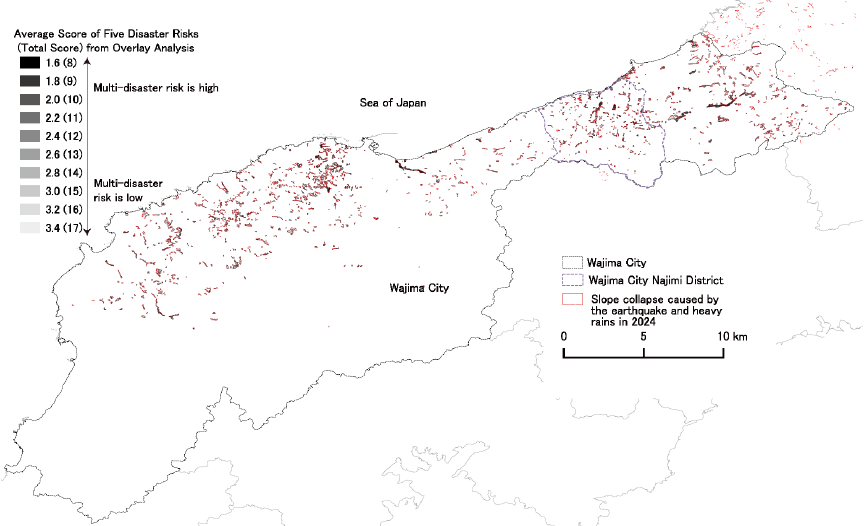
Fig. 8. The intersecting areas between the multiple disaster risk map by the JNLA Inventory and actual sediment disaster sites in Wajima City.
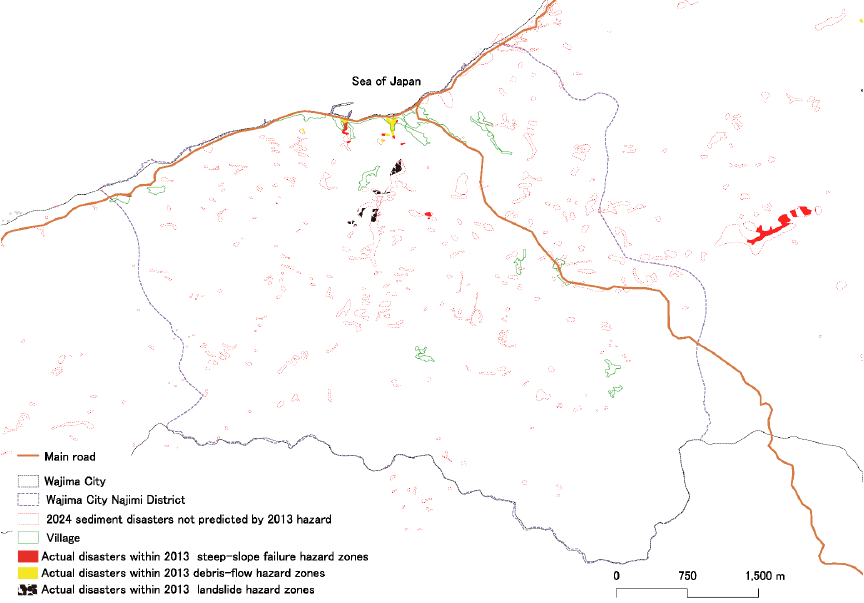
Fig. 9. Intersecting areas between the landslide single-hazard map and actual sediment disaster sites in the Najimi District.
Figures 7 and 8 show only the intersecting polygons between each risk map and the actual sediment disaster areas, extracted via GIS intersection processing. Figs. 7 and 8 show both the intersection polygons where each risk map overlaps with the actual sediment disaster areas extracted through GIS intersection processing, and the polygons where sediment disasters occurred in areas with no prior predictions. The areas where sediment disasters occurred without predictions are displayed using thin red dotted lines only, corresponding to the same polygons shown in Fig. 4.
Figure 7 shows that the spatial overlap between MLIT’s 2013 single-hazard map and the actual sediment disaster areas is limited at the citywide scale. As also seen in Fig. 5, this is true not only for the northeastern part of Wajima, where only small hazard-designated areas were indicated, but also for the central to western coastal areas, where relatively extensive hazard-designated areas had been mapped. Even within these predicted zones, spatial overlap with the actual disaster-affected areas was minimal, leading to the conclusion that most of the 2024 sediment disasters occurred outside the areas designated by the 2013 single-hazard map.
Overall, the overlap was limited, although the correspondence with the landslide hazard areas appears to be slightly higher.
In contrast, the multi-hazard overlay map based on the JNLA inventory (Fig. 8) successfully explained the sediment disaster risk across all areas where sediment disasters were triggered in 2024. This includes the eastern part of Wajima City—especially the Najimi District—where the single-hazard map had indicated only low levels of risk.
As shown in Figs. 9 and 10, the 2024 sediment disasters that were not predicted by the 2013 hazard map (highlighted in red) coincide closely with areas rated with a composite risk score of 2.0 or lower in the overlay analysis (darker black tones), indicating relatively high cumulative environmental vulnerability across all five hazard types.
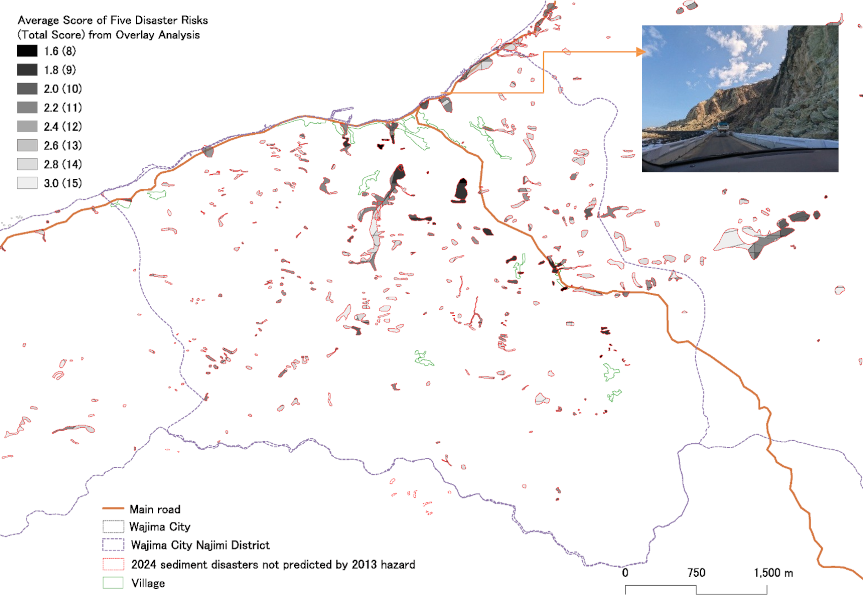
Fig. 10. Intersecting areas between the JNLA-based composite disaster risk map and actual sediment disaster sites in the Najimi District.
A higher-resolution analysis in Fig. 9 further demonstrates that single-hazard zones have very limited spatial overlap with the actual 2024 sediment disaster locations, both within Wajima City and in the Najimi District. This mismatch suggests a systematic underestimation of sediment-related risk in eastern Wajima.
In contrast, the JNLA-based overlay map (Fig. 10) again shows strong explanatory power at the district scale. The darkest risk classes (average scores of 1.6–2.0), derived from relative environmental vulnerability, align closely with the largest and most concentrated 2024 landslide clusters. This includes not only large landslide areas in the inland basins but also steep coastal areas in the northeast, where entire highways have collapsed and become impassable (Fig. 10). This close correspondence validates the effectiveness of the composite, relative-scale risk assessment for identifying areas where conventional hazard zoning failed to predict disaster occurrence.
3.4. Relationship Between the Two Risk Maps and Housing Relocation Site
Next, we analyzed the overlap between potential residential relocation sites and two risk assessment maps: the MLIT sediment disaster single-hazard map and the composite disaster risk overlay map (Figs. 11 and 12). Our analysis revealed that even at the relocation site planning stage, there was almost no overlap between the sediment-disaster single-hazard zones and the designated relocation sites (Fig. 11). Furthermore, the overlap rate between the relocation sites and the single-hazard map in the Najimi District was even lower than the overlap between MLIT’s estimated hazard zones and the actual 2024 sediment disaster locations.
It is important to note that at this stage, residents are still choosing between two relocation plans: a single, large-scale integrated relocation site shared by multiple settlements, and several smaller relocation sites at the settlement level. Because the composite multi-hazard overlay map is not publicly available and can only be created in the authors’ laboratory, residents rely solely on the single-hazard map when considering relocation sites.
Figure 12 shows that the integrated relocation site—located in a wide rice paddy area adjacent to major roads or rivers—is included within zones with high composite risk scores on the overlay map. In contrast, the smaller village-level relocation candidate sites are located outside the high-risk areas identified by the overlay map. This difference arises because the overlay map can evaluate the relative risk of each environmental category across the entire study area and assess multiple disaster risks simultaneously (Appendix B).
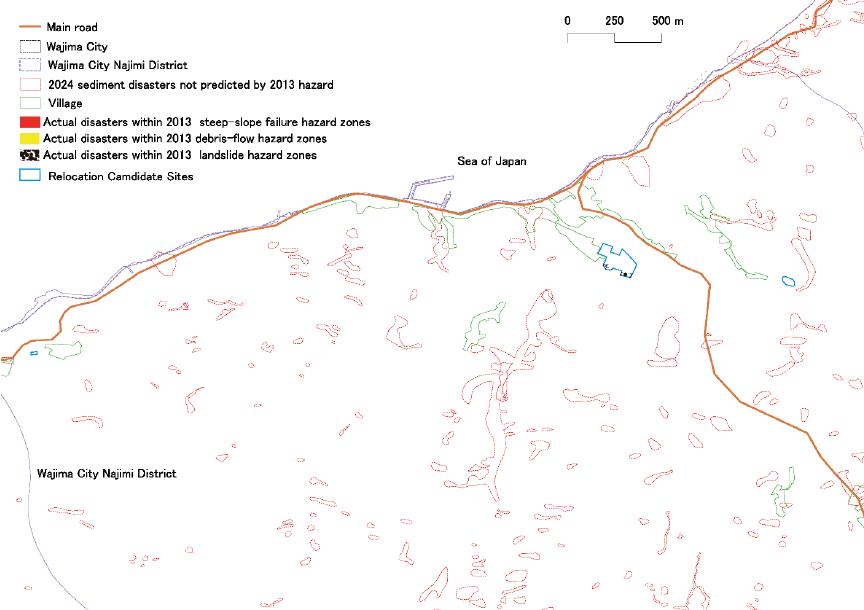
Fig. 11. Intersecting areas between the landslide single-hazard map and actual sediment disaster sites in the Najimi District.
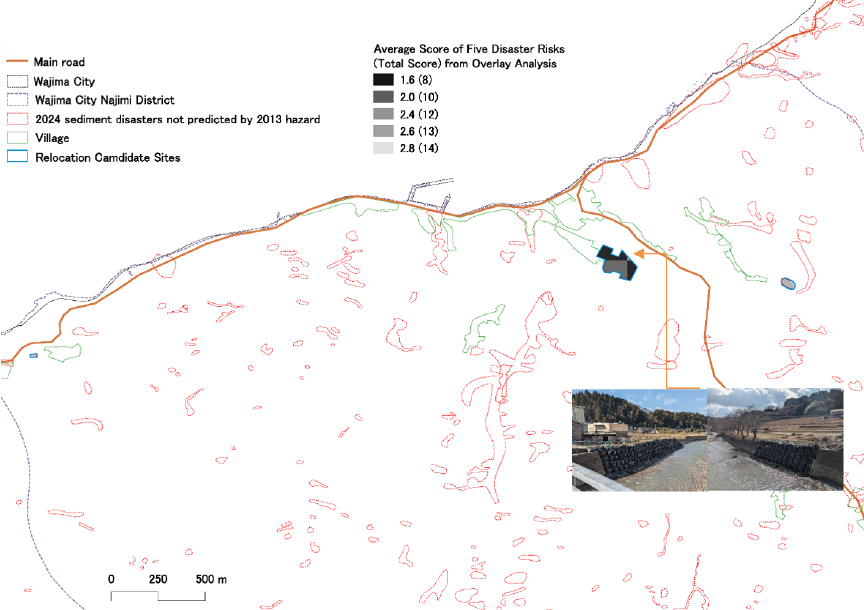
Fig. 12. Intersecting areas between the JNLA-based multi-hazard risk map and actual sediment disaster sites in the Najimi District.
3.5. Quantitative Evaluation of the Accuracy of Two Risk Maps Against Actual Disaster Locations
The results of the preceding analyses on predictive accuracy at multiple spatial scales and on the contribution of risk maps to selecting reconstruction candidate sites are summarized in Table 1. These findings show that the match rate between MLIT’s sediment-disaster single-hazard areas, which specifically depict three types of slope-related hazards, and the actual disaster-affected areas was extremely low: 16% for Wajima City as a whole and only 9% for the Najimi District. This indicates that most sediment disasters occurred in areas that the official hazard maps did not identify as hazardous. This is likely because MLIT’s sediment disaster hazard areas—covering the collapse of steep slopes, debris flows, and landslides—are selected based on uniform national criteria: slopes with a gradient of 30° or more, slopes adjacent to mountain streams with a gradient of 2° or more, and slopes where past landslide topography can be identified near the upper slope. Another factor may be that land without adjacent residential areas is not designated as an assessment area.
The overlap between the single-hazard map and the post-disaster housing relocation candidate sites was even lower, amounting to only 0.2 hectares (7%). Field interviews revealed that residents discussed relocation sites in meetings among neighborhood leaders after the disaster, using hazard maps as reference materials. This suggests that areas designated as high-risk on hazard maps—which demonstrated less than 9% predictive accuracy—may nevertheless have been used as a basis for excluding certain locations from reconstruction. In other words, these decisions may have unintentionally guided housing reconstruction toward areas that were actually more prone to disaster. This is because MLIT’s sediment-disaster single-hazard risk areas do not include land without adjacent residential areas (Appendix A.1).
In contrast, the composite disaster risk overlay map, which integrates five hazard types, successfully captured the relative disaster risk of all affected areas (Table 1). In fact, actual damage was concentrated in zones assessed as having relatively high composite risk, reinforcing the validity of this multi-hazard evaluation approach.


3.6. Evaluation of the Significance of Explaining Risk and Land Value Using a Multi-Risk Overlay Map Based on the Design with Nature Process
The preceding analyses showed that hazard maps designed to predict specific disasters based on uniform nationwide criteria struggle to account for complex, multi-hazard scenarios, particularly in geographically heterogeneous environments. In the present case study, the area overlap rate between predicted and actual damaged areas was less than 16%. The composite overlay approach, originally developed in the United States for regional planning, evaluates relative risk levels by environmental category, including geology, topography, vegetation, and land use (Appendix B). This enables all areas, including both affected and unaffected zones, to be systematically assessed. In addition to area-based predictive performance, the content of the environmental risk evaluations was also analyzed.
Table 2 summarizes the composite risk assessment results for specific locations in the Najimi District where landslides occurred. All five hazard types—two landslide-related risks (geological and slope-based), earthquake risk, flood risk, and liquefaction risk—were rated as either high or moderately high in the affected areas. The results also show that sediment disasters occurred in areas with low water retention and permeability—factors not included in MLIT’s single-hazard maps, which rely primarily on slope angle and past landslide traces. This suggests that the sediment disasters may have been triggered not only by steep slopes but also by unfavorable geological conditions and poor permeability, which likely increased soil saturation following the major earthquake and subsequent heavy rainfall.
Table 3 presents the composite disaster risk assessment results for the candidate sites for housing relocation. Despite the smaller spatial extent of these sites, the overlay map was able to assess all proposed locations. The currently favored consolidated relocation site, situated in a valley-bottom plain, had an average composite risk score of 1.8 across the five hazards, indicating a moderately high level of multi-hazard vulnerability. Specifically, the site exhibits elevated landslide risk due to its geological and slope conditions, and a high liquefaction potential based on its former land use and vegetation classification. Given that a river running immediately adjacent to a consolidated residential relocation candidate site overflowed during the 2024 heavy rainfall event, residents must carefully consider the site’s resilience to future rainfall-induced disasters as well as the seismic resistance of buildings in the event of another major earthquake. Unfortunately, single-hazard maps cannot provide this information.
By contrast, the smaller, decentralized candidate sites—selected based on residents’ preferences to remain within their respective communities—were located in zones with comparatively lower hazard levels. For example, flood risk scores improved to 4 (indicating relative safety), and geological landslide risk scores were slightly reduced. Furthermore, land use and vegetation classifications show that these sites had previously been designated as residential areas, whereas the consolidated site had been used as rice paddy land, making it more vulnerable to liquefaction and seismic damage. These findings suggest that the smaller, decentralized sites may offer comparatively safer conditions for post-disaster housing reconstruction.
4. Discussion
1) Brief summary
This study evaluated the practical utility of a composite disaster risk assessment method—an approach that has attracted growing attention in recent years—by comparing it with conventional single-hazard maps based on individual disaster predictions. The analysis focused on both pre- and post-disaster contexts in the case of the 2024 Noto Peninsula earthquake and heavy rainfall event.
2) Comparison with previous studies
Since the 2011 Great East Japan Earthquake, increasing scrutiny has been placed on the validity of conventional single-hazard risk maps and independent hazard-based approaches. Recent studies have emphasized the importance of analyzing interactions among multiple hazards rather than evaluating them in isolation 6,7. This has led to advances in multi-hazard risk analysis frameworks 17,18. However, as noted in Owolabi and Sajjad’s comprehensive review 17, research on multi-hazard risk assessment remains limited—even in disaster-prone regions such as Japan and other parts of Asia. Moreover, compared to single-hazard approaches, multi-hazard assessments entail additional challenges due to differences in the nature and temporal dynamics of each hazard 19.
3) Possible explanations and implications
In this respect, the composite disaster risk map employed in the present study draws upon one of the most fundamental GIS methodologies: the overlay of spatial data layers representing different environmental zones, each classified into four levels of relative risk or ecological function. These classifications are then visually represented through graduated shading. Dating back to 1912, early evidence of this approach can be found in the work of Warren H. Manning, who worked under Frederick Law Olmsted, the first professional landscape architect. Manning manually overlaid multiple thematic maps to generate new composite maps 20.
Carl Steinitz also cites Ian McHarg’s 1969 Staten Island Land Use Suitability Assessment—which employed a multiplicative image synthesis using differently colored transparent films—as one of the most graphically sophisticated examples of overlay analysis 20. Our study’s multi-risk overlay map also originates from a primitive technique in which maps produced by different disciplines were overlaid to create a new composite map.
However, this method demonstrates strong potential for environmental visualization, enabling an understanding of entire regions characterized by complex geological and ecological patterns. In Japan, where geology, topography, and vegetation are more complex than in the United States, it is particularly significant that this approach has qualitatively and quantitatively shown the possibility of more appropriately explaining the causes and spatial extent of complex disasters triggered by earthquakes and heavy rainfall. In particular, it is significant that this study has highlighted the possibility of simultaneously revealing regional variations in disaster risk that cannot be explained by uniform physical criteria (Appendix A)—such as slope angle or traces of past landslides, which are often regarded as more objective and scientific—as well as land characteristics that can serve as valuable references for post-disaster land use planning.
4) Limitations
One limitation of this study is that the environmental classification data used for the overlay analysis were originally developed for northeastern Japan. The environmental classification maps designed to apply the Design with Nature approach to national land planning in Japan, as well as the tables used to interpret relative risk and environmental value for each classification, are not publicly available. Access to the digitized database is limited to the authors’ laboratory, which digitized the original maps and examined their effectiveness during the Great East Japan Earthquake. Consequently, the multi-risk overlay map based on the Design with Nature process is not accessible to the public. As a result, it remains difficult for both the general public and administrative authorities to view and effectively use information on complex, compound-disaster risk. When planning new land-use strategies for reconstruction, areas not designated on single-hazard maps remain informationally blank, creating the possibility that residents may mistakenly assume such areas are safe.
In this study, we linked the Noto region’s environmental classification map to a separately developed dataset. We incorporated multiple publicly available environmental classification maps for the region and selected information that most effectively enabled a comprehensive risk assessment consistent with previous research. However, slight spatial misalignment occurred at the north west coast outer boundaries of the data layers due to differences in coordinate systems among the environmental datasets used. Future work should address this issue by generating or refining region-specific environmental inventories to ensure more accurate integration in spatial overlay analyses.
Appendix A. Criteria for the 2013 MLIT Single-Hazard Map for Sediment-Related Disaster Hazards
Appendix A presents criteria derived from the MLIT single-hazard map to designate sediment-related disaster hazard zones based on nationwide standardized thresholds. These criteria are applied consistently across Japan without adjustment for local environmental.
A.1. Basis for Uniform Fixed Criteria in Sediment Disaster Damage Prediction
Appendix B. Sample Criteria for Multi-Hazard Overlay Risk Ranking Based on the 1980 JNLA Environmental Inventory
Appendix B presents sample criteria derived from the 1980 JNLA Environmental Inventory that were used to construct the multi-hazard overlay risk ranking in this study. Unlike the fixed single-hazard criteria in Appendix A, these criteria evaluate relative disaster risk and ecological functions by combining multiple environmental attributes specific to the study area.
B.1. Relative Liquefaction Risk and Vegetation Naturalness Criteria by Land Use and Vegetation Classification

B.2. Relative Earthquake Risk, Landslide Risk and Water Permeability Criteria by Geological Classification

B.3. Relative Slope-Induced Landslide Risk Level Criteria by Slope Angle Classification

B.4. Relative Flood Risk and Water Retention Capacity Criteria by Terrain Classification

Acknowledgments
This work was mainly supported by JSPS KAKENHI Grant Number 24K01790 and JST Grant Number JPMJPF2109. Part of this research was also supported by an FY2025 grant from the Ina Valley Foundation and by the Housing Research Foundation (Research Grant No.2522). The authors would like to express their sincere appreciation to Dr. Yoshiyuki Uchikawa and Ms. Iroha Yoshimura (Shinshu University) for their valuable cooperation. We also extend our gratitude to the residents who participated in interviews and related activities under difficult circumstances, particularly Mr. Yuichi and Mrs. Makiko Shirao from the Najimi District of Wajima City. In addition, we thank the reviewers for their constructive and insightful comments. We hope that the findings of this study will contribute to the reconstruction of disaster-stricken areas.
- [1] Cabinet Office, Government of Japan, “Damage situation of the Great East Japan Earthquake,” White Paper on Disaster Management, 2012.
- [2] Fire and Disaster Management Agency, “Damage report of the 2011 Great East Japan Earthquake (as of March 1, 2024),” Ministry of Internal Affairs and Communications, Japan, 2024.
- [3] NHK, “‘250,000 yen per citizen:’ How the reconstruction budget was spent—Disaster reconstruction in an era of population decline,” Close-up Gendai+, broadcast February 25, 2021.
- [4] Ellen MacArthur Foundation, “Circular economy systems diagram,” 2019. https://content.ellenmacarthurfoundation.org/m/66297aa6740489c4/original/Circular-economy-butterfly-diagram.pdf [Accessed July 14, 2025]
- [5] United Nations, “The 17 Goals: Sustainable Development.” https://sdgs.un.org/goals [Accessed July 9, 2025]
- [6] W. Marzocchi, A. Garcia-Aristizabal, P. Gasparini, M. L. Mastellone, and A. Di Ruocco, “Basic principles of multi-risk assessment: A case study in Italy,” Natural Hazards, Vol.62, No.2, pp. 551-573, 2012. https://doi.org/10.1007/s11069-012-0092-x
- [7] J. C. Gill and B. D. Malamud, “Reviewing and visualizing the interactions of natural hazards,” Reviews of Geophysics, Vol.52, Issue 4, pp. 680-722, 2014.
- [8] M. Uehara, K. H. Liao, Y. Arai, and Y. Masakane, “Could the magnitude of the 3/11 disaster have been reduced by ecological planning? A retrospective multi-hazard risk assessment through map overlay,” Landscape and Urban Planning, Vol.227, Article No.104541, 2022. https://doi.org/10.1016/j.landurbplan.2022.104541
- [9] Geospatial Information Authority of Japan, “Landslide and sediment distribution data: Information on the 2024 Noto Peninsula Earthquake (Reiwa 6),” 2024. https://www.gsi.go.jp/BOUSAI/20240101_noto_earthquake.html [Accessed May 13, 2025]
- [10] Geospatial Information Authority of Japan, “Landslide and sediment distribution data: Information on the heavy rain event beginning on September 20, 2024 (Reiwa 6),” 2024. https://www.gsi.go.jp/BOUSAI/R6_noto_heavyrain.html#8 [Accessed May 13, 2025]
- [11] Ministry of Land, Infrastructure, Transport and Tourism (MLIT), “National Land Numerical Information download service: Sediment disaster (2013) hazard areas (Version 1.1), Ishikawa Prefecture,” 2013. https://nlftp.mlit.go.jp/ksj/gml/datalist/KsjTmplt-A33-v2_0.html [Accessed May 13, 2025]
- [12] I. L. McHarg, “Design with nature,” American Museum of Natural History, pp. 7-17, 1969.
- [13] Planning and Coordination Bureau, National Land Agency of Japan, “Ekoroji-karu puranningu ni yoru tochiriyo tekisei hyoka shuho chosa,” [Survey for Land-Use Suitability Evaluation Methods Using Ecological Planning], 1980.
- [14] Asahi Shimbun Digital, “Noto rainfall death toll rises to 16,” December 21, 2024. https://www.asahi.com/articles/DA3S16108522.html [Accessed July 14, 2025]
- [15] NHK, “Estimated 1,900 locations affected by sediment runoff during record-breaking rainfall on the Noto Peninsula. National Research Institute for Earth Science and Disaster Resilience,” October 5, 2024. https://www3.nhk.or.jp/news/html/20241005/k10014601801000.html [Accessed January 27, 2026]
- [16] Y. Matsushi, “Coseismic landslides in the 2024 Noto Peninsula Earthquake and the cascading disaster: Preliminary observations and perspectives,” DPRI Annuals, No.67(A), pp. 131-140, 2024.
- [17] T. A. Owolabi and M. Sajjad, “A global outlook on multi-hazard risk analysis: A systematic and scientometric review,” Int. J. of Disaster Risk Reduction, Vol.92, Article No.103727, 2023. https://doi.org/10.1016/j.ijdrr.2023.103727
- [18] K. Liu, “GIS-based MCDM framework combined with coupled multi-hazard assessment for site selection of post-earthquake emergency medical service facilities in Wenchuan, China,” Int. J. of Disaster Risk Reduction, Vol.73, Article No.102873, 2022. https://doi.org/10.1016/j.ijdrr.2022.102873
- [19] M. S. Kappes, M. Keiler, K. von Elverfeldt, and T. Glade, “Challenges of analyzing multi-hazard risk: A review,” Natural Hazards, Vol.64, No.2, pp. 1925-1958, 2012. https://doi.org/10.1007/s11069-012-0294-2
- [20] C. Steinitz, P. Parker, and L. Jordan, “Hand-drawn overlays: Their history and prospective uses,” Landscape Architecture, Vol.66, No.5, pp. 444-455, 1976.
This article is published under a Creative Commons Attribution-NoDerivatives 4.0 Internationa License.