
Research Paper:
Explaining Patent Citation Lag Through Inventor Networks, Prior Knowledge Bases, and Atypical Recombination: Evidence from Battery Electric Vehicle Technologies
Iori Nakaoka*,†
 , Yousin Park**
, and Yunju Chen***
*Shimonoseki City University
2-1-1 Daigaku-cho, Shimonoseki, Yamaguchi 751-8510, Japan
†Corresponding author
**Prefectural University of Hiroshima
1-1-71 Ujina-Higashi, Minami-ku, Hiroshima, Hiroshima 734-8558, Japan
***Shiga University
1-1-1 Banba, Hikone, Shiga 522-8522, Japan

Timely recognition of technological knowledge is critical in rapidly evolving industries such as battery electric vehicles (BEVs). Prior research on patent citation lag has mainly examined patent-level and team-level attributes. Building on this, this study broadens the framework to consider factors such as social network position, prior knowledge bases, semantic proximity to established technological positions, atypical recombination, and repeated collaboration. Analysis using BEV-related patent data and Cox proportional hazards models revealed that patents with a diverse prior art base tend to be cited earlier, while those closer to established positions in the technological space of the industry are more strongly associated with early citation. In contrast, patents containing technological co-occurrences that are rare across the industry tended to experience delayed first citation. Taken together, these findings suggest that patents are recognized earlier when they draw on diverse technological bases while remaining semantically close to established industry technology, whereas excessively atypical technological combinations may delay early recognition. This study advances research on patent citation lag, knowledge diffusion, and innovation strategies in BEVs.
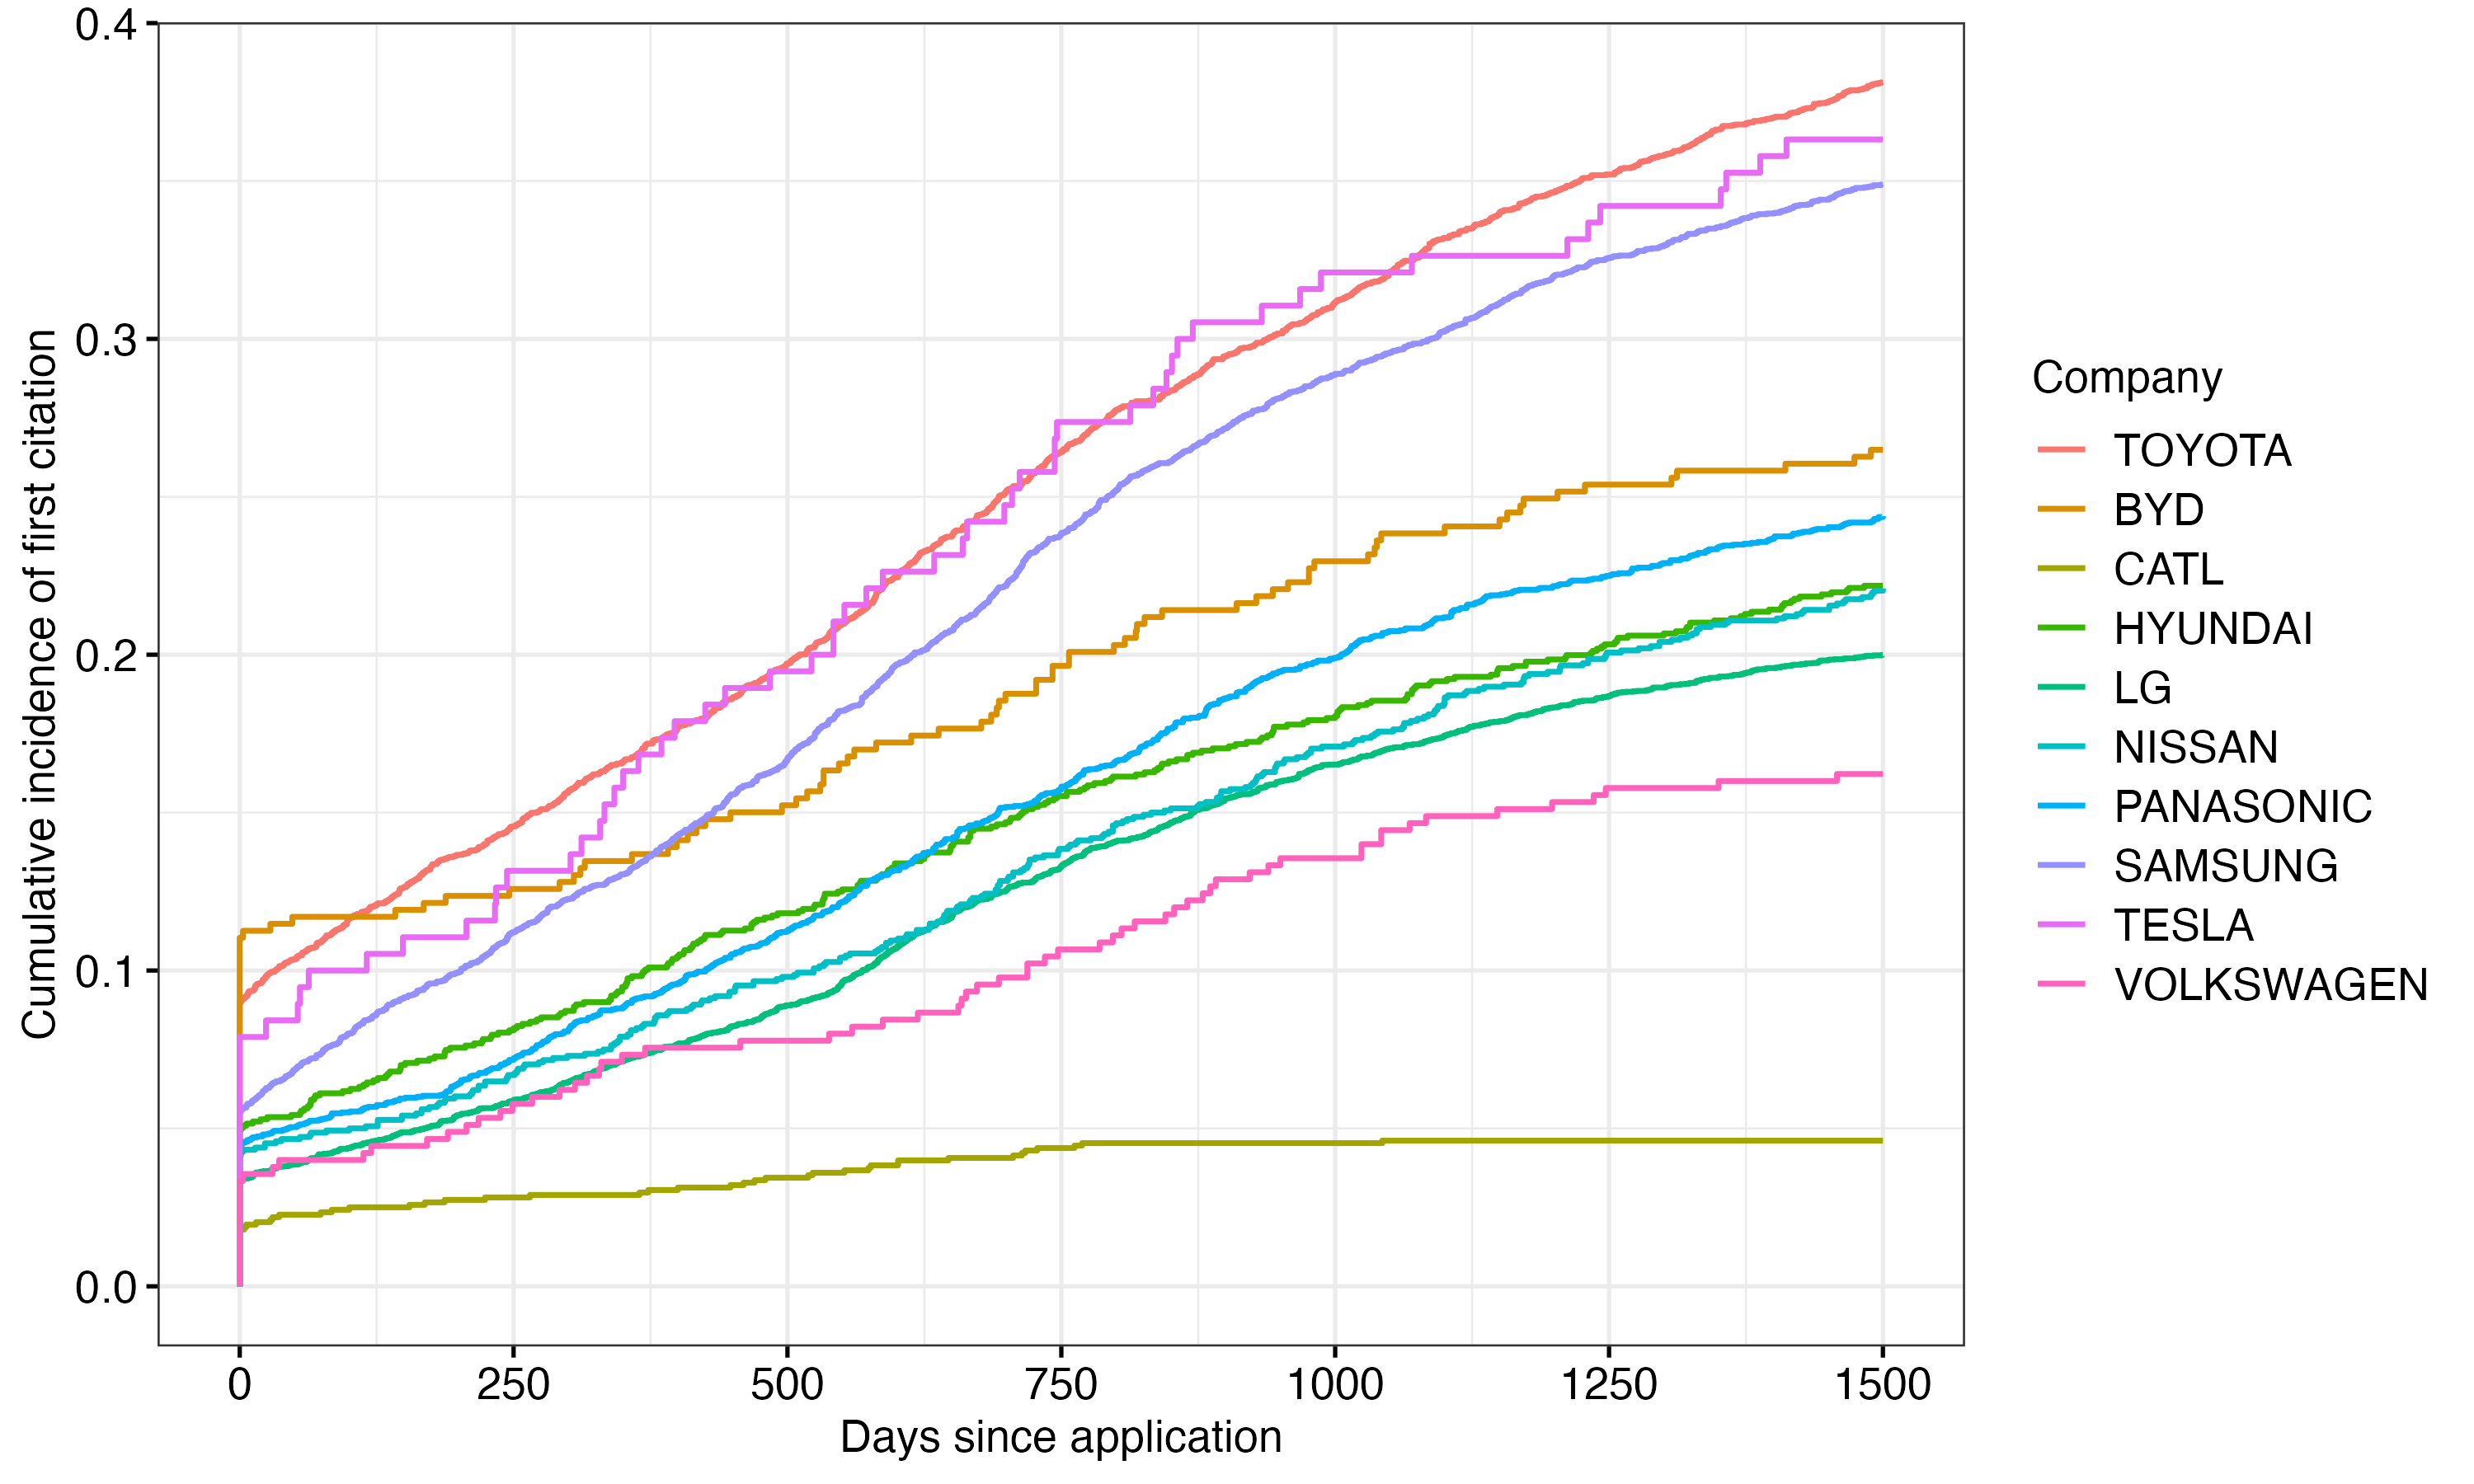
Survival curves of target companies
1. Introduction
Battery electric vehicles (BEVs) drive technological innovation in the shift toward carbon-neutral transportation. Developing BEVs requires integrating batteries, motors, power electronics, software control, and energy management, which makes research and development (R&D) competition complex and interdependent. Patent information offers a valuable way to capture such technological change, as patents reflect observable inventive activity and knowledge flows. This study shows that patent data and text analysis can visualize the technological strengths and R&D directions of major electric vehicle (EV) and battery-related firms, while also noting that researchers still rarely focus exclusively on patents in the EV industry 1. Among patent-based indicators, citation lag—the time until a patent receives its first forward citation—captures how quickly others recognize and reuse technological knowledge. Previous studies treat patent citations as indicators of technological value, knowledge spillovers, and innovation impact 2,3,4. While citation counts reflect eventual impact, citation lag tracks early recognition. Recent work has used Cox proportional hazards models to analyze artificial intelligence patents, showing that survival analysis effectively examines the speed of knowledge diffusion 5. The BEV industry provides a suitable context for analyzing citation lag, as it combines rapid technological change, knowledge recombination, and evolving interorganizational relationships. Innovation theory emphasizes that new technologies emerge through searching, learning, and recombining existing knowledge 6,7,8,9. In BEVs, assemblers acquire knowledge in electronics, chemistry, motors, and batteries, not just mechanical engineering. Park et al. 10 showed that BEV innovation involves changing relationships between assemblers and suppliers, the intersection of exploration and exploitation, and varying reliance on internal R&D and external collaboration. Building on these studies, this study examines the factors that accelerate the first citation of BEV-related patents. It focuses on five factors: (1) co-application network centrality, reflecting the social visibility of inventor teams; (2) diversity of prior technological knowledge base, indicating the breadth of search and absorptive capacity; (3) alignment with the knowledge trajectory of a firm, measuring embedding in cumulative firm-specific development; (4) rare technological co-occurrence at the industry level, signaling atypical recombination; and (5) repeated collaboration among inventors, capturing trust and coordination within R&D teams. This study uses a Cox proportional hazards model to analyze BEV-related patent data, which is appropriate as citation lag is a time-to-event outcome and some patents may not receive citations during the observation period 11,12. The findings reveal that patents with central inventors, diverse technological backgrounds, strong alignment with firm trajectories, rare combinations, and repeated collaboration among inventors are cited more quickly. These results clarify that the social position of inventors, technological breadth, and firm-level and teamwork factors jointly accelerate early knowledge recognition in BEV innovations, thereby contributing to an understanding of the temporal dynamics of early knowledge diffusion in the industry.
2. Theoretical Background and Hypotheses
Patent citations have long served as indicators of knowledge flows, technological influence, and innovation value. Prior studies suggest that subsequent inventors recognize, reuse, or build upon the knowledge represented by cited patents 2,3,4. While the number of citations captures the eventual impact of a patent, the timing of the first citation reveals another important dimension: the speed with which external parties recognize technological knowledge. This study conceptualizes citation lag as a time-to-event outcome that captures the speed with which subsequent technological development recognizes a patent. A shorter citation lag indicates faster knowledge diffusion, whereas a longer lag suggests delayed recognition. This study develops a multidimensional framework that integrates social network position, prior technological knowledge base, firm-level knowledge trajectory, atypical technological recombination, and inventor collaboration experience to explain variation in citation lag. Specifically, the findings indicate that patents by inventor teams with greater centrality in co-application networks, broader prior technological knowledge bases, and alignment with the knowledge trajectory of their firm are recognized more quickly, resulting in shorter citation lags. Conversely, patents featuring rare technological co-occurrences at the industry level and repeated inventor collaboration are associated with longer citation lags, reflecting delayed external recognition.
2.1. Centrality in Co-Application Networks
Social network theory shows that the position of an actor affects access to information and the exchange of knowledge. Central actors access diverse information more efficiently. They also rapidly disseminate their knowledge 13,14,15. In innovation studies, network position shapes knowledge creation. Central inventors and organizations benefit from greater visibility and access to external knowledge 16,17. In patenting, inventor teams at the network center are more visible. They are often associated with diverse inventors, firms, and knowledge communities. Their patents may gain recognition quickly. Thus, centrality in co-application networks is expected to accelerate the first patent citation.
-
H1.
Higher centrality of inventor teams in co-application networks predicts a shorter lag before their patents receive their first citation.
2.2. Diversity of the Prior Technological Knowledge Base
Innovation arises from recombining existing knowledge, where “recombining” refers to integrating different ideas or technologies to create something new. A broader, more diverse knowledge search expands the range of technological components available for this process and can enhance opportunities for novel creation 7,8,18. Prior knowledge also helps organizations to recognize and apply external knowledge 19. In patent research, the technological background of an invention is inferred from the prior technologies it references. Drawings that draw on diverse knowledge bases connect multiple domains and are more likely to become relevant to future inventions, increasing the chance of earlier citations. In this study, the diversity of the prior technological knowledge base is measured primarily by the number of unique upper-level International Patent Classification (IPC) categories associated with the patents cited by the focal patent. A “focal patent” refers to the patent being analyzed. When a focal patent does not cite any prior patent, the number of unique upper-level IPC categories assigned to the focal patent is used as an alternative measure.
-
H2.
The greater the diversity of the prior technological knowledge base of a patent, the shorter its citation lag, where “citation lag” is defined as the time elapsed between the publication of a patent and its first citation by a subsequent patent.
2.3. Alignment with Established Positions in the Industry Technology Space
Technological development is cumulative and path-dependent. Firms innovate by building on prior knowledge and capabilities, which together form the technological trajectories in an industry 20,21. When a new patent aligns semantically with technological positions based on prior patents, it fits within these technological trajectories. This alignment may facilitate interpretation and external recognition 19,22. Specifically, patents developed close to established technological positions may be easier for others to understand and relate to existing technological developments. For these reasons, close alignment is expected to accelerate recognition. To empirically investigate this relationship, this study operationalizes technological alignment as the semantic similarity between the focal patent and established technological positions derived from prior patents in the industry. The similarity is measured using vector-space representations. This approach allows for the quantification of alignment and its subsequent analysis.
-
H3.
The stronger the alignment between a patent and established positions in the industry technology space, the shorter its citation lag.
2.4. Rare Technological Co-Occurrence and Atypical Recombination
Innovation theory suggests that combining existing knowledge in new ways creates novel technological opportunities 6,8. Recent research shows that connecting distant knowledge domains with atypical combinations can yield high-impact results 23,24,25. In the patent context, rare technological co-occurrence refers to combinations of technological domains that have seldom appeared together in prior industry-level patenting activity. Such combinations indicate atypical recombination at the industry level. It is important to distinguish rare co-occurrence from simple technological diversity. While technological diversity captures how many different domains are involved in a patent, rare co-occurrence captures how unusual the specific combination of those domains is, given the prior development of the industry. Thus, two patents may both have high diversity if they draw from many domains, but only the one whose domains were rarely, if ever, previously paired would exhibit rare co-occurrence. Patents with rare technological co-occurrences may attract early attention by creating new technological connections and opening underexplored paths for invention. Later patents are expected to recognize these patents more quickly. Rare technological co-occurrence is measured by tracking pairs of top-level IPC categories in the patent and calculating how rarely these pairs appeared in prior industry patents.
-
H4.
Patents with rarer technological co-occurrences at the industry level have shorter citation lags.
2.5. Repeated Collaboration Experience among Inventors
Innovation is not only a technological process but also a social and organizational process. Prior collaboration among inventors can generate trust, shared understanding, and coordination routines. In this study, “social capital” refers to the valuable relationships among team members, founded on trust and mutual understanding, which facilitate effective knowledge integration 26,27. Social capital theory suggests that repeated relationships can reduce coordination costs and support knowledge transfer. Team cognition research also emphasizes that “shared mental models”—common understandings about team tasks and processes—and accumulated collaboration experience improve team processes and performance 28,29. In patenting, inventor teams with repeated collaboration experience more effectively combine specialized knowledge, resolve technical uncertainty, and produce coherent inventions. As a result, such patents can be easier for external actors to interpret and are more likely to be cited earlier. Thus, repeated collaboration among inventors accelerates the external recognition of patents.
-
H5.
Patents produced by inventor teams with greater experience in repeated collaboration are associated with shorter citation lags, defined as the time between patent grant and the first external citation received.
3. Methodology
3.1. Extraction of Patent Information
First, to identify BEV-related patents, search criteria provided by the market research firm SPEEDA were used to collect patents registered with the World Intellectual Property Organization between 2000 and 2022 for 12 key BEV components (primarily electrical components such as motors and battery-related parts). This collection served as the BEV-related patent database used in this study. Ten automotive and battery-related companies were selected for analysis: Toyota, Volkswagen, Nissan (including Renault data), BYD, Hyundai (including KIA), Tesla, Samsung, Panasonic (including Matsushita), CATL, and LG. In this analysis, companies shown in parentheses were grouped into single entities, for example, Renault and Nissan, KIA and Hyundai, and Matsushita and Panasonic. There is a time lag between patent filing and publication. To address this, new data covering the period from 2020 onward were acquired in January 2026. This study analyzed the factors influencing citation lag. Citation lag was calculated as the number of days between the filing date of each patent and the filing date of the patent it cites. If this value became negative due to mutual citations, it was set to zero. If there were no citations, the number of days between December 31, 2022, and the patent filing date was used.
3.2. Extraction of Patent Information and Calculation of H1, H2, H4 and H5 Scores
H1 measures how centrally placed an inventor team is within the co-application network, where a co-application network is a graph whose nodes represent inventors and whose edges represent co-listings on the same patent. For each year, a network was created from the inventors listed on patents filed that year. Specifically, all possible pairs of inventors who appeared together on a patent were treated as network ties, yielding an undirected inventor network. As the centrality measure for each inventor, harmonic centrality was used in place of standard closeness centrality. Harmonic centrality is a network metric that sums the reciprocals of the shortest path distances from an inventor to all others, allowing for fragmented networks, whereas standard closeness centrality becomes unstable when some inventors cannot reach others. This choice was made because co-application networks, which describe collaborations, often break into multiple disconnected groups called connected components. In addition, this study emphasizes centrality within large, collaborative connected components rather than within small, dense ones. Thus, the harmonic centrality score of each inventor was multiplied by the size ratio of their connected component (the number of inventors in their group divided by the largest group) to adjust the measure accordingly. For each patent, H1 is defined as the average of the adjusted harmonic centrality scores for the inventors named on that patent. Thus, a higher H1 means that the inventor team of the patent, on average, holds a more central position in the co-application network. Thus, H1 captures how centrally embedded the entire patent team is in the collaborative network, rather than the prominence of a single member.
H2 measures the diversity of prior technological areas, or technological bases, on which a patent builds. For each patent, the previous patents it cites were identified, the first four digits of their IPC codes (which define broad technology fields) were extracted, and the number of unique IPC4 categories were counted. A higher value indicates that the patent draws on a wider range of technologies. If a patent did not cite any prior patents, the IPC4 categories assigned directly to the patent were used instead. This approach approximates the breadth of the underlying technological base in the absence of citation data. By using this approach, this study aimed to expand the scope of the analysis and gain a comprehensive understanding of the subject. IPC4 refers to the first four digits of the IPC code, which indicate technology domains. This measure reflects how broadly the patent is grounded in a prior knowledge search. The assumption is that patents with more diverse bases are more likely to be relevant across contexts and receive early citations.
H4 measures the rarity of technological combinations within a patent at the industry level. First, for all patents, IPC codes were split, and IPC4 categories were extracted to identify technology domains. Within each patent, duplicate IPC4 categories were removed such that each was counted only once. Next, for each patent, all possible pairs of IPC4 categories were generated, and their co-occurrence frequencies were compiled into an industry-wide matrix showing how often each pair co-occurred. For each patent, unique IPC4 categories were extracted and sorted. If there were at least two valid IPC4 categories, all possible pairs were matched to the precomputed co-occurrence matrix to retrieve how frequently each pair occurred across the industry. The lowest occurrence among these pairs indicates the rarest technology pairing found in the patent. If this minimum occurrence count was positive, its reciprocal was used as the H4 score. A larger value means that the patent contains a rarer technological co-occurrence. If there were fewer than two valid IPC4 categories or no relevant co-occurrence pair could be formed, H4 was set to zero. Thus, H4 captures how rare the most atypical technological combination in a patent is within the industry, not just whether it spans multiple domains.
H5 measures how much the inventor team of a focal patent has overlapped in collaboration during the past five years. For each year, a five-year historical patent set was reconstructed by pooling all patents from the previous five years. The inventor field of each focal patent was then split to identify its inventor team. The inventor names of the focal team were used to search the inventor fields in the five-year historical set. If a prior patent was matched by two or more focal team members simultaneously, it indicated prior collaboration within the team. H5 was defined as the number of patents issued over the previous five years in which at least two team members participated. A larger H5 value indicates that the inventor team has more prior collaboration over the past five years, while a lower value indicates less overlap. Thus, H5 reflects accumulated team-level collaboration, rather than pair-specific ties.
3.3. Calculation of H3
H3 measures the extent to which a focal patent is positioned near the mainstream of the industry-wide technology space. The procedure consists of the following steps.
Step 1. Extraction of English Abstracts
First, each patent summary was split into sentences. A simple language model checks each part, keeping only those marked as English. The English text was then changed to lowercase, cleaned of extra symbols, and combined into a single summary for each patent.
Step 2. Vectorization of Patent Abstracts
Next, the English abstracts were converted into numerical summaries using a Sentence-BERT model. This study uses PatentSBERTa, a pretrained patent-text model, to generate these summaries. Each patent was then placed in a shared space, so that similarities could be directly compared.
Step 3. Construction of the Prior Five-Year Technology Space
For each focal year, patents applied for during the preceding five years were collected and treated as the prior industry technology space. Their embedding vectors were L2-normalized and clustered using spherical \(k\)-means. L2 normalization was applied because PatentSBERTa embeddings are primarily compared by vector direction rather than magnitude, that is, by cosine similarity. Spherical \(k\)-means was adopted because, unlike standard \(k\)-means based on Euclidean distance, it forms clusters according to directional similarity among normalized vectors, making it more consistent with the semantic structure of sentence-embedding spaces. The number of clusters is set to \(k=20\). This choice reflects the SPEEDA-based retrieval design, which is constructed around 12 major component categories. It was assumed that each component category may contain at least two semantically distinguishable subgroups. At the same time, some component categories contained relatively few patents, making a uniformly finer partition undesirable. Accordingly, \(k=20\) was adopted as a practical level of granularity that distinguishes major technological domains while avoiding excessive fragmentation.
Step 4. Estimation of Cluster Centroids
The average position for each patent group from the previous five years was then determined. These average positions reflect the main areas of technology in the industry at that time.
Step 5. Calculation of Similarity for Focal-Year Patents
Finally, for each patent applied for in the focal year, cosine similarities were calculated between its embedding vector and all cluster centroids. H3 is defined as the maximum cosine similarity among these values. Let \(v_i\) denote the embedding vector of patent \(i\), and let \(c_m\) denote the centroid of cluster \(m\). H3 is then defined as follows.
A higher H3 value means the patent is closer to the main areas of technology in the industry. This reflects not just how different a patent is from the work of a company, but also how closely it aligns with the main industry technology.
3.4. Modeling Citation Lag Based on H1 to H5
This study investigated whether each of the factors listed in H1 through H5 above influences the time to citation. To measure the impact of each factor, the Cox proportional hazards model—a type of survival analysis—was applied using status information indicating whether each patent was cited and the number of days until each patent was cited. As mentioned earlier, this study constructed a patent database covering the period from 2000 to 2022; however, H2 calculates scores using citation source information, and H3–H5 calculated scores by comparing them with past technological developments. Therefore, the analysis period for this study was set from 2005 to 2022.
4. Results
4.1. Citation Lag and H1–H5 Score Distribution
This section describes the distribution of citation lag scores (Fig. 1) and H1–H5 scores (Fig. 2) among patents in the BEV patent database. Fig. 1 reveals that first citations are concentrated at a relatively early stage. However, the distribution does not end with a peak near zero, but continues with a consistent number of citations extending from several hundred days to approximately 1,000 days. This suggests that first citations can be divided into those that occur “immediately” and those that take “some time.” Therefore, the distribution is not unimodal but shows a strong initial concentration followed by a broad spread. Additionally, in the H4 histogram, large values appear extremely sparse, largely due to the use of reciprocals. In H3, as the number of clusters was set to 20, few technologies deviate significantly from existing technology, and the maximum cosine similarity value remains consistent.
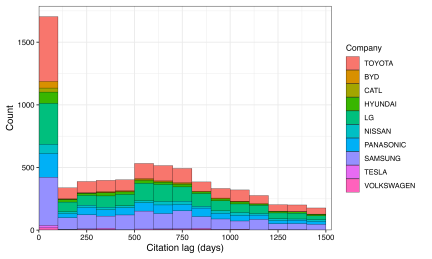
Fig. 1. Citation lag by company.
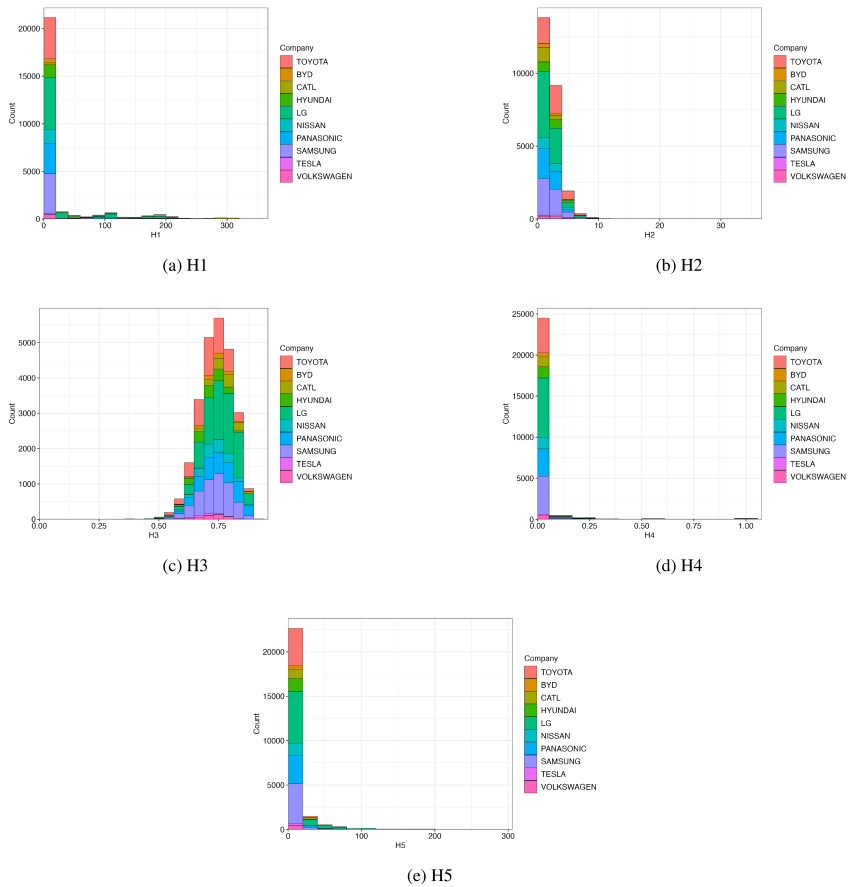
Fig. 2. Distributions of H1–H5 by company.
4.2. Cox Proportional Hazards Model
Figure 3 shows the Kaplan–Meier curves for the first citation in the patents analyzed, whereas Table 1 lists the results of a Cox proportional hazards model that includes the first citation occurring within 1,500 days of filing, with H1 through H5 and company dummies as explanatory variables. In this model, 25,438 patents were analyzed, of which 6,665 were observed to have received their first citation within 1,500 days. Fig. 3 shows that while the cumulative first-time citation rate increases relatively early after filing for some companies, the increase is gradual for others. This indicates that there are differences among companies in the timing of first-time citations.
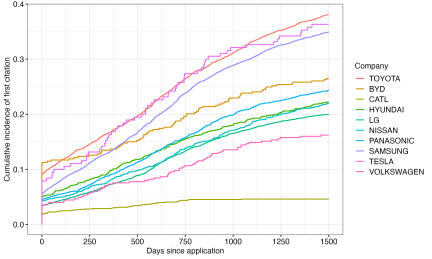
Fig. 3. Survival curves of target companies.
| Variable | Coef. | Hazard ratio | Std. error | \(p\)-value |
| H1 | \(-\)0.0308 | 0.9696 | 0.0016 | \(<0.001\) |
| H2 | 0.0942 | 1.0988 | 0.0057 | \(<0.001\) |
| H3 | 1.9732 | 7.1938 | 0.1878 | \(<0.001\) |
| H4 | \(-\)0.7010 | 0.4961 | 0.1847 | \(<0.001\) |
| H5 | 0.0005 | 1.0005 | 0.0010 | 0.630 |
| BYD | \(-\)0.3636 | 0.6952 | 0.0946 | \(<0.001\) |
| CATL | \(-\)0.5986 | 0.5496 | 0.1350 | \(<0.001\) |
| HYUNDAI | \(-\)0.5282 | 0.5897 | 0.0608 | \(<0.001\) |
| LG | \(-\)0.5220 | 0.5933 | 0.0370 | \(<0.001\) |
| NISSAN | \(-\)0.6773 | 0.5080 | 0.0605 | \(<0.001\) |
| PANASONIC | \(-\)0.4831 | 0.6169 | 0.0429 | \(<0.001\) |
| SAMSUNG | 0.0193 | 1.0195 | 0.0346 | 0.577 |
| TESLA | \(-\)0.3653 | 0.6940 | 0.1435 | 0.011 |
| VOLKSWAGEN | \(-\)1.0045 | 0.3662 | 0.1196 | \(<0.001\) |
| Number of observations \(= \textrm{25,438}\) | ||||
| Number of events \(= \textrm{6,665}\) | ||||
| Concordance \(= \textrm{0.667}\) | ||||
| Likelihood ratio test \(= \textrm{2,928}\), \(p<0.001\) | ||||
| Variable | Coef. | Hazard ratio | Std. error | \(p\)-value |
| H1 | \(-\)0.0322 | 0.9683 | 0.0016 | \(<0.001\) |
| H2 | 0.0982 | 1.1032 | 0.0045 | \(<0.001\) |
| H3 | 1.6206 | 5.0561 | 0.1840 | \(<0.001\) |
| H4 | \(-\)0.7654 | 0.4652 | 0.1841 | \(<0.001\) |
| H5 | \(-\)0.0015 | 0.9985 | 0.0010 | 0.121 |
| Number of observations \(= \textrm{25,438}\) | ||||
| Number of events \(= \textrm{6,665}\) | ||||
| Concordance \(= \textrm{0.639}\) | ||||
| Likelihood ratio test \(= \textrm{2,416}\), \(p<0.001\) | ||||
| Variable | \(\chi^2\) | \(p\)-value |
| H1 | 72.869 | \(<0.001\) |
| H2 | 34.634 | \(<0.001\) |
| H3 | 21.057 | \(<0.001\) |
| H4 | 0.667 | 0.410 |
| H5 | 17.951 | \(<0.001\) |
| Factor (company) | 73.955 | \(<0.001\) |
| GLOBAL | 226.723 | \(<0.001\) |
The results are described as follows. First, H2 (diversity of the prior art base) was positive and significant (\(\mathrm{coef.} = 0.094\), \(\mathrm{HR} = 1.099\), \(p < 0.001\)). This indicates that patents with a more diverse prior art base are more likely to be cited for the first time within 1,500 days. Next, H3 (how mainstream the technological space of the industry) is showed a strong positive effect (\(\mathrm{coef.} = 1.973\), \(\mathrm{HR} = 7.194\), \(p < 0.001\)). That is, patents closer to mainstream cluster centers within the semantic space of the industry tended to receive their first citation significantly earlier. By contrast, H4 (rare technological co-occurrence) was significantly negative (\(\mathrm{coef.} = -0.701\), \(\mathrm{HR} = 0.496\), \(p < 0.001\)). This result indicates that patents containing IPC co-occurrences that are atypical within the industry tend to be cited for the first time later.
In contrast, H1 (co-application network centrality) was negative and significant (\(\mathrm{coef.} = -0.031\), \(\mathrm{HR} = 0.970\), \(p < 0.001\)), yielding results opposite to the initial hypothesis. Furthermore, H5 (intensity of collaboration over the past five years) was not significant (\(\mathrm{coef.} = 0.0005\), \(\mathrm{HR} = 1.0005\), \(p = 0.630\)). Therefore, when controlling for firm-specific differences, H5 did not robustly explain the speed of the first citation.
Regarding firm dummies, compared to the reference firm, Toyota, BYD, CATL, Hyundai, LG, Nissan, Panasonic, Tesla, and Volkswagen all had hazard ratios below one, indicating a tendency toward delayed first citations. The differences were particularly large for Volkswagen (\(\mathrm{HR} = 0.366\), \(p < 0.001\)), Nissan (\(\mathrm{HR} = 0.508\), \(p < 0.001\)), and CATL (\(\mathrm{HR} = 0.550\), \(p < 0.001\)). By contrast, Samsung showed no significant difference from Toyota (\(\mathrm{HR} = 1.019\), \(p = 0.577\)). This result indicates that the effects of H2, H3, and H4 are maintained even when company differences are considered.
Table 2 lists the results of the model without firm dummies. In this model, H1, H2, H3, and H4 were also significant, and their signs matched those in the model with firm dummies. Specifically, H1 was negative, H2 and H3 were positive, and H4 was negative. By contrast, H5 was also not significant in this model (\(p = 0.121\)).
When comparing the results with and without firm dummies, the effects of H2, H3, and H4 were consistent; in particular, the positive effect of H3 and the negative effect of H4 were robust. This confirms that technological diversity, mainstream status within the technology space, and the atypical nature of technological linkages are important factors determining the speed of first citation.
Table 3 lists the results of the Schoenfeld residual test for the model with the firm dummy. The results show that no significant violation of the proportional hazards assumption was found for H4 (\(p = 0.41\)). By contrast, significant violations were observed for H1, H2, H3, H5, and the firm dummy variable. The violations for H1 and H5 were substantial, and it is highly likely that these effects are not constant over the observation period.
5. Discussions
The results of this study indicate that early citations of EV-related patents are largely determined by whether the technology, while possessing a diverse technical foundation, occupies a position that is comprehensible within the overall technological landscape of the industry. Specifically, H2 and H3 showed positive effects, while H4 showed a significant negative effect. These results suggest that early citations are driven not only by novelty but also by their interpretation within the existing semantic space of the industry, while possessing a broad knowledge base. When considering H2 and H4 together, it becomes clear that the “breadth” of knowledge and the “rarity” of combinations should be distinguished. In this study, “breadth” refers to drawing from a wide variety of technological fields, while “rarity” refers to how unusually technologies are combined. While H2 has a positive effect, H4 has a negative effect; therefore, being grounded in a broad technological foundation is not the same as incorporating extremely rare technological combinations. The former broadens the scope of relevance from the perspective of subsequent inventors, while the latter may increase cognitive load (the mental effort required to understand the combination). This point offers a qualified perspective on prior research discussing the benefits of technological diversity, specifically from the viewpoint of early diffusion. The fact that the effects of H2, H3, and H4 were maintained even in a model controlling for firm-level differences supports the robustness of the study results. That is, while firms such as Toyota and Samsung have high cumulative first-citation rates, the fact that H2, H3, and H4 remain significant even after controlling for technical characteristics indicates that early citation is not merely a matter of corporate brand or size, but is largely explained by the technical structure of the patent content itself. The limitations of this study are as follows. First, the analysis was limited to EV-related patents based on SPEEDA’s major component search, and generalizability to other fields was not verified. Second, in H3, there remain arbitrary elements in the selection of the model and the determination of the number of clusters; therefore, the results may change depending on these adjustments. Third, violations of the proportional hazards assumption (that the effect of the variables on citation rates remains constant over time) were confirmed for H1, H2, H3, and H5; additional analyses explicitly addressing time-dependent effects are desirable, particularly for these variables. This study demonstrates the importance of three factors for early EV patent citations: diverse technology, alignment with mainstream technology, and the avoidance of overly unusual technological combinations. For early dissemination, valuable inventions should be both novel and easy to understand.
6. Conclusions
This study focused on EV-related patents and investigated which technical and organizational characteristics determine early citation, specifically examining the time to first citation. Through a survival analysis targeting first citations occurring within 1,500 days of filing, this study examined from five perspectives: diversity of the prior knowledge base, mainstream position within the technological landscape of the industry, rare technological co-occurrences, centrality within co-application networks, and the intensity of past collaborations. The analysis showed that early citation was consistently explained primarily by H2, H3, and H4. Specifically, it was demonstrated that patents with a diverse prior knowledge foundation tended to be cited earlier, while patents closer to the mainstream position within the technological space of an industry are more strongly associated with early citation. By contrast, patents containing rare technological co-occurrences across the industry tended to experience delayed first citations. These results suggest that early citation is not determined solely by the degree of novelty, but is facilitated by a patent occupying a position that is understandable within the existing semantic space of the industry, even while possessing a diverse knowledge base. Future research is planed to verify the temporal effect. Subsequently, future work will examine whether the observed effects are generalizable and whether citation trends differ depending on whether the citation originates from the company of the patent holder or a third party.
- [1] I. Nakaoka, Y. Park, H. Akaoka, and Y. Chen, “Visualization of corporate R&D capabilities: Patent data analysis of major EV-related firms,” Global Business and Management Research: An Int. J., Vol.16, No.4s, pp. 1850-1860, 2024.
- [2] M. Trajtenberg, “A penny for your quotes: Patent citations and the value of innovations,” The RAND J. of Economics, Vol.21, No.1, pp. 172-187, 1990. https://doi.org/10.2307/2555502
- [3] A. B. Jaffe, M. Trajtenberg, and R. Henderson, “Geographic localization of knowledge spillovers as evidenced by patent citations,” The Quarterly J. of Economics, Vol.108, No.3, pp. 577-598, 1993. https://doi.org/10.2307/2118401
- [4] B. H. Hall, A. B. Jaffe, and M. Trajtenberg, “Market value and patent citations,” The RAND J. of Economics, Vol.36, No.1, pp. 16-38, 2005.
- [5] I. Nakaoka, Y. Park, and Y. Chen, “Modeling early diffusion of AI patents: Institutional roles, compute intensity, and knowledge diversity,” Int. J. of Academic Research in Business and Social Sciences, Vol.16, No.3, pp. 1289-1303, 2026. https://doi.org/10.6007/IJARBSS/v16-i3/27976
- [6] J. A. Schumpeter, “The theory of economic development,” Harvard University Press, 1934.
- [7] J. G. March, “Exploration and exploitation in organizational learning,” Organization Science, Vol.2, No.1, pp. 71-87, 1991. https://doi.org/10.1287/orsc.2.1.71
- [8] L. Fleming, “Recombinant uncertainty in technological search,” Management Science, Vol.47, No.1, pp. 117-132, 2001. https://doi.org/10.1287/mnsc.47.1.117.10671
- [9] R. Katila and G. Ahuja, “Something old, something new: A longitudinal study of search behavior and new product introduction,” The Academy of Management J., Vol.45, No.6, pp. 1183-1194, 2002. https://doi.org/10.2307/3069433
- [10] Y. Park, I. Nakaoka, and Y. Chen, “The dynamics of the power balance in inter-organizational relationships: The relationship between body assemblers and supplier firms in BEVs,” J. Adv. Comput. Intell. Intell. Inform., Vol.29, No.5, pp. 1091-1098, 2025. https://doi.org/10.20965/jaciii.2025.p1091
- [11] D. R. Cox, “Regression models and life-tables,” J. of the Royal Statistical Society: Series B (Methodological), Vol.34, No.2, pp. 187-220, 1972. https://doi.org/10.1111/j.2517-6161.1972.tb00899.x
- [12] P. D. Allison, “Event history and survival analysis: Regression for longitudinal event data,” 2nd ed., Sage Publications, 2014.
- [13] L. C. Freeman, “Centrality in social networks conceptual clarification,” Social Networks, Vol.1, No.3, pp. 215-239, 1979. https://doi.org/10.1016/0378-8733(78)90021-7
- [14] M. S. Granovetter, “The strength of weak ties,” American J. of Sociology, Vol.78, No.6, pp. 1360-1380, 1973. https://doi.org/10.1086/225469
- [15] R. S. Burt, “Structural holes: The social structure of competition,” Harvard University Press, 1992.
- [16] W. W. Powell, K. W. Koput, and L. Smith-Doerr, “Interorganizational collaboration and the locus of innovation: Networks of learning in biotechnology,” Administrative Science Quarterly, Vol.41, No.1, pp. 116-145, 1996. https://doi.org/10.2307/2393988
- [17] G. Ahuja, “Collaboration networks, structural holes, and innovation: A longitudinal study,” Administrative Science Quarterly, Vol.45, No.3, pp. 425-455, 2000. https://doi.org/10.2307/2667105
- [18] L. Fleming and O. Sorenson, “Technology as a complex adaptive system: Evidence from patent data,” Research Policy, Vol.30, No.7, pp. 1019-1039, 2001. https://doi.org/10.1016/S0048-7333(00)00135-9
- [19] W. M. Cohen and D. A. Levinthal, “Absorptive capacity: A new perspective on learning and innovation,” Administrative Science Quarterly, Vol.35, No.1, pp. 128-152, 1990. https://doi.org/10.2307/2393553
- [20] G. Dosi, “Technological paradigms and technological trajectories: A suggested interpretation of the determinants and directions of technical change,” Research Policy, Vol.11, No.3, pp. 147-162, 1982. https://doi.org/10.1016/0048-7333(82)90016-6
- [21] R. R. Nelson and S. G. Winter, “An evolutionary theory of economic change,” Harvard University Press, 1982.
- [22] D. J. Teece, G. Pisano, and A. Shuen, “Dynamic capabilities and strategic management,” Strategic Management J., Vol.18, No.7, pp. 509-533, 1997. https://doi.org/10.1002/(SICI)1097-0266(199708)18:7<509::AID-SMJ882>3.0.CO;2-Z
- [23] B. Uzzi, S. Mukherjee, M. Stringer, and B. Jones, “Atypical combinations and scientific impact,” Science, Vol.342, No.6157, pp. 468-472, 2013. https://doi.org/10.1126/science.1240474
- [24] H. Youn, D. Strumsky, L. M. A. Bettencourt, and J. Lobo, “Invention as a combinatorial process: Evidence from US patents,” J. of The Royal Society Interface, Vol.12, No.106, Article No.20150272, 2015. https://doi.org/10.1098/rsif.2015.0272
- [25] D. Verhoeven, J. Bakker, and R. Veugelers, “Measuring technological novelty with patent-based indicators,” Research Policy, Vol.45, No.3, pp. 707-723, 2016. https://doi.org/10.1016/j.respol.2015.11.010
- [26] J. S. Coleman, “Social capital in the creation of human capital,” American J. of Sociology, Vol.94, Supplement, pp. S95-S120, 1988. https://doi.org/10.1086/228943
- [27] B. Uzzi, “Social structure and competition in interfirm networks: The paradox of embeddedness,” Administrative Science Quarterly, Vol.42, No.1, pp. 35-67, 1997. https://doi.org/10.2307/2393808
- [28] J. E. Mathieu, T. S. Heffner, G. F. Goodwin, E. Salas, and J. A. Cannon-Bowers, “The influence of shared mental models on team process and performance,” J. of Applied Psychology, Vol.85, No.2, pp. 273-283, 2000. https://doi.org/10.1037/0021-9010.85.2.273
- [29] S.-S. Wong, “Distal and local group learning: Performance trade-offs and tensions,” Organization Science, Vol.15, No.6, pp. 645-656, 2004. https://doi.org/10.1287/orsc.1040.0080
This article is published under a Creative Commons Attribution-NoDerivatives 4.0 Internationa License.