
Research Paper:
Computational Analysis of Information Asymmetry in Scientist–Student Outreach Dialogues
Eriko Saito†

General Education Organization, Otemon Gakuin University
1-1 Oda Toshiba-cho, Ibaraki, Osaka 567-8620, Japan
†Corresponding author

This study quantitatively evaluates information asymmetry in science outreach dialogue between scientists and students using quantum-science outreach dialogue data. An information asymmetry index integrates the supply–reception ratio, linguistic weighting factors, and semantic distance between explanations and responses. Exogenous scenario simulations compare alternative explanation conditions under a re-explanation constraint. Variation in the index was associated primarily with explanatory supply. The association with comprehension-related responses was negative but not statistically significant, with uncertainty. Simulations produced different estimated levels and distributions of information asymmetry, although none of the simulated conditions satisfied the specified re-explanation constraint. Sensitivity analyses showed that index rankings were largely preserved across alternative weighting schemes and functional forms. These findings support evaluating expert–nonexpert dialogue by integrating quantitative supply–reception imbalance with semantic explanation–response mismatch. The framework supports computational comparison of explanation conditions, while empirical magnitudes and component contributions remain context dependent.
1. Background and Objective
Information asymmetry between experts and nonexperts has become increasingly important as scientific and technological knowledge grows more complex and specialized 1. This asymmetry becomes particularly relevant when experts must communicate specialized knowledge to nonexpert audiences in educational or public settings. Science outreach is a form of science communication in which experts explain research activities and scientific findings to nonexperts to promote their understanding and interest in science and technology 2. Science outreach includes interactive activities connecting scientists with students and other nonexpert audiences 3,4. In the present study, such dialogue is treated as a concrete setting for examining information asymmetry through the relationship between expert explanations and nonexpert responses. Highly specialized fields, such as quantum science and technology, are particularly relevant because differences in technical knowledge and conceptual familiarity can be substantial.
Previous research suggests that increasing the amount of information supplied by experts does not necessarily result in equivalent reception or understanding by nonexperts, particularly when prior knowledge, processing demands, and communicative resources differ between participants 5,6,7,8. Consequently, information asymmetry in science outreach is important not merely because experts and nonexperts differ in knowledge but also because these differences may produce mismatches between what is explained and what can be received, interpreted, and responded to.
These differences are particularly relevant in scientist–student outreach dialogue. Scientists have specialized conceptual structures, technical vocabularies, and established disciplinary schemas, whereas students generally have less-developed domain-specific knowledge. Accordingly, scientific explanations appropriate from a scientist’s perspective may not be equally accessible from a student’s perspective. A large amount of information, highly technical terminology, or abstract explanations may increase the communicative demands placed on students without producing a corresponding increase in understanding 5,6. At the same time, if students cannot sufficiently interpret an explanation, they may be less able to formulate questions, request clarification, connect new scientific information to prior knowledge, or provide responses that allow scientists to assess whether mutual understanding has been established 7,8. Such mismatches can allow information asymmetry to persist even when scientists and students are actively engaged in dialogue.
Science communication research has increasingly emphasized dialogue, engagement, participation, and public understanding rather than one-way transmission 9,10,11. However, the presence of dialogue does not demonstrate that explanatory supply has been matched by reception or that a shared meaning has been established. Although knowledge-transfer research has shown that knowledge generation and understanding depend on structural and relational conditions 12,13 and computational studies have demonstrated the applicability of text-based approaches to human communication data 14, the internal structure of information exchange within expert–nonexpert dialogue remains insufficiently quantified. In particular, empirical studies using dialogue data to examine the relationship between expert explanation and nonexpert response from both quantitative and computational perspectives remain limited.
This study aimed to quantitatively characterize information asymmetry in scientist–student outreach dialogues, examine its association with comprehension-related responses, and evaluate how alternative explanation conditions change the estimated level of information asymmetry. To achieve these aims, a computational framework was developed using observed dialogue data.
This study conceptualizes science outreach dialogue as a computational information structure characterized by supply–reception and explanation–comprehension relations. Within this structure, information asymmetry is defined as a combination of quantitative supply–reception imbalance and semantic mismatch between explanations and responses. This definition treats information asymmetry as a relational property of dialogue, rather than simply as a difference in knowledge possession or the absolute amount of expert speech. Quantitative imbalance captures the degree to which explanatory supply is disproportionate to observable student reception, whereas semantic mismatch captures the semantic distance between an explanation and a subsequent response.
2. Theoretical Framework
2.1. Information Asymmetry in Science Outreach
In this study, information asymmetry is conceptualized as a relational property of expert–nonexpert dialogue, rather than simply as a difference in the amount of knowledge the two parties possess. This conceptualization draws on research on information asymmetry, the knowledge-gap hypothesis, cognitive-load theory, grounding in communication, and communication accommodation theory.
Science communication research has moved from transmission and deficit models to interactive and participatory perspectives, emphasizing bidirectional engagement 9,10,11. However, the interaction itself does not establish whether information has been received or whether shared meaning has been achieved. This distinction motivates examining not only whether interaction occurs but also how explanatory information is supplied, received, and understood within dialogue. Within this broader field, science outreach provides an activity format in which scientific knowledge is communicated to educational and public audiences through interaction between experts and nonexperts 3,4.
In scientist–student communication, scientists possess specialized disciplinary knowledge, terminology, and conceptual structures that students have not necessarily acquired. However, unequal knowledge possession alone does not explain how asymmetry is observed in dialogue. Accordingly, this study focuses on how such differences appear in the relationship between explanatory supply and student reception, using scientist–student outreach dialogue as an empirical instantiation of the broader expert–nonexpert structure.
The knowledge-gap hypothesis provides a theoretical basis for distinguishing between information supply and reception. Tichenor et al. show that an increase in information supply does not necessarily result in equivalent knowledge acquisition among recipients with different informational and educational resources 5. Similarly, cognitive-load theory indicates that the processing demands imposed by information depend on prior knowledge and expertise 6. These perspectives suggest that the quantity and linguistic characteristics of expert explanations may not match an equivalent level of student reception. In the present framework, this relationship is represented by the supply–reception dimension. This dimension represents a quantitative imbalance between explanatory supply and observable reception rather than the absolute amount of expert speech.
A second theoretical basis is provided by research on grounding in communication. Clark and Brennan argue that successful communication requires interlocutors to establish sufficient evidence of mutual understanding 7. From this perspective, a student response can provide observable evidence of how the preceding scientific explanation has been received and interpreted. The semantic relationship between an explanation and its subsequent response is an observable indicator, rather than a direct measure of cognitive comprehension. In the present framework, this relationship is represented by the explanation–comprehension dimension.
Communication accommodation theory explains why linguistic characteristics are important in these relationships. Speakers can adapt their vocabulary, style, complexity, and other communicative features to their conversational partners 8. In science outreach, jargon density, abstraction, the use of metaphors and examples, and explanatory volume can therefore be interpreted as modifiable characteristics of explanatory supply. This theoretical perspective provides a basis for examining alternative explanation conditions in the subsequent analyses. These linguistic characteristics are treated as properties of explanatory supply rather than as independent dimensions of information asymmetry.
Accordingly, the present framework conceptualizes information asymmetry through two complementary dimensions: supply–reception, which represents a quantitative imbalance in information exchange; and explanation–comprehension, which represents the degree of semantic alignment or mismatch between an explanation and the subsequent response. At the operational level, these two dimensions are represented by the supply–reception ratio and semantic distance, respectively. Utterance volume and linguistic characteristics contribute to the supply–reception measure, whereas comprehension-related responses are treated as an observable outcome used to examine the empirical relevance of the information asymmetry measure. These dimensions provide a theoretical basis for the analytical measures introduced in Section 2.2. Based on this theoretical positioning, Table 1 summarizes the theoretical and conceptual framework, including its analytical subject, empirical instantiation, and outcome measure.
2.2. Measures for Information Asymmetry
2.2.1. Utterance Volume
Utterance volume is a basic quantitative indicator of explanatory activity in a dialogue 17. It is operationalized as the total number of words produced during science outreach interactions. It serves as an observable proxy for explanatory supply rather than being a direct measure of information or comprehension. Expert utterance volume indicates the amount of verbal material made available to the student, whereas student utterance volume provides an observable indication of verbal reception. Importantly, utterance volume alone is not interpreted as information asymmetry. Its relevance arises from the relationship between explanatory supply and observable reception, formalized through the supply–reception ratio.
| Category | Description | Theoretical basis |
| Theoretical background | Information asymmetry | Unequal access to and interpretation of relevant information 15,16. |
| Superordinate concept |
Science communication |
Expert–nonexpert communication has shifted from transmission toward dialogue and participation 9,10,11. |
| Activity format |
Science outreach |
Scientific knowledge is communicated to educational and public audiences 4. |
| Mediating mechanism |
Science dialogue |
Shared understanding is supported through grounding and communicative adaptation 7,8. |
| Analytical dimensions | Supply–reception (quantitative) Explanation–comprehension (qualitative) | Information supply does not necessarily produce proportional knowledge acquisition 5; processing demands vary by expertise 6; explanation–response alignment reflects grounding 7. |
| Analytical subject | Expert–nonexpert | Differences in knowledge and interpretive resources 5,6,11. |
| Empirical instantiation | Scientist–student | Observable expert–nonexpert outreach interaction 3. |
| Outcome measure | Comprehension-related responses | Observable responses provide evidence related to reception and grounding 7,11. |
2.2.2. Linguistic Characteristics
The linguistic characteristics of expert explanations can facilitate or hinder the processing and interpretation of scientific information by nonexperts 6,7,8,9,11. This study focused on three linguistic indicators: jargon density, abstraction ratio, and metaphors-and-examples ratio.
Jargon density refers to the proportion of technical terms used in expert explanations. The abstraction ratio indicates the extent to which explanations rely on abstract concepts and theoretical expressions. In contrast, the metaphors-and-examples ratio represents the proportion of explanatory expressions that connect abstract concepts to concrete examples, analogies, or prior knowledge. These indicators are treated as observable characteristics of explanatory supply, rather than as direct measures of comprehension or semantic alignment. From a cognitive-load perspective, jargon and abstraction may increase processing demands. By contrast, from a communication-accommodation perspective, changes in jargon, abstraction, and examples can be interpreted as modifiable characteristics of explanatory supply that define alternative explanation conditions 6,8.
2.2.3. Supply–Reception Ratio
The supply–reception ratio represents the relative imbalance between the weighted explanatory supply by experts and the observable verbal reception by nonexperts. The ratio is defined as the weighted explanatory supply divided by the observable reception. Weighted supply incorporates linguistic characteristics into the expert utterance volume, thereby reflecting both the quantity and characteristics of the explanation.
This ratio is motivated by the distinction between information provision and reception, as suggested by knowledge-gap and cognitive-load theories 5,6. In the present framework, reception is represented by an observable verbal response, rather than by directly measured knowledge acquisition. Accordingly, a large expert utterance volume is not treated as asymmetric by itself; asymmetry arises when explanatory supply becomes disproportionate to the corresponding student’s response. Therefore, this indicator quantifies the relative imbalance between explanatory supply and observable reception in science outreach dialogues.
2.2.4. Semantic Distance
Semantic distance represents the degree of semantic alignment between an explanatory unit and its paired response unit. It is calculated within computationally constructed explanation–response pairs, rather than between arbitrary dialogue segments. A larger semantic distance indicates weaker semantic correspondence within the aligned pair and, therefore, a greater semantic mismatch between the explanation and the observable response 7.
Semantic distance is not interpreted as a direct measure of cognitive comprehension. Rather, drawing on grounding theory, it serves as an observable indicator of how closely a student’s response remains semantically connected to the preceding explanation. Because the comparison is restricted to computationally constructed explanation–response pairs, the measure is intended to capture local explanation–response mismatch rather than general topical drift across the outreach dialogue.
2.2.5. Comprehension-Related Responses
Comprehension-related responses represent observable response patterns potentially related to reception and comprehension by nonexperts. In the present study, comprehension was not treated as a directly observable cognitive state. Instead, it was inferred from observable responses immediately following expert explanations 7,11. Accordingly, comprehension-related responses are operationalized as observable response-based indicators associated with comprehension, rather than direct measures of cognitive comprehension.
2.3. Research Questions
Based on the theoretical framework and analytical measures presented above, this study conceptualizes information asymmetry as an integrated structure consisting of two complementary dimensions: quantitative imbalance, represented by the supply–reception ratio, and semantic mismatch, represented by semantic distance.
The three research questions correspond to sequential stages of the proposed framework. The first stage concerns the construction of information asymmetry. Because the framework assumes that asymmetry cannot be represented solely by quantitative imbalance or semantic mismatch, it is first necessary to examine how the quantitative and semantic dimensions jointly constitute the proposed measure.
The second stage concerns the empirical relevance of the constructed measure. If the proposed information asymmetry measure represents a meaningful characteristic of scientist–student dialogue, then its association with observable comprehension-related responses should also be examined.
The third stage concerns the application of the framework to explanation design. Because scientists can potentially modify the explanatory volume and linguistic characteristics, scenario analysis can examine how alternative explanation conditions change the estimated level of information asymmetry.
Accordingly, the following research questions are proposed:
-
RQ1:
How do the supply–reception ratio and semantic distance jointly constitute the structure of information asymmetry in scientist–student dialogue?
-
RQ2:
How is information asymmetry associated with comprehension-related responses in scientist–student dialogues?
-
RQ3:
How do alternative explanation conditions change the estimated level of information asymmetry under simulated conditions?
Thus, the three research questions form a sequential structure, from measurement to empirical association to explanation design. The next section presents the analytical framework and computational model used to examine the research questions.
3. Methodology and Analytical Framework
3.1. Supply–Reception Operationalization
To operationalize the quantitative structure of supply–reception, the measures defined in Section 2.2 are formalized at the level of an explanation–response pair. The quantities defined below represent observable verbal proxies for explanatory supply and reception and should not be interpreted as direct measures of the amount of knowledge transmitted or acquired cognitively. Let a computationally constructed explanation–response pair consist of an explanatory unit and its paired response unit.
3.1.1. Utterance Volume
The utterance volume in pair \(i\) is defined in terms of the explanatory utterance volume \(n_{e}(i)\), and observable response volume \(n_{u}(i)\), as follows:
3.1.2. Linguistic Weighting Factors
Linguistic weighting factors represent the linguistic characteristics of the explanatory utterance of the expert. Jargon density is defined as \(J(i)\):
3.2. Supply–Reception Modeling
The utterance volume and linguistic weighting factors defined in Section 3.1 are integrated to formalize the supply–reception relationship in pair \(i\) through the ratio indicator \(\rho(i)\). A ratio formulation is used because the quantitative component of information asymmetry is relational; the analytical concern is whether weighted explanatory supply is disproportionate to observable student reception and not the absolute amount of expert speech. A ratio greater than one indicates relative explanatory oversupply, whereas a ratio below one indicates that explanatory supply does not exceed the modeled level of reception.
The reception volume \(R(i)\) is defined as
3.3. Semantic Distance Modeling
Semantic distance was introduced to represent the semantic alignment in the explanation–response relationship within each computationally constructed explanation–response pair. For pair \(i\), semantic distance \(\delta(i)\) is defined as
Smaller values of \(\delta(i)\) indicate stronger semantic alignment between explanation and response. Because the indicator is defined as one minus the cosine similarity, its theoretical range is \([0,2]\). The measure captures semantic correspondence within a computationally constructed explanation–response unit and is therefore conceptually distinct from general topical drift across the dialogue. It is not interpreted as a direct measure of comprehension; instead, it provides an observable semantic indicator related to the grounding between explanation and response 7. Unlike the supply–reception model, semantic distance directly evaluates the resulting semantic discrepancy between explanation and response and therefore does not incorporate linguistic characteristics such as jargon density or abstraction ratio.
3.4. Information Asymmetry Index
The supply–reception ratio \(\rho(i)\) and semantic distance \(\delta(i)\) are integrated to define the information asymmetry index for pair \(i\), denoted by \(AI(i)\):
In the baseline specification, equal weights are assigned to the two components (\(\lambda_{1} = \lambda_{2} = 1\)); alternative weighting specifications are examined in the sensitivity analysis. The additive formulation reflects the multidimensional conceptualization developed in Section 2.1, where the first component represents the relative imbalance between explanatory supply and observable reception, and the second represents semantic mismatch within a computationally constructed explanation–response pair. These components are treated as distinct but complementary sources of information asymmetry.
The quantitative component represents the relative communicative demand observable in the supply–reception relationship, whereas semantic distance represents explanation–response mismatch; neither is interpreted as a direct measure of cognitive load or cognitive distance. The positive-part transformation \(\max\{ \rho(i) - 1,0 \}\) reflects the empirical focus on expert-side oversupply; \(\rho(i) = 1\) represents quantitative balance, while values below one cannot offset semantic mismatch. Alternative functional forms were examined using sensitivity analysis.
The resulting index should not be interpreted as a measure of expert verbosity or general topical drift. Expert utterance volume contributes only relative to observable student reception, and the semantic distance is calculated only within computationally constructed explanation–response pairs. Thus, the index is designed to capture the relational imbalance within the constructed dialogue pairs, rather than the absolute amount of speech or general topic variation across the dialogue.
3.5. Model of Comprehension-Related Responses
Comprehension-related responses were formalized as probabilistic outcomes based on nonexpert responses observed immediately after the experts’ explanations. Following Section 2.2.5, comprehension was not treated as a directly observable cognitive state; instead, observable responses were used as response-based indicators related to comprehension. Accordingly, the model evaluates an observable, response-based outcome associated with comprehension, rather than directly estimating cognitive comprehension.
The outcome variable was defined as a binary variable, \(y_{cat}(i)\), where a response unit was coded as one when it contained predefined expressions indicating nonunderstanding or requests for clarification, repetition, or additional explanations related to the preceding explanatory unit. All other observable responses were coded as zero. Binary outcome coding was implemented computationally in Python using the same predefined lexical criteria for all explanation–response pairs and did not involve independent manual coding by multiple annotators. To evaluate the association between the information asymmetry index and comprehension-related responses, the following binomial logit model was constructed:
For interpretability, \(AI(i)\) was standardized to a mean of zero and a standard deviation of one before estimation. The estimated probabilities obtained from this model were subsequently used to evaluate the re-explanation constraint in the scenario analysis.
3.6. Analytical Model
The analytical framework was formulated to compare alternative explanation conditions with respect to the information asymmetry index \(AI(i)\) and the probability of re-explanation responses \(P( y_{cat}(i) = 1 )\). This formulation provides a formal structure for the scenario analysis described in Section 3.7.
3.6.1. Objective Function
For the analytical formulation, the objective is expressed as minimizing information asymmetry across the dialogue:
3.6.2. Re-Explanation Constraint
Additionally, the probability of a re-explanation response was evaluated using a comprehension-related response model. The following re-explanation constraint was assessed for each scenario:
3.7. Exogenous Scenario Simulation
The analytical framework was implemented as an exogenous scenario simulation of alternative explanation conditions, rather than as a strict mathematical programming problem. The scenarios were designed to evaluate how controlled changes in selected modifiable characteristics of explanatory supply change the estimated information asymmetry index, ceteris paribus. One explanatory factor was modified at a time, while all the remaining factors were held constant. Therefore, they should be interpreted as comparative simulations rather than estimates of causal effects on student comprehension.
For each scenario, the observed dialogue data served as the baseline condition. The modified information asymmetry index was then recalculated and compared to the baseline condition.
-
・
S1: Reduced jargon density scenario
\(J(i)\) is reduced by a fixed proportion from the observed baseline.
-
・
S2: Enhanced metaphors-and-examples scenario
\(M(i)\) is increased from the baseline condition subject to the constraint \(0\ \leq \ M(i)\ \leq \ 1\).
-
・
S3: Reduced weighted information supply scenario
\(n_{e}(i)\) is reduced by a fixed proportion from the observed baseline.
The information asymmetry index \(AI(i)\) was recalculated for each scenario using a modified explanation condition. The resulting information asymmetry levels and estimated probabilities of re-explanation responses were then compared across scenarios, and the satisfaction of the re-explanation constraint defined in Section 3.6 was evaluated. This procedure directly addresses RQ3 by examining how the alternative explanation conditions change the estimated level of information asymmetry under simulated conditions.
3.8. Sensitivity and Robustness Analysis
Sensitivity and robustness analyses were conducted using alternative weighting schemes, functional forms, and model specifications to assess whether the empirical findings depend on the specific construction of an information asymmetry index.
First, the relative weights \(\lambda_{1}\) and \(\lambda_{2}\) assigned to the quantitative supply–reception component and the semantic-distance component were varied from the baseline specification to examine whether the distribution and empirical behavior of \(AI(i)\) were sensitive to the weighting structure. The baseline specification used equal weights for the two components, and alternative specifications assigned relatively greater weights to either the supply–reception component or the semantic-distance component.
Second, alternative functional forms of the quantitative imbalance component were examined to assess whether the findings depended on the baseline positive-part specification, \(\max\{\rho,(i) - 10 \}\). In addition to the baseline formulation, alternative specifications based on the absolute deviation from the quantitative balance and absolute logarithmic deviation of the supply–reception ratio were evaluated. These alternative forms are used to determine whether the empirical results are robust to different representations of the quantitative imbalance.
Third, the comprehension-related response model was re-estimated using alternative predictor specifications. Specifically, four models were compared: (1) the integrated information asymmetry index \(AI(i)\), (2) the supply–reception ratio \(\rho(i)\) alone, (3) semantic distance \(\delta(i)\) alone, and (4) \(\rho(i)\) and \(\delta(i)\) entered separately in the same model. To facilitate comparisons across predictors measured on different scales, the variables were standardized before estimation. Model coefficients, odds ratios, confidence intervals, and model fit statistics were compared across specifications.
These analyses evaluated whether the principal empirical relationships were robust to alternative weighting structures, functional forms, and component-specific model specifications rather than being driven by a single specification of the proposed information asymmetry framework.
4. Empirical Analysis
4.1. Data Collection

Fig. 1. Science outreach dialogue at Takasaki QST.
The empirical analysis was based on a science outreach activity conducted on August 29, 2025 at the Takasaki Advanced Radiation Research Institute of the National Institutes for Quantum Science and Technology. An overview of this activity is provided in Fig. 1. The analysis used verbatim dialogue data on quantum science and technology collected from scientist–student interactions.
Quantum science was treated as a highly specialized scientific domain in which explanations frequently involve technical terminology, abstract concepts, and domain-specific knowledge. Dialogue data were collected in Japanese during a single outreach event conducted at a single research institution. The experts comprised three researchers affiliated with the institute, whereas the nonexperts comprised three junior high school students in Japan. Thus, the empirical setting comprised three scientists and three junior high school students interacting within the specific context of Japanese language science outreach. All researchers regularly participated in outreach activities. Experienced researchers were selected to reduce the variation attributable to differences in prior outreach experience and to provide a relatively consistent empirical setting for the analysis of information asymmetry. Accordingly, the present dataset represents interactions involving scientists with prior outreach experience rather than scientists with heterogeneous levels of outreach experience. Hereafter, the terms “scientist” and “student” refer to experts and nonexperts, respectively.
The outreach activity lasted approximately 2.5 hours and was recorded using two professional video cameras. The recorded dialogues were automatically transcribed using transcription software. The automatically generated transcripts were subsequently checked against video recordings for accuracy by four individuals: two authors, a researcher who participated in the outreach activity, and a junior high school student who participated in the activity. Errors identified during this verification process were corrected before the corpus was used for analysis. Administrative instructions and utterances occurring during break periods were excluded, whereas all substantive scientist–student dialogues recorded during the outreach activity were retained for analysis; no dialogue was selected or excluded based on its content or analytical outcome. This verification concerned only transcription accuracy and did not involve the computational segmentation, alignment, or outcome coding used to construct the analytical dataset. The subsequent manual validation of a sample of computationally constructed pairs is described in Section 4.3.
4.2. Terminology Dictionary Creation
This section describes the construction of lexical dictionaries for calculating the jargon density, abstraction ratio, and metaphors-and-examples ratio.
A technical terminology dictionary was developed using a two-stage procedure to ensure domain relevance and empirical adequacy. First, higher-level conceptual terms used in policy contexts were extracted from official government materials on quantum science and technology published by MEXT 2. Second, frequently occurring scientific and technical terms were identified through a morphological analysis of the verbatim dialogue corpus. The candidate terms were reviewed for content validity by the two participating scientists, and the final vocabulary set was determined. The dictionary includes higher-level conceptual terms, such as quantum, atom, electron, superposition, entanglement, and computer, as well as scientific and technical terms, such as beam, bit, sensing, measurement, communication, network, radiation, acceleration, volt, ion, light, space, sensor, magnetic field, diamond, defect, nitrogen-vacancy (NV) center, spin, crystal, and photon. The abstraction term dictionary was constructed from abstract nouns that did not directly denote concrete entities, including concepts, theories, principles, and states. The metaphors-and-examples dictionary was constructed from fixed Japanese expressions indicating analogy or exemplification, including expressions corresponding to “analogous to” and “like.”
No vocabulary items were added outside the two-stage procedure described above. Candidate terms identified from the official materials and dialogue corpus were reviewed using the same content validation procedure before the final dictionaries were established. Accordingly, \(J(i)\), \(A(i)\), and \(M(i)\) were consistently calculated from the resulting fixed dictionaries for all utterances.
4.3. Data Preprocessing
The verbatim dialogue corpus (57,161 characters) was segmented into utterance units, and 73 explanation–response pairs were computationally constructed according to the dialogue sequence. The preprocessing and construction of the analytical dataset were implemented using Python 3.13.15. For preprocessing purposes, each computationally constructed pair was operationalized as an explanation–response unit consisting of an explanatory unit and its paired response unit. For each utterance, the word count and jargon density were calculated and used as utterance-level features for two-cluster \(K\)-means classification. For each cluster, a combined score based on the mean word count and mean jargon density was calculated. The cluster with the higher score was operationally classified as the EXPLAINER role, whereas the other cluster was classified as the UNDERSTANDER role. An explanation–response pair was then constructed when an utterance classified as EXPLAINER was immediately followed by an utterance classified as UNDERSTANDER in the dialogue sequence. When this sequence was not observed, the procedure advanced by one utterance, and the next adjacent pair was evaluated. The same computational rules were applied consistently throughout the corpus. Brief acknowledgments and other short student responses were retained as observable responses and included in the analysis, whereas utterances unrelated to the substantive science outreach dialogue were excluded.
Because segmentation and alignment were implemented computationally using the same predefined rules throughout the corpus rather than through independent manual annotation by multiple human annotators, the inter-annotator agreement was not calculated. As an additional validation check, 20 of the 73 computationally constructed pairs were randomly sampled and jointly reviewed by four individuals: two authors, a researcher who participated in the outreach activity, and a junior high school student who participated in the activity. This review was conducted to validate computationally generated pairs and was not used as an independent manual annotation procedure for pair construction. All sampled explanation units were judged to be appropriate (20/20, 100%), 16 of the 20 response units (80.0%) were judged to represent appropriate student responses, and 19 of the 20 pairs (95.0%) showed appropriate sequential correspondence. Fifteen of the 20 sampled pairs (75.0%) satisfied all three criteria. These discrepancies primarily involved cases where the continuation of a scientist’s explanation was computationally classified as the response unit. Thus, although some misclassifications remained in the identification of response units, the computational procedure generally preserved the intended explanation–response structure.
Morphological analysis was applied to each utterance to construct a pair for calculating the explanatory utterance volume \(n_{e}(i)\) and response utterance volume \(n_{u}(i)\). Based on the lexical dictionaries constructed in Section 4.2, \(J(i)\), \(A(i)\), and \(M(i)\) were calculated for explanatory units. Semantic vectors were generated for each utterance to obtain semantic distance \(\delta(i)\). Finally, the information asymmetry index \(AI(i)\) was constructed by integrating \(\delta(i)\) with the supply–reception ratio \(\rho(i)\). The resulting dataset was used for empirical analysis.
4.4. Basic Statistical Measures
This section reports the summary statistics and distribution characteristics of the analytical variables across the computationally constructed explanation–response pairs. These descriptive results provide a context for subsequent analyses.
| Variable | M | SD | Min | Med | Max |
| \(\boldsymbol{n_e(i)}\) | 109.79 | 41.16 | 75 | 99 | 365 |
| \(\boldsymbol{n_u(i)}\) | 42.92 | 22.73 | 2 | 46 | 74 |
| \(\boldsymbol{n_e(i)/n_u(i)}\) | 5.06 | 8.82 | 1.15 | 2.24 | 67.00 |
4.4.1. Supply–Reception Volume
Summary statistics for the utterance volume are reported in Table 2. The distribution of the scientist’s utterance volume \(n_{e}(i)\) is shown in Fig. 2.
The mean of \(n_{e}(i)\) was 109.8 words (SD \(= 41.2\), median \(= 99\)). Observations were concentrated around 100 words, whereas frequencies gradually decreased toward 150 words. A small number of observations exceeded 200 words, indicating that some explanatory units were substantially longer than others.
The distribution of student utterance volume \(n_{u}(i)\) is shown in Fig. 3. The mean number of words was 42.9 words (SD \(= 22.7\); median \(= 46.0\)). While short responses of approximately 0–30 words were observed, a concentration of responses was also found in the range of 35–75 words, suggesting a substantial variation in response length among students.
The distribution of the word-count ratio \(n_{e}(i) / n_{u}(i)\) is shown in Fig. 4. The mean ratio was 5.1 (SD \(= 8.8\); median \(= 2.2\)). Although most observations were concentrated within a relatively limited range, a small number of extreme values appeared in the right tail. The maximum value was 67.0, indicating cases in which explanation volume exceeded response volume.
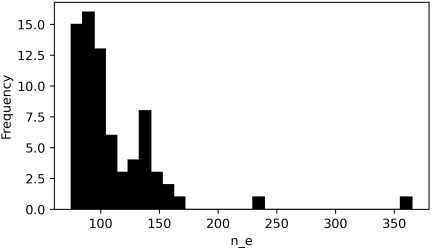
Fig. 2. Distribution of scientist utterance volume.
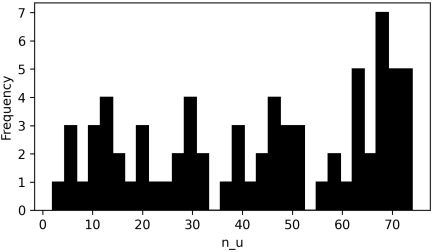
Fig. 3. Distribution of student utterance volume.
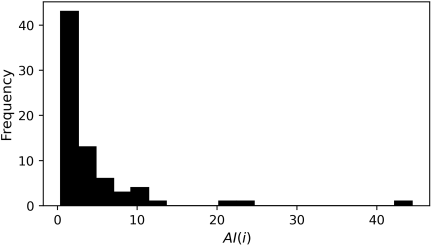
Fig. 4. Distribution of utterance volume ratio.
4.4.2. Supply–Reception Weighting Factors
The summary statistics for the linguistic weighting factors \(J(i)\), \(A(i)\), and \(M(i)\) are reported in Table 3. Because the values were relatively small, all statistics were reported to two decimal places.
The mean of \(J(i)\) is 0.03, while the maximum value reaches 0.15, indicating variation in the use of technical terminology across scientist–student pairs. By contrast, both \(A(i)\) and \(M(i)\) have median values of zero. This suggests that abstract terminology and metaphorical or example-based expressions appear infrequently in many explanations. Technical terminology is observed more consistently than abstraction-related or analogic/example-based expressions.
| Variable | M | SD | Min | Med | Max |
| \(\boldsymbol{J(i)}\) | 0.03 | 0.03 | 0.00 | 0.02 | 0.15 |
| \(\boldsymbol{A(i)}\) | 0.00 | 0.00 | 0.00 | 0.00 | 0.02 |
| \(\boldsymbol{M(i)}\) | 0.00 | 0.00 | 0.00 | 0.00 | 0.01 |
| Variable | M | SD | Min | Med | Max |
| \(\boldsymbol{\rho(i)}\) | 4.53 | 6.30 | 1.13 | 2.27 | 44.67 |
| \(\boldsymbol{\delta(i)}\) | 0.57 | 0.20 | 0.22 | 0.59 | 1.12 |
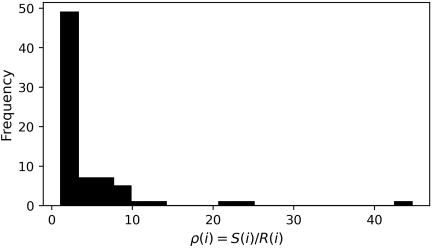
Fig. 5. Distribution of supply–reception ratio.
4.4.3. Supply–Reception Ratio and Semantic Distance
Summary statistics for the supply–reception ratio \(\rho(i)\) are reported in Table 4, upper panel, and its distribution is shown in Fig. 5. The ratio was calculated from the weighted explanatory supply and observable response volume, as defined in Section 3.
The mean value of \(\rho(i)\) is 4.53 (SD \(= 6.30\); median \(= 2.27\)). Most observations were concentrated in the lower range of the distribution, although all the observed ratios exceeded 1. The maximum value is 44.67, indicating a substantial relative explanatory oversupply in a small number of pairs.
Summary statistics for semantic distance \(\delta(i)\) are reported in Table 4, lower panel, and its distribution is shown in Fig. 6. The mean value of \(\delta(i)\) is 0.57 (SD \(= 0.20\); median \(= 0.59\)). Most observations fall within the range of 0.3–0.9. Nevertheless, several pairs exhibited values exceeding 1.0, with a maximum of 1.12. These observations indicate where semantic alignment between explanations and responses is relatively weak.
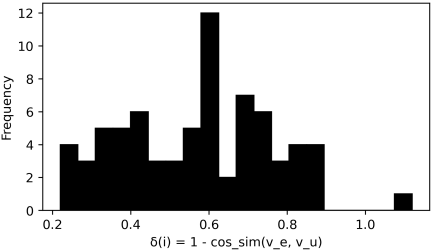
Fig. 6. Distribution of semantic distance.
| Variable | M | SD | Min | Med | Max |
| \(\boldsymbol{AI(i)}\) | 4.10 | 6.36 | 0.43 | 1.82 | 44.44 |
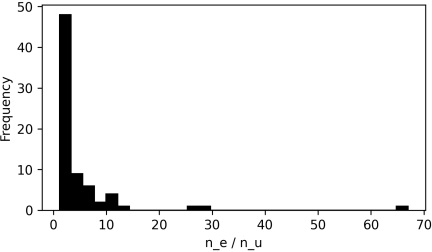
Fig. 7. Distribution of the information asymmetry index.
4.4.4. Information Asymmetry
The information asymmetry index \(AI(i)\) is calculated by integrating the supply–reception ratio and semantic distance. The summary statistics are reported in Table 5, and the distribution is shown in Fig. 7.
The mean value of \(AI(i)\) is 4.10 (SD \(= 6.36\); median \(= 1.82\)). Most pairs were concentrated in the lower range of the observed information asymmetry distribution. However, the maximum value reached 44.44, indicating the presence of a limited number of pairs characterized by substantially higher levels of information asymmetry. The distribution is strongly right-skewed, suggesting that severe information asymmetry is concentrated in a small subset of interactions rather than uniformly distributed across the dialogue corpus.
4.5. Model of Comprehension-Related Responses
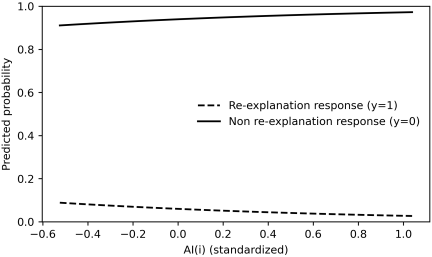
Fig. 8. Predicted probabilities of response outcomes across standardized \(AI(i)\).
| Variable | Odds ratio | 95% CI | \(\boldsymbol{p}\)-value |
| \(\boldsymbol{AI(i)}\) | 0.45 | \([0.04, 5.13]\) | 0.521 |
This section examines the association between the information asymmetry index \(AI(i)\) and comprehension-related responses using the binary logit model defined in Section 3.5. For interpretability, \(AI(i)\) is standardized before the estimation. Accordingly, the reported odds ratio represents the change in the odds of a re-explanation response associated with a one standard deviation increase in information asymmetry.
Figure 8 shows the predicted probabilities of the comprehension-related responses across the levels of standardized \(AI(i)\). As \(AI(i)\) increased, the predicted probability of a re-explanation response (\(y = 1\)) decreased, whereas the probabilities of the other responses (\(y = 0\)) increased. However, this pattern should be interpreted descriptively, because the estimated association involves substantial statistical uncertainty.
As reported in Table 6, the odds ratio associated with \(AI(i)\) is 0.45 (95% CI \([0.04, 5.13]\), \({p} = 0.521\)). The estimated coefficient indicates that higher levels of information asymmetry are associated with lower odds of re-explanation responses. However, the confidence interval was wide and included one, and the association was not statistically significant. Therefore, the present data do not provide sufficient evidence of a reliable association between the information asymmetry index and the re-explanation responses. The wide uncertainty is also consistent with the small number of observed re-explanation responses in the dataset.
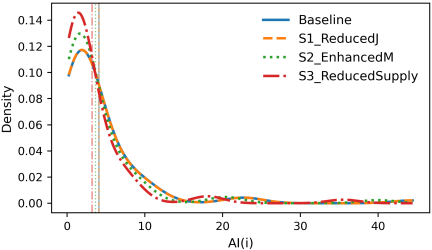
Fig. 9. Information asymmetry across scenarios.
| Scenario | Mean | Mean | Mean | Max |
| \(\boldsymbol{AI(i)}\) | \(\boldsymbol{\rho(i)}\) | \(\boldsymbol{\delta(i)}\) | \(\boldsymbol{P \left(y_\mathit{cat}(i)=1 \right)}\) | |
| Baseline | 4.10 | 4.53 | 0.57 | 0.0921 |
| S1 | 4.07 | 4.50 | 0.57 | 0.0921 |
| S2 | 3.65 | 4.08 | 0.57 | 0.0933 |
| S3 | 3.19 | 3.62 | 0.57 | 0.0943 |
4.6. Scenario Simulation Results
This section evaluates the changes in the information asymmetry index under the baseline condition and the three simulated explanation conditions. The evaluation was primarily based on the distribution and mean level of \(AI(i)\). To identify whether scenario differences originate from the quantitative supply–reception dimension or the semantic-distance dimension, changes in \(\rho(i)\) and \(\delta(i)\) are also examined. Additionally, the predicted probability of a re-explanation response, \(P(y_{cat}(i) = 1)\), was checked against a specified constraint level.
Figure 9 shows the kernel density distributions of \(AI(i)\) under the baseline condition and for each scenario. Under the baseline condition, the distribution exhibited a primary peak at lower values together with a long right tail, indicating the presence of a small number of pairs characterized by relatively high information asymmetry. The distribution under scenario S1 almost completely overlaps the baseline condition, suggesting that reducing jargon density alone produces only a limited change in \(AI(i)\). In scenario S2, the overall distribution remained similar to that of the baseline condition, although the peak shifted slightly and the distribution became smoother. This result suggests that a simulated increase in the metaphors-and-examples ratio yields a moderate reduction in estimated information asymmetry. Scenario S3 exhibited the most concentrated distribution and the highest peak density among all the scenarios. This result indicates that reducing the weighted information supply compresses \(AI(i)\) to a narrower range and produces the largest overall reduction.
Table 7 reports the mean values of \(\mathit{AI}(i)\), \(\rho(i)\), and \(\delta(i)\) together with the maximum predicted probability of a re-explanation response. The mean value of \(\delta(i)\) remains unchanged across all scenarios, indicating that differences in \(\mathit{AI}(i)\) are primarily attributable to changes in the quantitative supply–reception dimension rather than the semantic explanation–comprehension dimension. Compared with the baseline condition, both S2 and S3 reduce the mean value of \(\mathit{AI}(i)\), while S3 additionally reduces mean \(\rho(i)\). These results indicate that adjustment of information supply changes the quantitative component of the estimated information asymmetry index. In contrast, S1 produces only marginal changes in both mean \(\mathit{AI}(i)\) and mean \(\rho(i)\), suggesting that reducing jargon density alone has a limited influence on the objective function. Although all three scenarios reduced mean information asymmetry to varying degrees, none satisfied the specified re-explanation constraint. The maximum predicted probability of a re-explanation response exceeded the specified constraint level of \(\varepsilon=0.05\) under all conditions, including the baseline and the three simulated scenarios.
Overall, S3 achieves the largest reduction in the mean information asymmetry, although the resulting distribution becomes more concentrated. By contrast, S2 yields a moderate reduction in mean information asymmetry while preserving a distributional structure closer to the baseline condition.
| Model | Predictor | OR [95% CI] | \(\boldsymbol{p}\)-value |
| M1 integrated AI | \(AI(i)\) | 0.45 \([0.04, 5.13]\) | 0.521 |
| M2 supply–reception | \(\rho(i)\) | 0.44 \([0.04, 5.46]\) | 0.525 |
| M3 semantic distance | \(\delta(i)\) | 0.85 \([0.34, 2.14]\) | 0.733 |
| M4 \(\rho(i) + \delta(i)\) | \(\rho(i)\) | 0.44 \([0.03, 6.59]\) | 0.556 |
| M4 \(\rho(i) + \delta(i)\) | \(\delta(i)\) | 0.99 \([0.37, 2.70]\) | 0.992 |
4.7. Sensitivity and Robustness Analysis
Sensitivity and robustness analyses show that the information asymmetry index is largely stable across alternative specifications. When the relative weights of the supply–reception and semantic-distance components were varied, Spearman rank correlations with the baseline index remained high (\(r_{s} = 0.971\)–0.995). Alternative functional forms produced a similar pattern; the absolute-deviation specification was identical to the baseline because all observations had \(\rho(i) > 1\). The absolute log-ratio specification also remained highly correlated with the baseline (\(r_{s} = 0.989\)).
The comprehension-related response model was then re-estimated using alternative predictors. As shown in Table 8, the integrated index produced \(\mathrm{OR} = 0.45\) (95% CI \([0.04, 5.13]\), \({p} = 0.521\)), while the supply–reception ratio alone produced a similar estimate (\(\mathrm{OR} = 0.44\), 95% CI \([0.04, 5.46]\), \({p} = 0.525\)). The semantic distance alone showed a weaker association (\(\mathrm{OR} = 0.85\), 95% CI \([0.34, 2.14]\), \({p} = 0.733\)). When \(\rho(i)\) and \(\delta(i)\) were entered separately, the estimate for \(\rho(i)\) remained negative, whereas the estimate for \(\delta(i)\) was close to null. Overall, the results suggest that the empirical pattern was primarily associated with the supply–reception component, although none of the associations were statistically significant, and the confidence intervals were wide.
5. Discussion
5.1. Discussion by Research Questions
RQ1 examined how the supply–reception ratio and semantic distance jointly constitute the structure of information asymmetry in scientist–student dialogues. The results indicate that in the present dataset, the quantitative supply–reception dimension contributed more strongly to the observed variation in information asymmetry than the semantic-distance dimension. Because the supply–reception ratio incorporates linguistic weighting factors, including jargon density, abstraction ratio, and metaphors-and-examples ratio, the proposed information asymmetry measure represents a multilayered structure that integrates quantitative imbalance and semantic mismatch.
RQ2 examined the association between information asymmetry and comprehension-related responses in scientist–student dialogue. The point estimate suggests a negative association between information asymmetry and re-explanation responses; however, this association is not statistically significant and is estimated with substantial uncertainty. Because comprehension-related responses are operationalized as response-based indicators rather than as direct measures of cognitive comprehension, this relationship should not be interpreted as a causal effect on students’ actual understanding.
RQ3 examines how alternative explanation conditions change the estimated level of information asymmetry under the simulated conditions. Scenario simulations showed that the estimated level of information asymmetry changed across alternative explanation conditions. Reduced information supply produced the largest decrease in average information asymmetry, whereas enhanced metaphors and examples achieved a moderate reduction while maintaining a distributional pattern closer to the baseline condition. However, none of the simulated conditions satisfied the specified re-explanation constraint. These results indicate that different modifications of explanatory conditions produce different estimated changes in information asymmetry, rather than demonstrating the causal effects of particular explanation conditions.
This study provides an analytical framework for evaluating explanation conditions through information asymmetry and offers theoretical and practical perspectives on quantitative imbalance and semantic mismatch in expert–nonexpert dialogue. However, these results should be interpreted within the empirical setting of the present study, which involved quantum science outreach between experienced scientists and junior high school students. The relative contributions of the supply–reception and semantic dimensions, their associations with comprehension-related responses, and the estimated changes under alternative explanation conditions may differ among scientific domains, learner age groups, levels of prior knowledge, and communication formats.
5.2. Theoretical and Practical Contributions
This study’s theoretical contribution is to conceptualize information asymmetry in science outreach dialogue as comprising a quantitative supply–reception imbalance and a semantic explanation–response mismatch. This perspective enables the quantitative representation of information asymmetry. Previous science communication research has emphasized the transition from transmission-oriented models to dialogue and participation 9,10,11, whereas the knowledge-gap hypothesis and cognitive-load theory have explained why increased information provision does not necessarily lead to a corresponding reception or understanding 5,6. Grounding and communication accommodation research has further emphasized the mutual understanding and adaptation of explanatory practices to conversational partners 7,8. The present study extends these perspectives by integrating quantitative supply–reception imbalance and semantic explanation–response mismatch within a single computational framework at the level of observable dialogue pairs. The proposed framework is intended to provide a conceptually transferable structure for analyzing expert–nonexpert dialogue; however, the relative contributions of its quantitative and semantic components should not be assumed to be identical across communication contexts.
From a practical perspective, the results indicate that the estimated information asymmetry changed not only with the amount of information supplied but also with changes in explanatory conditions. Scenario simulations show that different explanation conditions produce distinct estimated levels and distributions of information asymmetry. However, none of the simulated conditions satisfied the specified re-explanation constraint, indicating that reductions in the estimated information asymmetry were not accompanied by reductions in the predicted probability of re-explanation responses in the present model. Therefore, an evaluation of the explanation conditions should consider both the average level of information asymmetry and its distributional characteristics. Previous science outreach studies have examined scientists’ perceived communication skills in scientist–student chat activities 3 and their motivations and barriers to outreach participation 4. The present study complements this work by providing a computational means of comparing alternative explanatory conditions within observed scientist–student dialogue. These empirical patterns should be interpreted within the specific setting examined in this study, namely, Japanese-language quantum science outreach involving experienced scientists and junior high school students. The magnitude and relative order of the estimated changes under these conditions may differ in other scientific domains, age groups, levels of prior knowledge, and communication formats.
These findings suggest three implications for scientific outreach practice. First, reductions in explanatory supply may need to be combined with other forms of explanatory support. Visual and nonverbal communication are potential strategies for future studies rather than the direct findings of the present analysis. Second, excessive supplementary explanations may increase information asymmetry through information overload, underscoring the importance of selective content design, which is consistent with the broader theoretical concern that greater information supply does not necessarily produce proportional reception or understanding 5,6. Third, dialogue can provide observable feedback related to comprehension and may support the adjustment of the supply–reception and explanation–comprehension relationships, consistent with the grounding and communication-accommodation perspectives that emphasize observable feedback and adaptation 7,8.
The generalization of these practical implications requires replication across scientific domains, learner age groups, levels of prior knowledge, and communication formats, including individual and group dialogue and face-to-face and online settings. Such applications should also revalidate the domain-specific terminology, explanation–response segmentation, semantic distance measures, and the specification of alternative explanation conditions before using the framework across contexts.
Overall, this study provides an analytical framework that evaluates alternative explanation conditions through information asymmetry and offers both theoretical and practical perspectives for evaluating quantitative imbalance and semantic mismatch in expert–nonexpert dialogue. Therefore, its principal theoretical contribution is not the introduction of a new general theory of science communication, but the computational integration and operationalization of concepts previously treated separately across information asymmetry, knowledge-gap, cognitive-load, grounding, and communication-accommodation research. Accordingly, the framework’s broader applicability lies primarily in its analytical structure, whereas the empirical magnitudes and practical implications derived from this analysis remain specific to the investigated outreach context until further cross-context validation.
6. Conclusion
This study quantitatively evaluated information asymmetry in scientist–student outreach using data from a quantum science activity conducted at the Takasaki Advanced Radiation Research Institute, National Institutes for Quantum Science and Technology. An information asymmetry index was constructed by integrating the supply–reception ratio, linguistic weighting factors, and semantic distance. An analytical framework incorporating a re-explanation constraint was developed, and exogenous scenario simulations evaluated alternative explanation conditions.
The results indicate that information asymmetry in the present dataset was primarily associated with scientists’ explanatory supply, while its association with students’ comprehension-related responses was negative but not statistically significant and was accompanied by substantial uncertainty. The alternative explanation conditions produced different estimated levels and distributional patterns of information asymmetry, although none satisfied the specified re-explanation constraint. Sensitivity and robustness analyses showed that the relative ordering of the information asymmetry index was largely preserved across alternative weighting schemes and functional forms. Overall, these findings suggest that information asymmetry should be evaluated by integrating quantitative supply–reception imbalance with semantic explanation–response mismatch, while the observed empirical pattern in the present dataset was driven primarily by the supply–reception component.
This study provides a computational framework for evaluating information asymmetry in expert–nonexpert dialogues and comparing alternative explanation conditions. The framework may also support the quantitative analysis of other expert–nonexpert communication settings.
This study had several limitations. First, the analysis was based on a single Japanese-language quantum-science outreach activity involving three experienced scientists and three junior high school students. Therefore, the observed balance between the supply–reception and semantic-distance dimensions and the estimated changes under alternative explanation conditions may differ across scientific domains, learner groups, cultural and linguistic contexts, and interaction formats. Manual validation also indicated that the segmentation procedure may occasionally classify the continuation of a scientist’s explanation as a response unit, which should be considered when interpreting pair-level results. Second, comprehension-related responses were indirect indicators of comprehension, and only five re-explanation responses were observed among the 73 analyzed dialogue pairs, resulting in substantial uncertainty in the estimated model. Third, the analysis relies on static pair-level observations and does not fully capture temporal interaction processes. Fourth, the analytical framework and scenario simulations depend on assumptions regarding weighted information supply, parameter settings, and the re-explanation constraint. Future research should use larger and more diverse datasets, dynamic dialogue analyses, improved outcome measures, and refined model specifications. Cross-context validation should also examine the transferability of terminology dictionaries, explanation–response segmentation rules, semantic distance measures, and weighting structures across domains and participant populations.
Acknowledgments
The director and staff of the Takasaki Advanced Radiation Research Institute, National Institutes for Quantum Science and Technology (QST), are gratefully acknowledged for their support. Appreciation is also extended to the junior high school students who participated in the science outreach activity and contributed to the dialogue data analyzed in this research.
- [1] A. Irwin, “Risk, Science and Public Communication: Third-order thinking about scientific culture,” Bucchi and Trench (Eds.), “Routledge Handbook of Public Communication of Science and Technology,” Routledge, 2014. https://doi.org/10.4324/9780203483794
- [2] Ministry of Education, Culture, Sports, Science and Technology (MEXT), “Quantum Science and Technology,” (in Japanese). https://www.mext.go.jp/a_menu/shinkou/ryoushi/mext_01422.html [Accessed May 18, 2026]
- [3] S. Carroll and M. Grenon, “Practice makes progress: An evaluation of an online scientist–student chat activity in improving scientists’ perceived communication skills,” Irish Educational Studies, Vol.40, No.2, pp. 255-264, 2021. https://doi.org/10.1080/03323315.2021.1915840
- [4] N. C. Woitowich et al., “Assessing motivations and barriers to science outreach within academic science research settings: A mixed-methods survey,” Frontiers in Communication, Vol.7, Article 907762, 2022. https://doi.org/10.3389/fcomm.2022.907762
- [5] P. J. Tichenor, G. A. Donohue, and C. N. Olien, “Mass media flow and differential growth in knowledge,” Public Opinion Quarterly, Vol.34, No.2, pp. 159-170, 1970. https://doi.org/10.1086/267786
- [6] J. Sweller, “Cognitive load during problem solving: Effects on learning,” Cognitive Science, Vol.12, No.2, pp. 257-285, 1988. https://doi.org/10.1016/0364-0213(88)90023-7
- [7] H. H. Clark and S. E. Brennan, “Grounding in communication,” L. B. Resnick, J. M. Levine, and S. D. Teasley (Eds.), “Perspectives on Socially Shared Cognition,” pp. 127-149, American Psychological Association, 1991. https://doi.org/10.1037/10096-006
- [8] H. Giles, N. Coupland, and J. Coupland, “Accommodation theory: Communication, context, and consequence,” H. Giles, J. Coupland, and N. Coupland (Eds.), “Contexts of Accommodation: Developments in Applied Sociolinguistics,” pp. 1-68, Cambridge University Press, 1991. https://doi.org/10.1017/CBO9780511663673.001
- [9] B. Trench, “Towards an analytical framework of science communication models,” D. Cheng, M. Claessens, T. Gascoigne, J. Metcalfe, B. Schiele, and S. Shi (Eds.), “Communicating Science in Social Contexts,” pp. 119-135, Springer, 2008. https://doi.org/10.1007/978-1-4020-8598-7_7
- [10] M. C. Nisbet and D. A. Scheufele, “What’s next for science communication? Promising directions and lingering distractions,” American J. of Botany, Vol.96, No.10, pp. 1767-1778, 2009. https://doi.org/10.3732/ajb.0900041
- [11] T. W. Burns, D. J. O’Connor, and S. M. Stocklmayer, “Science communication: A contemporary definition,” Public Understanding of Science, Vol.12, No.2, pp. 183-202, 2003. https://doi.org/10.1177/09636625030122004
- [12] I. Nonaka and H. Takeuchi, “The Knowledge-Creating Company: How Japanese Companies Create the Dynamics of Innovation,” Oxford University Press, 1995.
- [13] L. Argote and E. Miron-Spektor, “Organizational learning: From experience to knowledge,” Organization Science, Vol.22, No.5, pp. 1121-1367, 2011. https://doi.org/10.1287/orsc.1100.0621
- [14] L. Liu, Q. Wang, and Y. Li, “Improved Chinese Sentence Semantic Similarity Calculation Method Based on Multi-Feature Fusion,” J. Adv. Comput. Intell. Intell. Inform., Vol.25, No.4, pp. 442-449, 2021. https://doi.org/10.20965/jaciii.2021.p0442
- [15] G. A. Akerlof, “The market for ‘lemons’: Quality uncertainty and the market mechanism,” The Quarterly J. of Economics, Vol.84, No.3, pp. 488-500, 1970. https://doi.org/10.2307/1879431
- [16] J. E. Stiglitz, “The contributions of the economics of information to twentieth century economics,” The Quarterly J. of Economics, Vol.115, No.4, pp. 1441-1478, 2000. https://doi.org/10.1162/003355300555015
- [17] M. Yeomans, F. K. Boland, H. K. Collins, N. Abi-Esber, and A. W. Brooks, “A Practical Guide to Conversation Research: How to Study What People Say to Each Other,” Advances in Methods and Practices in Psychological Science, Vol.6, No.4, 2023. https://doi.org/10.1177/25152459231183919
- [18] N. Reimers and I. Gurevych, “Sentence-BERT: Sentence Embeddings using Siamese BERT-Networks,” Proc. of the 2019 Conf. on Empirical Methods in Natural Language Processing and the 9th Int. Joint Conf. on Natural Language Processing (EMNLP-IJCNLP), pp. 3982-3992, 2019. https://doi.org/10.18653/v1/D19-1410
This article is published under a Creative Commons Attribution-NoDerivatives 4.0 Internationa License.