
Research Paper:
Self-Reported State Empathy in Response to Video Stimuli: Comparing the Measurement Characteristics of Cognitive and Affective Empathy
Miho Iijima
 and Shogo Matsuno†
Graduate School of Informatics and Engineering, The University of Electro-Communications
1-5-1 Chofugaoka, Chofu, Tokyo 182-8585, Japan
†Corresponding author

In this study, we propose an 8-item self-reported state empathy scale comprising four cognitive empathy (CE) and four affective empathy (AE) items to evaluate empathic responses to video stimuli on a per-trial basis and examine its measurement characteristics. For a scale to function as a state measurement, its scores must fluctuate according to the nature of the presented scene, rather than only with stable between-participant differences. Therefore, we had 10 participants repeatedly respond to 24 video stimuli and decomposed the variation in the resulting 240 trials into stimulus effects, participant effects, and residuals. We further conducted correlation analyses using the inclusion of other in the self (IOS) scale and emotion congruence as external criteria for AE and video accuracy rate as an external criterion for CE. In the AE subscale, 42.8% of the variance was attributed to stimulus effects and 8.9% to participant effects, and AE correlated positively with the IOS (r=.772) and emotion congruence (r=.308). Conversely, in the CE subscale, the participant effect (33.9%) exceeded the stimulus effect (12.0%), no positive correlation with the video accuracy rate was found, and the CE scores remained high even in incorrect emotion recognition trials. These results suggest that AE captures affective empathic responses that vary with video stimuli, whereas CE, whose internal consistency was low (α=.581), tends to reflect a subjective sense of understanding rather than objective recognition accuracy; the CE results should therefore be interpreted with caution. This study clarified the different measurement characteristics of self-reported CE and AE in state empathy measurement.
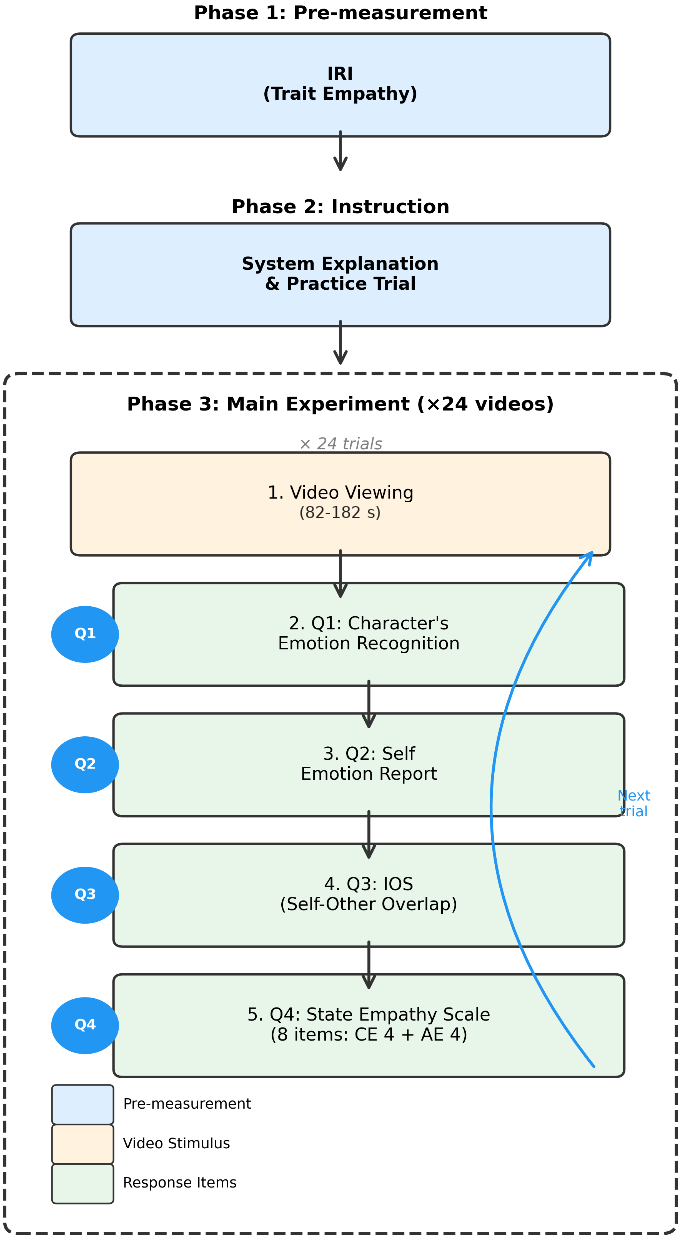
Experimental flow of a single trial
1. Introduction
Empathy is the mental process of recognizing the emotional state of others and responding to it 1,2. Empathy has two major aspects 1,3. One is cognitive empathy (CE), which refers to the process of inferring and understanding the emotions others are feeling 3,4. The other is affective empathy (AE), which refers to the process by which one experiences the same emotion as others 3,5. These two aspects, while related, are distinct processes, and it is important to handle CE and AE separately when measuring empathy 6,7.
Empathy measurement includes trait measurement, which assesses stable individual tendencies, and state measurement, which captures temporary responses to specific scenes 8. Trait scales such as Davis’s interpersonal reactivity index (IRI) 3 have been widely used to grasp individual differences in empathy. Conversely, in scenes such as video viewing, dialogue, and educational training, it is necessary to evaluate not only how empathic an individual generally is but also to what degree the person empathized at that moment with a specific stimulus or situation. Based on previous studies 9,10, we refer to the temporary empathic response that arises in response to a specific scene as state empathy.
If state empathy can be measured using self-reported psychological scales, empathic responses to differences in stimuli or scenes can be evaluated on a per-trial basis under controlled experimental conditions. However, to measure state empathy, it is insufficient to have participants respond to a questionnaire after a scene presentation. To function as a state measurement, it is necessary to demonstrate that scale scores fluctuate not only with the stable response tendencies of individual participants but also according to the nature of the presented scenes. That is, in the evaluation of state empathy scales, it is important to distinguish participant-driven differences due to “who responded” from scene differences due to “what was viewed.”
Although the development of state empathy scales has progressed, many studies have adopted designs in which each participant responds to only one or a few scenes 9,10,11,12,13,14. With such a design, it is difficult to evaluate separately whether the obtained responses originate from the nature of the scene or from the stable tendencies of the participant. Furthermore, although scales that include both CE and AE aspects have been proposed, whether each subscale captures the intended construct when measured as a state has not been sufficiently examined. In particular, regarding CE, the objective recognition accuracy of whether others’ emotions could be correctly recognized and the subjective sense of understanding that the participants felt they understood may be intermixed. Therefore, when treating CE and AE as state scales, it is necessary not only to measure both within the same framework but also to verify which external criteria each corresponds to.
Therefore, in this study, we propose an 8-item self-reported state empathy scale (SES) that evaluates CE and AE toward video stimuli on a per-trial basis and examine the measurement characteristics of the CE and AE subscales using an experimental design in which the same participants responded repeatedly to multiple video stimuli. Specifically, we posed the following three research questions:
-
RQ1:
Do the proposed scale scores fluctuate according to differences in video stimuli, rather than according to stable between-participant differences in response levels?
-
RQ2:
Do CE and AE subscales show consistent relationships with the corresponding external criteria?
-
RQ3:
Does the self-reported CE subscale reflect the objective recognition accuracy of others’ emotions, or does it reflect a subjective sense of understanding?
The contribution of this study lies in proposing a self-reported scale for measuring empathic responses to video stimuli on a per-trial basis and comparing the measurement characteristics of the CE and AE subscales using a repeated-measures design. By doing so, we clarified which aspects of self-reported state empathy measurement can be captured as stimulus-dependent state variations and which aspects have measurement limitations.
3. Proposed Method
In this section, we propose a self-report scale to evaluate CE and AE toward video stimuli on a per-trial basis and define an evaluation method to examine its measurement characteristics. The procedure in which a participant viewed one video and immediately responded to each indicator was defined as a single trial. Therefore, trial-level analysis refers to the analysis of 240 trials in which 10 participants responded to 24 videos. The scale and analysis methods defined in this section correspond to the research questions set in Section 1.
3.1. Composition of SES
3.1.1. Design Principles
Before designing the scale, we conducted a preliminary experiment to measure the state of CE. In the preliminary experiment, five adults responded to 24 video stimuli using provisional items created based on Davis’ 3 concept of perspective-taking, Hoffman’s 27 theory of empathic development, and Baron-Cohen et al.’s 28 theory of mind. These items were designed to measure CE from three aspects—perspective taking, situation understanding, and mental state inference—and the relationship with the four IRI subscales was examined.
Items intended for CE tended to be more strongly related to the subscale representing personal distress than to the perspective-taking subscale of the IRI. This result indicates that expressions encouraging self-projection may induce affective or self-focused responses rather than cognitive perspective taking. In addition, the preliminary experiment did not include items corresponding to AE; therefore, CE and AE could not be compared within the same framework. Furthermore, the manner in which item scores correspond to external criteria remained insufficiently examined.
Based on the above, we established the following three principles for scale design in this study. First, the scale was designed to evaluate CE and AE in the same trial. Second, in the CE items, expressions involving self-projection were avoided as much as possible, and focus was placed on understanding and inferring others’ situations and mental states. Third, based on the premise that the same participants would respond repeatedly to multiple video stimuli, the empathic responses for each trial were obtained in a comparable form.
3.1.2. Scale Items
The proposed SES consists of eight items: four CE items and four AE items (Table 2). Each item was answered on a 7-point Likert scale immediately after viewing the video. Following the literature 29, the response range was set from \(1 =\) “strongly disagree” to \(7 =\) “strongly agree,” and the average value of each subscale was taken as the final score.
| No. | Factor | Item content | Concept |
| SE1 | CE | I tried to put myself in the character’s position | Perspective taking |
| SE2 | CE | I could understand what kind of situation the character was in | Situation understanding |
| SE3 | CE | I could infer what the character was feeling | Mental state inference |
| SE4 | CE | I tried to see the events from the character’s viewpoint | Perspective shifting |
| SE5 | AE | I experienced the same emotions as the character | Emotional sharing |
| SE6 | AE | The character’s emotions were transmitted to me | Emotional contagion |
| SE7 | AE | I was emotionally moved by this video | Emotional arousal |
| SE8 | AE | I was concerned about the character | Empathic concern |
The CE items include items asking about attempts at perspective-taking and items asking about the subjective sense of achievement of understanding others’ situations and mental states. Specifically, SE1 and SE4 are effort-type items in the form of “I tried to …” that ask the degree to which the participant tried to take the other’s viewpoint. Conversely, SE2 and SE3 are achievement-type items in the form of “I could …” that ask the degree to which the participant felt able to understand the other’s situation or emotion. With this composition, the CE subscale was designed to include attempts to understand others and a subjective sense of achievement.
The CE subscale was deliberately composed of both item types for the following reason. CE is conceptualized as a process that includes both the attempt to take the other person’s perspective and the resulting understanding of the other person’s situation and mental state 3,27,28. Measuring only achievement-type items would conflate CE with confidence in one’s own understanding, whereas measuring only effort-type items would not capture whether understanding was subjectively attained; therefore, the two item types were included to cover the process from attempt to attainment. In this study, the four items were aggregated into a single CE score to obtain, for each trial, a summary rating of the attempt-to-attainment process in a form comparable to the AE score; this aggregation is an exploratory design choice rather than a claim that the four items form a homogeneous construct. As reported in Section 4.5, this composition also has consequences for the internal consistency of the subscale, which we treat as part of the measurement characteristics of self-reported CE.
AE items were adjusted to capture affective responses immediately after video viewing while referring to Shen’s 10 SES. SE5 and SE6 correspond to emotional sharing and emotional contagion, respectively, wherein one experiences the same emotion as the character. SE7 asks about the degree to which participants were emotionally aroused by the video. SE8 asks about empathic concern toward the character.
The scale proposed in this study does not aim to standardize a completed psychological scale following the full procedure proposed by Clark and Watson 30, which requires large-sample item analysis, factor-analytic replication, and test–retest evaluation, but rather to explore the characteristics that self-reported CE and AE scores for video stimuli show as state empathy measurement. Accordingly, internal consistency is examined as evidence of reliability (Section 4.5), and correspondence with the external criteria defined in Section 3.3, together with the analysis defined in Section 3.2, is examined as evidence of the intended state-sensitive nature of the scale rather than as a full validation of the scale.
3.2. Evaluation Policy as State Measurement
State empathy is a temporary empathic response that occurs in a specific situation. Its scores must fluctuate not only with the stable response tendencies of individual participants but also according to the nature of the presented video stimuli. From this perspective, we decomposed the total variation in scale scores into a component originating from differences in video stimuli, a component originating from systematic between-participant differences in response levels (hereafter, the participant effect), and a residual.
As an evaluation criterion corresponding to RQ1, we confirmed whether the variation component originating from the video stimuli exceeded that originating from the participant effect. That is, on a certain subscale, when the stimulus effect exceeds the participant effect, we interpret that subscale as capturing state-like variations according to the video stimuli, at least under the experimental conditions. However, when the participant effect exceeds the stimulus effect, the subscale may more strongly reflect participant-specific response tendencies than the state variation per scene.
Additionally, we treated the score sequences of each participant for the 24 videos as video profiles and confirmed the degree to which the profiles agreed across participants. If a scale captures responses according to the nature of the video stimuli, a common pattern would be expected to appear across different participants regarding which videos received higher and lower scores.
3.3. Selection of External Criteria
To examine RQ2, we set different external criteria for CE and AE. For AE, we used the inclusion of other in the self (IOS) and emotion congruence (EC) as indicators reflecting emotional synchrony and psychological proximity between the self and others. For CE, we used the video accuracy rate as an indicator of the recognition accuracy of others.
3.3.1. IOS
The IOS scale developed by Aron et al. 31 measures the psychological overlap between the self and others. From a diagram showing two circles representing the self and others with various degrees of overlap, participants selected the one closest to their current psychological distance. Tobari 9 used the IOS as an external criterion for state empathy during video viewing and reported its relationship with AE. In this study, the IOS was used as an indicator of psychological proximity to the character, and a positive correlation with the AE subscale was predicted.
3.3.2. EC
EC is an indicator that represents the degree to which the emotion profile of a character recognized by the participant agrees with the participant’s own emotion profile in each trial. In this study, we calculated the Pearson correlation coefficient between the character’s emotion intensity ratings and the self-emotion intensity ratings for the six emotions of anger, disgust, fear, joy, sadness, and surprise, and used this as the EC. Because AE includes the process of experiencing the same emotion as others, the AE subscale was predicted to show a positive correlation with EC.
3.3.3. Video Accuracy Rate
The video accuracy rate is an indicator of whether the correct emotion category label assigned to the video stimulus and the main emotion of the character selected by the participant match. In this study, for each trial, the correct answer was treated as 1 and the incorrect answer as 0. Based on the concept of empathic accuracy proposed by Ickes 32, since CE includes the process of inferring and understanding others’ emotions, if the CE subscale reflects objective emotion recognition accuracy, it is predicted to show a positive correlation with video accuracy rate. However, if the CE subscale reflects a subjective sense of achievement, then no correspondence with the video accuracy rate may be observed.
3.4. Analysis Methods
3.4.1. RQ1: Evaluation of State-Likeness
In RQ1, we examined whether the CE and AE subscale scores fluctuated according to differences in video stimuli, rather than stable between-participant differences in response levels. The data formed a fully crossed two-way design in which all 10 participants responded to all 24 video stimuli, yielding one observation per participant \(\times\) stimulus cell (240 trials in total). For each indicator (CE, AE, IOS, and EC), the total sum of squares across the 240 observations is decomposed into components associated with the stimulus main effect, the participant main effect, and the remaining residual variation: \(SS_{stim} = n_p \sum_{v} (\bar{x}_v - \bar{x})^{2}\), \(SS_{part} = n_v \sum_{p} (\bar{x}_p - \bar{x})^{2}\), and \(SS_{res} = SS_{total} - SS_{stim} - SS_{part}\), where \(\bar{x}_v\) and \(\bar{x}_p\) denote the mean score for video \(v\) and participant \(p\), respectively, \(\bar{x}\) is the grand mean, and \(n_{p}\) and \(n_{v}\) are the numbers of participants and videos. We reported each component as a proportion of the total sum of squares and confirmed whether the stimulus effect exceeded the participant effect. This decomposition explicitly separates systematic between-participant differences in the overall response level from systematic differences among video stimuli; it is a descriptive decomposition of the observed variation rather than a population-level variance-component model. Because only one observation is available for each participant–stimulus combination, the participant \(\times\) stimulus interaction cannot be estimated separately from other trial-specific unexplained variations and is therefore included in the residual component.
In addition, we created score sequences for the 24 videos of each participant and calculated the Pearson correlation coefficients across all participant pairs. Based on the average value of the obtained correlation coefficients, we confirmed whether high–low patterns of scores for the same videos were shared across participants.
To complement this decomposition, we computed intraclass correlation coefficients (ICCs) based on a two-way random-effects model, treating the 24 videos as targets and the 10 participants as raters; these ICCs quantified the extent to which participants showed a common profile across videos.
3.4.2. RQ2: Correspondence with External Criteria
For RQ2, we examined whether the CE and AE subscales showed consistent relationships with the corresponding external criteria. Targeting trial-level data, we calculated the Pearson correlation coefficients for all pairs of the CE, AE, IOS, EC, and video accuracy rates. For the interpretation of effect sizes, we referred to the criteria of Cohen 33, taking \(r = .10\) as small, \(r = .30\) as medium, and \(r = .50\) as large.
For the AE subscale, positive correlations between the IOS and EC were predicted. If the CE subscale reflects objective emotion recognition accuracy, a positive correlation with the video accuracy rate is predicted.
3.4.3. RQ3: Interpretation of CE Subscale
In RQ3, we examined whether the CE subscale reflected objective emotion recognition accuracy or a subjective sense of understanding. Specifically, we compared the distribution of CE scores between correct and incorrect emotion recognition trials. If the CE subscale reflects emotion recognition accuracy, then the CE scores in correct trials are predicted to be higher than those in incorrect trials. However, if CE scores remain high even in incorrect trials, the CE subscale may reflect the participant’s subjective understanding or sense of confidence rather than objective accuracy.
3.4.4. Internal Consistency
As supplementary analysis, we confirm the internal consistency of the CE and AE subscales by Cronbach’s \(\alpha\). However, since this study handles trial-level data in which the same participants respond to multiple videos, the \(\alpha\) coefficient is treated as a supplementary indicator showing consistency among scale items. Particularly, for the CE subscale, effort- and achievement-type items may reflect different response processes.
4. Evaluation Experiment
In this section, we describe the evaluation experiment using the SES proposed in Section 3. In this experiment, we examined whether the scores of the proposed scale show state-like variations according to video stimuli and how the CE and AE subscales relate to the corresponding external criteria.
4.1. Experimental Method
4.1.1. Video Stimuli
We used the empathy-eliciting video stimulus database (EMPAC) created by Ota et al. 34 as the video stimuli. EMPAC is a video set in which professional actors’ emotional expressions are recorded in six basic emotion categories: anger, disgust, fear, joy, sadness, and surprise. Each video was annotated with the correct label for the emotion category and time-series data of the emotion intensity. In this study, four videos were selected from each category, for a total of 24 videos. Each video lasted between 82 s and 182 s (\(M = 134.0\) s, \(\mathit{SD} = 36.2\) s). The mean (SD) durations by emotion category were 161.0 s (30.0 s) for anger, 106.0 s (26.0 s) for disgust, 138.0 s (35.0 s) for fear, 126.0 s (38.4 s) for joy, 157.0 s (33.1 s) for sadness, and 116.0 s (37.0 s) for surprise; the durations were determined by the source database and were not equated across categories. Although EMPAC also contains a neutral category, we excluded the neutral condition because the present experiment was designed around six explicitly expressed basic emotions; the emotion-rating items and the selection of the main emotion both used these six categories as response options, and neutral was not included as a response category.
4.1.2. Participants and Procedure
The participants were 10 adults (5 males, 5 females) whose native language was Japanese, recruited from the research team’s extended network between December 21, 2025, and February 9, 2026. The age distribution was as follows: three participants were in their 20s, three in their 30s, one in their 40s, one in their 50s, and two were aged 60 years or older. Each participant was assigned an anonymized ID from ID001 to ID010. All participants responded to all 24 videos, and a total of 240 trials of data were used for the analysis.
Before participation, all participants provided written informed consent electronically by checking the agreement checkbox on the web-based experimental system after reading the description of the study. The information presented to the participants included the purpose of the study, experimental procedures, the voluntary nature of participation, the right to withdraw at any time without disadvantage, handling and anonymization of data, and contact information for inquiries. No identifying personal information was collected, and participants were referred to only by anonymized participant IDs (ID001–ID010) throughout data collection, analysis, and reporting.
An experiment was conducted using a web-based measurement system. The measurement system was constructed using React and Firebase. Participants accessed the measurement system at a convenient place, viewed videos, and provided responses. The order of presentation of the 24 videos was randomized for each participant to suppress order effects.
After viewing one video in each trial, the participants provided responses in the following order. First, for character emotion recognition, participants rated the degree to which the character felt each of the six emotions of anger, disgust, fear, joy, sadness, and surprise on a scale of 1–9 and selected one main emotion. Second, for self-emotion, participants rated the degree to which they felt each of the six emotions on a scale of 1–9. Third, the psychological distance to the character was rated on a 7-point IOS scale. Fourth, the participants responded to the four CE items and four AE items of the proposed scale on a 7-point scale. The experimental procedure is illustrated in Fig. 1. Fig. 2 shows the screenshots of the web-based measurement system (video viewing and response screens).
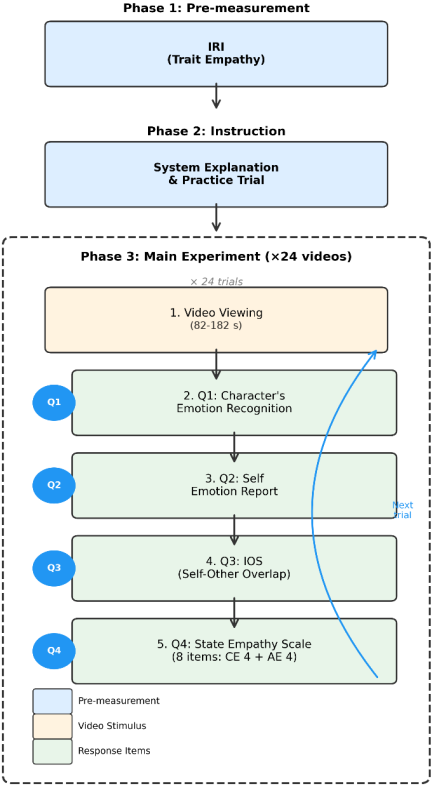
Fig. 1. Experimental flow. Each video lasted 82–182 s (\(M = 134.0\) s, \(\mathit{SD} = 36.2\) s); mean durations by emotion category ranged from 106.0 s (disgust) to 161.0 s (anger).
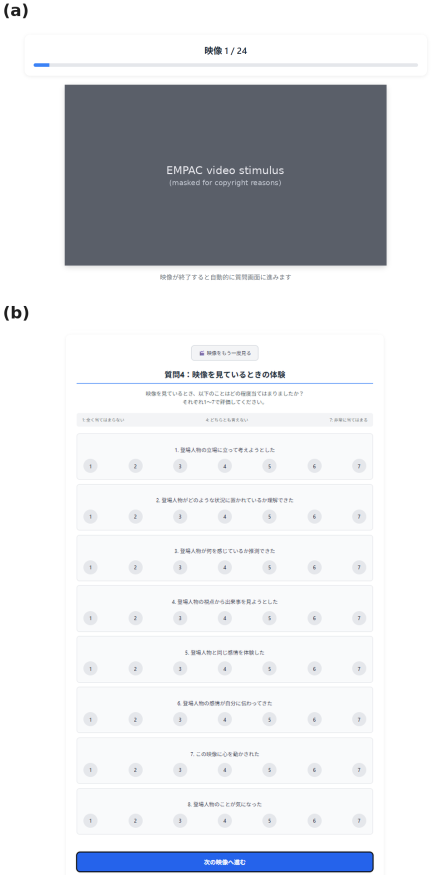
Fig. 2. Screenshots of the web-based experimental system: (a) video viewing screen (the video content is masked for copyright reasons), (b) response screen of the proposed state empathy scale.
4.2. RQ1: Do Scale Scores Fluctuate According to Video Stimuli?
In RQ1, we examined whether the proposed scale scores fluctuated according to differences in video stimuli rather than stable between-participant differences in response levels. We decomposed the total variation into stimulus effects, participant effects, and residuals for each indicator: CE, AE, IOS, and EC. The results are shown in Fig. 3.
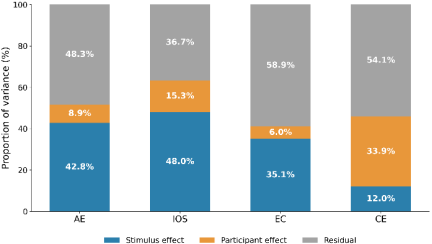
Fig. 3. Variance decomposition of each indicator (blue: stimulus effect, orange: participant effect, gray: residual).
For AE, 42.8% of the variance was attributed to stimulus effects, and the participant effect was 8.9%. The stimulus effect substantially exceeded the participant effect, with a stimulus effect/participant effect ratio of 4.81. Therefore, the AE subscale scores fluctuated according to differences in the video stimuli, rather than stable between-participant differences in the overall response level. Similar trends were observed for the IOS and EC, which were set as the external criteria for AE. For IOS, the stimulus effect was 48.0% and the participant effect was 15.3%, with a ratio of 3.14. For EC, the stimulus effect was 35.1% and the participant effect was 6.0%, with a ratio of 5.85.
In contrast, for CE, the participant effect was 33.9%, and the stimulus effect was 12.0%, with the participant effect exceeding the stimulus effect. The stimulus effect/participant effect ratio was 0.35. This result indicated that the CE subscale scores were more strongly determined by participant-specific response tendencies than by differences in video stimuli. In addition, the means of the four CE items were concentrated in the range of 6.10 to 6.56, and the standard deviation of CE for 7 of the 10 participants was 0.52 or less. An overall bias toward the high-score side and a small within-individual variation were observed in the CE scores.
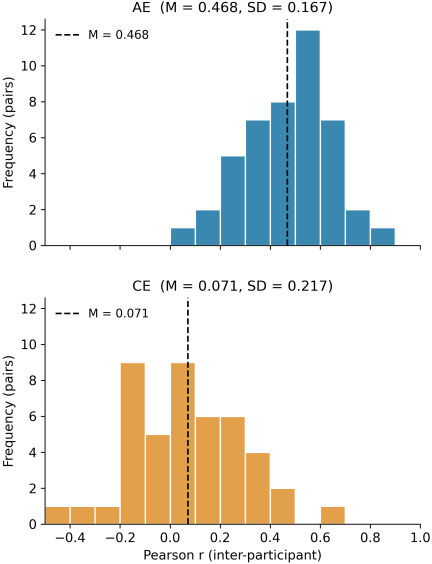
Fig. 4. Inter-participant correlations of video profiles (AE vs. CE).
Furthermore, by treating the score sequences of each participant for the 24 videos as video profiles, we calculated profile correlations across participants. The results are shown in Fig. 4. The inter-participant correlation of the AE video profiles was \(r = .468\) (\(\mathit{SD} = .167\)), confirming a moderate level of agreement. This indicates that there was a common pattern across the participants regarding which videos had higher and lower AE scores. In contrast, the inter-participant correlation of the CE video profiles was \(r = .071\) (\(\mathit{SD} = .217\)), with almost no correlation. This result indicates that the inter-video patterns of the CE scores were less likely to be shared across participants. As a supplementary index, ICCs based on the two-way random-effects model described in Section 3.4.1 showed the same contrast; the average-measure agreement on video-level profiles was high for AE (ICC(2,\(k\))\(= .861\)) but low for CE (ICC(2,\(k\)) \(= .393\)), with corresponding single-measure ICCs of \(.383\) and \(.061\), respectively.
In response to RQ1, while the AE subscale showed state-like variations according to the video stimuli, the trend was limited to the CE subscale.
4.3. RQ2: Do the Subscales Correspond to External Criteria?
In RQ2, we examined whether the CE and AE subscales showed consistent relationships with the corresponding external criteria. Targeting 240 trial-level data, we calculated the correlation coefficients of the CE, AE, IOS, EC, and video accuracy rate. The results are summarized in Table 3.
| CE | AE | IOS | EC | Accuracy | |
| CE | – | ||||
| AE | .487\(^{***}\) | – | |||
| IOS | .511\(^{***}\) | .772\(^{***}\) | – | ||
| EC | .141\(^{*}\) | .308\(^{***}\) | .385\(^{***}\) | – | |
| Accuracy | \(-.123\) | .006 | \(-.085\) | .004 | – |
\(^{*}\): \(p < .05\), \(^{**}\): \(p < .01\), \(^{***}\): \(p < .001\).
For AE, a strong positive correlation of \(r = .772\) (\(p < .001\)) was observed between AE and IOS. This corresponds to a large effect size according to Cohen’s 33 criteria. Furthermore, at the participant level, a strong positive correlation of \(r = .947\) (\(p < .001\)) was observed between AE and IOS (Fig. 5). In addition, a positive correlation of \(r = .308\) (\(p < .001\)) was confirmed between AE and EC, indicating a medium effect size. Therefore, the AE subscale showed associations in the same direction as both the IOS and the EC, which were set as external criteria for AE.
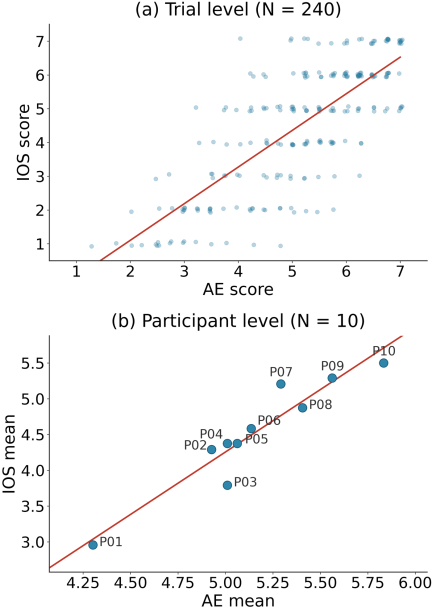
Fig. 5. Relationship between AE and IOS. (a) Trial level \(N = 240\), (b) participant level \(N = 10\).
However, for CE, the correlation between CE and the video accuracy rate was \(r = -.123\), and no significant positive correlation was observed. In contrast, CE showed a moderately positive correlation with the AE (\(r = .487\), \(p < .001\)) and a moderate positive correlation with IOS (\(r = .511\), \(p < .001\)). These correlations require careful interpretation; as shown in the variance decomposition, 33.9% of CE variance was attributable to participant effects, and a similarly large participant-driven component is present in IOS at the participant level (participant-level AE–IOS: \(r = .947\)). Therefore, the moderate trial-level associations between CE, AE, and IOS may partly reflect a shared participant-level tendency, namely that some participants consistently provided higher ratings across all self-report indicators, rather than scene-by-scene co-variation alone. From the above, in response to RQ2, while the AE subscale showed consistent relationships with external criteria related to AE, the CE subscale did not show correspondence with objective emotion recognition accuracy, and its associations with AE and IOS were more parsimoniously explained by common participant-level response tendencies.
4.4. RQ3: Does the CE Subscale Reflect Emotion Recognition Accuracy?
In RQ3, we examined whether the CE subscale reflected the objective recognition accuracy of others’ emotions or a subjective sense of understanding. Specifically, we compared the distribution of CE scores between correct and incorrect emotion recognition trials. The results are presented in Fig. 6.
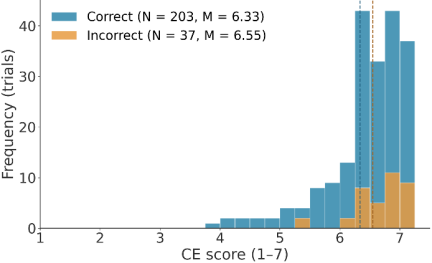
Fig. 6. Distribution of CE scores by correctness of emotion recognition.
Of the 240 trials, 203 were correct emotion recognition trials, and 37 were incorrect. The mean CE score in the correct trials was \(M = 6.3\)3, while the mean CE score in incorrect trials was \(M = 6.55\). Furthermore, of the 37 incorrect trials, the CE score was 6.5 or higher in 25. In other words, even in trials in which participants selected an emotion different from the emotion category assigned to the video, the CE scores remained high.
This indicates that the CE subscale does not directly reflect whether others’ emotions are objectively recognized correctly. Rather, this suggests that the CE subscale tends to reflect the degree to which participants subjectively felt that they “could understand the situation and emotions of the character,” that is, a subjective sense of understanding. However, because the CE subscale showed low internal consistency (Section 4.5), this interpretation should be treated with caution.
4.5. Internal Consistency
As supplementary analysis, we confirmed the internal consistency of the CE and AE subscales using Cronbach’s \(\alpha\). The Cronbach’s \(\alpha\) of the AE subscale was \(.791\), satisfying \(\alpha \geq .70\), which is generally considered an acceptable level in scale development 29,35. This result indicated that the four AE items consistently captured responses related to AE.
In contrast, the Cronbach’s \(\alpha\) of the CE subscale was \(.581\), below the acceptable level. This indicates that the four CE items did not easily form a single response. The CE items include effort-type items (SE1, SE4) and achievement-type items (SE2, SE3); effort-type items are likely to be fixed at high values regardless of the video content, whereas achievement-type items may fluctuate according to the ease of understanding of each video. Because the CE items thus include different response processes, this may have led to lower inter-item correlations and a low \(\alpha\) coefficient.
5. Discussion
5.1. The AE Subscale Captures State Variation According to Video Stimuli
In RQ1, we examined whether the proposed scale scores fluctuated according to differences in video stimuli rather than stable between-participant differences in response levels. In the AE subscale, 42.8% of the variance was attributed to stimulus effects, whereas the participant effect remained at 8.9%. In addition, the inter-participant correlation of video profiles was, on average, \(r = .468\), and a common pattern was observed across participants regarding which videos elicited higher and lower AE.
This result indicates that AE was more strongly determined by “what was viewed” than by “who responded.” Therefore, at least in the video-viewing task used in this experiment, the AE subscale can be interpreted as an indicator that captures state-like affective empathic responses according to video stimuli.
This is consistent with the theoretical understanding that AE is elicited by others’ emotional expressions and the emotional nature of the scene. From the perspective of emotional contagion, as theorized by Hatfield et al. 5, through contact with others’ emotional expressions, an observer is considered to experience the same or related affective responses. The AE subscale used in this study may reflect the strengths and weaknesses of such affective responses to video stimuli on a per-trial basis.
In contrast, on the CE subscale, the participant effect was 33.9% and the stimulus effect was 12.0%, with the participant effect substantially exceeding the stimulus effect. In addition, the inter-participant correlation of the video profiles remained at \(r = .071\), and almost no common video-dependent patterns were confirmed across participants. Thus, the CE subscale may have reflected participant-specific response tendencies more strongly than state-like variations per video stimulus. Throughout Sections 3–5, the participant effect denotes systematic between-participant differences in response levels estimated by variance decomposition, which is distinct from individual differences in trait empathy, as discussed in Sections 1 and 2. The results show that a substantial participant-attributable component exists in CE ratings, and the present design does not identify the sources of this component.
Therefore, in response to RQ1, although the answer was positive for AE, it was limited to CE. In self-reported state empathy measurement, it has been suggested that AE can be easily captured as a state variation according to video stimuli, while CE may not be easily captured as a state variation in the same format.
5.2. AE Corresponds to External Criteria, But CE Does Not Correspond to Emotion Recognition Accuracy
In RQ2, we examined whether the CE and AE subscales showed consistent relationships with the corresponding external criteria. For the AE subscale, AE–IOS showed \(r = .772\) (\(p < .001\)) and AE–EC showed \(r = .308\) (\(p < .001\)), confirming positive correlations in both cases.
The IOS represents the psychological proximity between the self and others, and EC represents the degree of agreement between the character’s emotion profile and the participant’s own emotion profile. The fact that the AE subscale consistently showed positive correlations with these external criteria suggests that the AE subscale captured responses related not merely to a preference for the video or attention but also to emotional proximity to the character and sharing of emotional states. Considering that Tobari 9 showed a relationship between state empathy and IOS, the results of this study can be regarded as also confirming the relationship between affective empathic responses to video stimuli and self–other merging in trial-level repeated-measures data.
By contrast, the CE subscale did not show a significant positive correlation with the video accuracy rate, which was set as an external criterion for CE. The correlation between CE and video accuracy rate was \(r = -.123\) and did not match the predicted direction. This indicates that self-reported CE scores do not directly reflect whether others’ emotions are objectively recognized correctly. Simultaneously, the CE showed moderately positive trial-level correlations with the AE (\(r = .487\)) and IOS (\(r = .511\)). However, given that 33.9% of the CE variance was attributable to participant effects and that AE and IOS were themselves strongly associated at the participant level (\(r = .947\)), these moderate trial-level correlations may be driven largely by shared participant-level response tendencies rather than by genuine scene-by-scene co-variation in CE.
That is, it was suggested that what the CE subscale measures is different from objective emotion recognition accuracy and may reflect a subjective sense of confidence, that is, the degree to which participants felt able, in their own way, to understand the character’s situation and emotions, even when they actually misrecognized the emotion category.
Therefore, in response to RQ2, the answer was positive for AE but negative for CE. While the AE subscale corresponds to external criteria related to AE, the CE subscale does not correspond to objective emotion recognition accuracy.
5.3. Does Self-Reported CE Reflect Subjective Sense of Understanding?
In RQ3, we examined whether the self-reported CE subscale reflected objective emotion recognition accuracy or a subjective sense of understanding. Comparison of CE scores between correct and incorrect trials revealed that the mean CE score in incorrect trials was \(M = 6.55\), exceeding \(M = 6.33\) in correct trials. This result indicates that even when participants selected an emotion different from the correct label of the video, they highly evaluated themselves as “able to understand” the character’s emotion and situation. Therefore, the CE subscale used in this study appeared to reflect a subjective sense of understanding rather than the objective emotion recognition accuracy proposed by Ickes 32.
CE is often defined as taking another person’s perspective or inferring another person’s mental state. However, when asking “whether one could understand” using a self-report scale, the obtained responses are influenced not by actual inference accuracy but by confidence and sense of understanding regarding the inference process. The weak relationship between empathy and empathic accuracy reported by Davis and Kraus 36 at the trait level was confirmed by a similar trend at the trial level.
Several alternative and complementary explanations for this pattern should be considered. First, the external criterion itself may not fully capture the CE construct. The video accuracy rate is based on agreement with a single predefined emotion category label, which is considerably narrower than understanding the character’s situation and mental state. Participants may therefore have understood the character’s situation to a substantial degree while selecting an emotion category different from the assigned label, and the absence of a CE–accuracy correlation may partly reflect this criterion mismatch rather than a property of the CE subscale alone. Second, CE scores were concentrated near the upper end of the scale (item means of 6.10–6.56), and this restricted variance may have statistically attenuated any correlation between CE and accuracy. Third, there were relatively few incorrect trials (37 of 240), which limited the sensitivity of the comparison between the correct and incorrect trials. Fourth, as noted in Section 4.5, the CE subscale mixes effort- and achievement-type items; because effort-type items can be highly endorsed regardless of whether the inference is correct, the subscale score as a whole may be biased toward high values. Finally, general response tendencies in self-reporting, such as acquiescence or self-enhancing evaluation of one’s own understanding, may also inflate CE ratings independent of the stimuli. These explanations indicate that self-reported CE scores in this format are shaped by factors other than objective recognition accuracy.
From the above, in response to RQ3, the results do not support interpreting the self-reported CE score as an indicator of objective emotion recognition accuracy. Instead, the pattern is consistent with the interpretation that the score primarily captures participants’ subjective appraisal of their own understanding. This result highlights a limitation of the present self-report format for assessing state CE, particularly when subjective effort and perceived attainment are combined into a single score.
5.4. Differences in Empathic Responses by Emotion Category
Given that the AE subscale showed state-like variations according to the video stimuli, we additionally examined the differences in empathic responses by emotion category. The results are presented in Fig. 7. For AE and IOS, differences by emotion category were observed, with high tendencies for sadness and fear and low tendencies for joy and anger. In particular, although the video accuracy rate was 100% for joy, the AE and IOS showed low values. This indicates that correctly recognizing a character’s emotion and emotionally synchronizing it with that emotion are different processes.
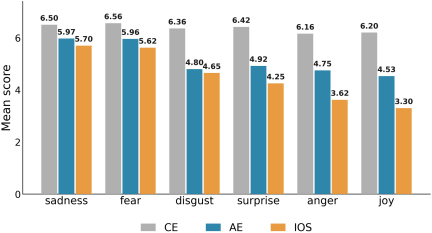
Fig. 7. Mean values of CE, AE, and IOS by emotion category.
In addition, AE was lower for anger than for the other emotion categories, suggesting that the participants may have found it more difficult to share the same emotion in response to angry stimuli. Anger expression can be processed by the observer not only as the empathic target’s emotion but also as a cue of threat or conflict. Therefore, in response to angry stimuli, defensive or avoidant responses may have arisen rather than emotional sharing. However, for fear, AE was high, which is also consistent with the finding of Öhman and Mineka 37 that threat-related stimuli easily elicit attention and emotional responses.
However, the analysis by emotion category in the present study was a supplementary analysis with a small number of 10 participants. Therefore, rather than concluding general trends of empathic responses by emotion category, additional evidence indicates that the AE subscale fluctuates according to the emotional nature of the video stimuli.
5.5. Limitations and Future Work
This study had several limitations. First, the number of participants was small (10), and all participants were recruited from the extended network of the research team, which may have introduced a selection bias. The repeated-measures design, in which the same participants responded to all 24 videos, secured information for estimating within-participant variation across stimuli; however, repeated measurements did not compensate for the limited number of participants when making participant-level population inferences. Participant-level results, including participant-level correlations, the estimated proportion of the participant effect, and trends by emotion category, should therefore be regarded as descriptive, and replication with a larger and more diverse sample is required. In addition, no statistically significant differences between male (\(n = 5\)) and female (\(n = 5\)) participants were detected in the participant-level means of CE, AE, IOS, or emotion recognition accuracy (Mann–Whitney U tests, all \(p \geq .290\)); however, given the very small subgroups, the statistical power of this comparison is very low, and this result should not be interpreted as evidence for the absence of sex differences.
Second, this study was based on self-reporting after video viewing and did not directly measure real-time variations in empathy. Therefore, the state empathy treated in this study is not moment-by-moment empathic variation during video viewing but trial-level empathic responses that were reported immediately after video viewing. Time-series measurements based on continuous ratings are required to examine when empathy increases within a video or how it changes temporally.
Third, this study targeted passive observation scenes using video stimuli and did not address empathy in two-way communication or face-to-face dialogue. While using video stimuli ensures the control of stimulus conditions and reproducibility, it cannot address changes in the participant’s own cognition and emotions that occur in actual interaction scenes in response to others’ reactions.
The response items in each trial were presented in a fixed order (character emotion recognition, self-emotion report, IOS, and CE/AE items). Because the order was not counterbalanced, order effects were completely confounded with measure type; for example, rating the character’s emotions first may have primed subsequent self-emotion and empathy ratings, and the IOS rating may have influenced the immediately following CE/AE responses. The size of such carryover effects cannot be estimated from the present data, and examining the robustness of the findings under counterbalanced or randomized item orders remains a task for future research.
Fourth, the composition of the CE subscale can be improved. Because the CE subscale included items asking about effort in perspective-taking and the sense of achievement of understanding, internal consistency was considered insufficient. Furthermore, the CE subscale showed a significant participant-level correlation with the IOS (\(r = .643\), \(p < .05\)), suggesting that both subscales partly capture stable interpersonal tendencies in addition to whatever state-specific variation they may carry. Therefore, in the future, it will be necessary to attempt measurements by dividing CE into different aspects such as a subjective sense of understanding, attempt at perspective taking, and emotion recognition accuracy. In addition, since the state measurement of CE includes aspects that are difficult to capture by self-reporting alone, examination of measurement designs that combine objective indicators remains a future task.
6. Conclusion
In this study, we proposed an 8-item self-reported SES comprising CE and AE subscales and examined their measurement characteristics using a repeated-measures design in which 10 participants responded to 24 video stimuli (240 trials). The contribution of this study lies in evaluating scale-score variation by separating stimulus effects from participant effects, thereby clarifying the differing measurement characteristics of the two subscales. The AE subscale captured state-like variation according to video stimuli and corresponded to external criteria of AE, whereas the variation in the CE subscale was dominated by the participant effect, and its scores were more consistent with a subjective sense of understanding than with objective emotion recognition accuracy, although the low internal consistency of the CE subscale means that this interpretation remains tentative.
These findings indicate that in self-reported state empathy measurement, AE can be captured as a stimulus-dependent state variation, whereas CE measured in the same self-report format is subject to limitations, particularly when subjective effort and perceived attainment are combined within a single score.
The main limitations are the small sample size (\(n = 10\)) recruited from the research team’s extended network, reliance on post-viewing self-reports, passive video-viewing settings, and fixed order of the response items within each trial, which leaves possible order effects unaccounted for. Therefore, the findings should be regarded as descriptive evidence obtained under the present experimental conditions and should not be generalized beyond this scope without replication. Future work will include replication with larger and more diverse samples under counterbalanced item orders, time-series measurement based on continuous rating, and measurement designs that combine self-reports with behavioral or physiological indicators to distinguish the subjective sense of understanding from objective emotion discrimination accuracy.
Data Availability The dataset supporting the findings of this study is openly available in the Zenodo repository. https://doi.org/10.5281/zenodo.20519693
Acknowledgments
We thank all the participants of the experiment. We thank Ota and colleagues for making the EMPAC video stimulus database available for research purposes. This work was supported by JSPS KAKENHI (Grant No.24K20878). During the preparation of this manuscript, the authors used Claude Opus 4.7 (Anthropic) for the purpose of translating the original Japanese text into English. The authors reviewed and edited the translated content and take full responsibility for the content of this article.
- [1] J. Decety and P. L. Jackson, “The Functional Architecture of Human Empathy,” Behavioral and Cognitive Neuroscience Reviews, Vol.3, Issue 2, pp. 71-100, 2004. https://doi.org/10.1177/1534582304267187
- [2] S. D. Preston and F. B. M. de Waal, “Empathy: Its ultimate and proximate bases,” Behavioral and Brain Sciences, Vol.25, Issue 1, pp. 1-20, 2002. https://doi.org/10.1017/S0140525X02000018
- [3] M. H. Davis, “Measuring individual differences in empathy: Evidence for a multidimensional approach,” J. of Personality and Social Psychology, Vol.44, No.1, pp. 113-126, 1983. https://doi.org/10.1037/0022-3514.44.1.113
- [4] D. Jolliffe and D. P. Farrington, “Development and validation of the Basic Empathy Scale,” J. of Adolescence, Vol.29, Issue 4, pp. 589-611, 2006. https://doi.org/10.1016/j.adolescence.2005.08.010
- [5] E. Hatfield, J. T. Cacioppo, and R. L. Rapson, “Emotional Contagion,” Cambridge University Press, 1994. https://doi.org/10.1017/CBO9781139174138
- [6] T. Singer and C. Lamm, “The Social Neuroscience of Empathy,” Annals of the New York Academy of Sciences, Vol.1156, Issue 1, pp. 81-96, 2009. https://doi.org/10.1111/j.1749-6632.2009.04418.x
- [7] J. Zaki and K. N. Ochsner, “The neuroscience of empathy: Progress, pitfalls and promise,” Nature Neuroscience, Vol.15, No.5, pp. 675-680, 2012. https://doi.org/10.1038/nn.3085
- [8] W. Fleeson and P. Gallagher, “The implications of Big Five standing for the distribution of trait manifestation in behavior: Fifteen experience-sampling studies and a meta-analysis,” J. of Personality and Social Psychology, Vol.97, No.6, pp. 1097-1114, 2009. https://doi.org/10.1037/a0016786
- [9] M. Tobari, “Predicting Empathy Arousing Process and Affective Outcome by Trait Empathy, Target Sex, and Psychological Overlap between Target and the Self,” The Japanese J. of Personality, Vol.13, Issue 2, pp. 143-155, 2005 (in Japanese). https://doi.org/10.2132/personality.13.143
- [10] L. Shen, “On a Scale of State Empathy During Message Processing,” Western J. of Communication, Vol.74, Issue 5, pp. 504-524, 2010. https://doi.org/10.1080/10570314.2010.512278
- [11] C. D. Batson, J. Fultz, and P. A. Schoenrade, “Distress and Empathy: Two Qualitatively Distinct Vicarious Emotions with Different Motivational Consequences,” J. of Personality, Vol.55, Issue 1, pp. 19-39, 1987. https://doi.org/10.1111/j.1467-6494.1987.tb00426.x
- [12] D. A. Johnson and M. J. Karcher, “Validity Evidence for a State-Specific Assessment of In-Session Counselor Empathy: The State-Empathic Concern Scale,” Measurement and Evaluation in Counseling and Development, Vol.52, Issue 4, pp. 284-296, 2019. https://doi.org/10.1080/07481756.2019.1594914
- [13] T. Levett-Jones, S. Lapkin, N. Govind, J. Pich, K. Hoffman, S. Y.-S. Jeong et al., “Measuring the impact of a ‘point of view’ disability simulation on nursing students’ empathy using the comprehensive state empathy scale,” Nurse Education Today, Vol.59, pp. 75-81, 2017. https://doi.org/10.1016/j.nedt.2017.09.007
- [14] M. Tobari and A. Oshio, “Measurement of Individual Differences in State Empathy and Examination of a Model in Japanese University Students,” Psych, Vol.5, Issue 3, pp. 928-947, 2023. https://doi.org/10.3390/psych5030061
- [15] T. Himichi, H. Osanai, T. Goto, H. Fujita, Y. Kawamura, M. H. Davis, and M. Nomura, “Development of a Japanese version of the Interpersonal Reactivity Index,” The Japanese J. of Psychology, Vol.88, Issue 1, pp. 61-71, 2017 (in Japanese). https://doi.org/10.4992/jjpsy.88.15218
- [16] S. Baron-Cohen and S. Wheelwright, “The Empathy Quotient: An Investigation of Adults with Asperger Syndrome or High Functioning Autism, and Normal Sex Differences,” J. of Autism and Developmental Disorders, Vol.34, No.2, pp. 163-175, 2004. https://doi.org/10.1023/B:JADD.0000022607.19833.00
- [17] R. L. E. P. Reniers, R. Corcoran, R. Drake, N. M. Shryane, and B. A. Völlm, “The QCAE: A Questionnaire of Cognitive and Affective Empathy,” J. of Personality Assessment, Vol.93, Issue 1, pp. 84-95, 2011. https://doi.org/10.1080/00223891.2010.528484
- [18] I. Dziobek, K. Rogers, S. Fleck, M. Bahnemann, H. R. Heekeren, O. T. Wolf, and A. Convit, “Dissociation of Cognitive and Emotional Empathy in Adults with Asperger Syndrome Using the Multifaceted Empathy Test (MET),” J. of Autism and Developmental Disorders, Vol.38, No.3, pp. 464-473, 2008. https://doi.org/10.1007/s10803-007-0486-x
- [19] P. Kanske, A. Böckler, F.-M. Trautwein, and T. Singer, “Dissecting the social brain: Introducing the EmpaToM to reveal distinct neural networks and brain-behavior relations for empathy and theory of mind,” NeuroImage, Vol.122, pp. 6-19, 2015. https://doi.org/10.1016/j.neuroimage.2015.07.082
- [20] J. Van der Graaff, W. Meeus, M. de Wied, A. van Boxtel, P. A. C. van Lier, H. M. Koot, and S. Branje, “Motor, affective and cognitive empathy in adolescence: Interrelations between facial electromyography and self-reported trait and state measures,” Cognition and Emotion, Vol.30, Issue 4, pp. 745-761, 2016. https://doi.org/10.1080/02699931.2015.1027665
- [21] Q. Zhao, D. L. Neumann, C. Yan, S. Djekic, and D. H. K. Shum, “Culture, Sex, and Group-Bias in Trait and State Empathy,” Frontiers in Psychology, Vol.12, Article No.561930, 2021. https://doi.org/10.3389/fpsyg.2021.561930
- [22] G. J. Depow and M. Inzlicht, “How Individual Differences in Empathy Predict Moments of Empathy in Everyday Life,” Personality and Social Psychology Bulletin, Vol.52, Issue 8, pp. 2529-2544, 2026. https://doi.org/10.1177/01461672251333823
- [23] K. Heyers, R. Schrödter, L. S. Pfeifer, S. Ocklenburg, O. Güntürkün, and U. Stockhorst, “(State) empathy: How context matters,” Frontiers in Psychology, Vol.16, Article No.1525517, 2025. https://doi.org/10.3389/fpsyg.2025.1525517
- [24] S. Zhang, G. Liu, and X. Lai, “Classification of Evoked Emotions Using an Artificial Neural Network Based on Single, Short-Term Physiological Signals,” J. Adv. Comput. Intell. Intell. Inform., Vol.19, No.1, pp. 118-126, 2015. https://doi.org/10.20965/jaciii.2015.p0118
- [25] X. Tao, H. Matsuo, and T. Hashimoto, “A Method of Empathy Robotics Based on Disgust,” J. Adv. Comput. Intell. Intell. Inform., Vol.26, No.6, pp. 1046-1052, 2022. https://doi.org/10.20965/jaciii.2022.p1046
- [26] J. A. Cranford, P. E. Shrout, M. Iida, E. Rafaeli, T. Yip, and N. Bolger, “A Procedure for Evaluating Sensitivity to Within-Person Change: Can Mood Measures in Diary Studies Detect Change Reliably?,” Personality and Social Psychology Bulletin, Vol.32, Issue 7, pp. 917-929, 2006. https://doi.org/10.1177/0146167206287721
- [27] M. L. Hoffman, “Empathy and Moral Development: Implications for Caring and Justice,” Cambridge University Press, 2000. https://doi.org/10.1017/CBO9780511805851
- [28] S. Baron-Cohen, A. M. Leslie, and U. Frith, “Does the autistic child have a “theory of mind”?,” Cognition, Vol.21, Issue 1, pp. 37-46, 1985. https://doi.org/10.1016/0010-0277(85)90022-8
- [29] R. F. DeVellis and C. T. Thorpe, “Scale Development: Theory and Applications,” 5th ed., Sage Publications, 2021.
- [30] L. A. Clark and D. Watson, “Constructing validity: Basic issues in objective scale development,” Psychological Assessment, Vol.7, No.3, pp. 309-319, 1995. https://doi.org/10.1037/1040-3590.7.3.309
- [31] A. Aron, E. N. Aron, and D. Smollan, “Inclusion of Other in the Self Scale and the structure of interpersonal closeness,” J. of Personality and Social Psychology, Vol.63, No.4, pp. 596-612, 1992. https://doi.org/10.1037/0022-3514.63.4.596
- [32] W. Ickes, “Empathic accuracy,” J. of Personality, Vol.61, Issue 4, pp. 587-610, 1993. https://doi.org/10.1111/j.1467-6494.1993.tb00783.x
- [33] J. Cohen, “Statistical Power Analysis for the Behavioral Sciences,” 2nd ed., Taylor & Francis, 1988. https://doi.org/10.4324/9780203771587
- [34] A. Ota, A. Nakane, S. Kumano, A. Murata, and S. Shimizu, “Validation study of empathy-eliciting video stimulus,” Proc. of the Human Communication Group (HCG) Symp. 2023, Paper A-4-3, 2023.
- [35] G. O. Boateng, T. B. Neilands, E. A. Frongillo, H. R. Melgar-Quiñonez, and S. L. Young, “Best Practices for Developing and Validating Scales for Health, Social, and Behavioral Research: A Primer,” Frontiers in Public Health, Vol.6, Article No.00149, 2018. https://doi.org/10.3389/fpubh.2018.00149
- [36] M. H. Davis and L. A. Kraus, “Personality and empathic accuracy,” W. Ickes (Ed.), “Empathic Accuracy,” Guilford Press, pp. 144-168, 1997.
- [37] A. Öhman and S. Mineka, “Fears, phobias, and preparedness: Toward an evolved module of fear and fear learning,” Psychological Review, Vol.108, No.3, pp. 483-522, 2001. https://doi.org/10.1037/0033-295X.108.3.483
This article is published under a Creative Commons Attribution-NoDerivatives 4.0 Internationa License.