
Research Paper:
Cluster-Based Learner Profiling in AI-Supported Educational Contexts: Evidence from Junior High School Students
Po-Hsin Su*,†
 , Yuan-Horng Lin*
, and Jin-Chang Hsieh**
*Department of Mathematics Education, National Taichung University of Education
No.140 Minsheng Road, West District, Taichung 403514, Taiwan
†Corresponding author
**Research Center for Testing and Assessment, National Academy for Educational Research
No.2 Sanshu Road, Sanxia District, New Taipei 237201, Taiwan

As artificial intelligence (AI) becomes increasingly embedded in educational settings, learner heterogeneity can no longer be adequately described through single-variable comparisons. This study identifies learner profiles in AI-supported educational contexts using three theoretically grounded feature dimensions: AI self-efficacy, digital literacy, and cross-disciplinary integration self-efficacy. These dimensions were operationalized using eight indicators reflecting students’ AI-related confidence, digital information-processing competence, and integrative learning readiness. Based on 8,022 valid responses from eighth-grade students in the collaborative database of the Taiwan Assessment of Student Achievement: Longitudinal Study and the Taiwan i-Generation Panel Study, available from the Survey Research Data Archive, Academia Sinica, all input indicators were normalized using Z-score scaling to construct a standardized feature space for distance estimation. A two-stage clustering procedure was adopted. First, two-step cluster analysis was performed to compare candidate solutions based on Akaike Information Criterion and Bayesian Information Criterion values; subsequently, K-means clustering was conducted with the number of clusters fixed at six to estimate the final learner profiles. The results supported six profiles: high-scoring integrated; very low-scoring; AI-moderate, digitally weak; broadly below-average; digitally adequate, AI-integration weak; and near-average balanced. The profiles showed that learner heterogeneity was not organized along a simple high–low continuum but appeared as asymmetric configurations within the multidimensional feature space. Post-clustering analyses further showed that digital-literacy indicators and AI evaluation had the largest descriptive between-profile separations, and that cluster membership differed significantly by gender. The findings extend AI literacy research from average-based comparisons to cluster-based learner profiling and provide a basis for differentiated educational support and data-driven decision-making in AI-related educational settings.
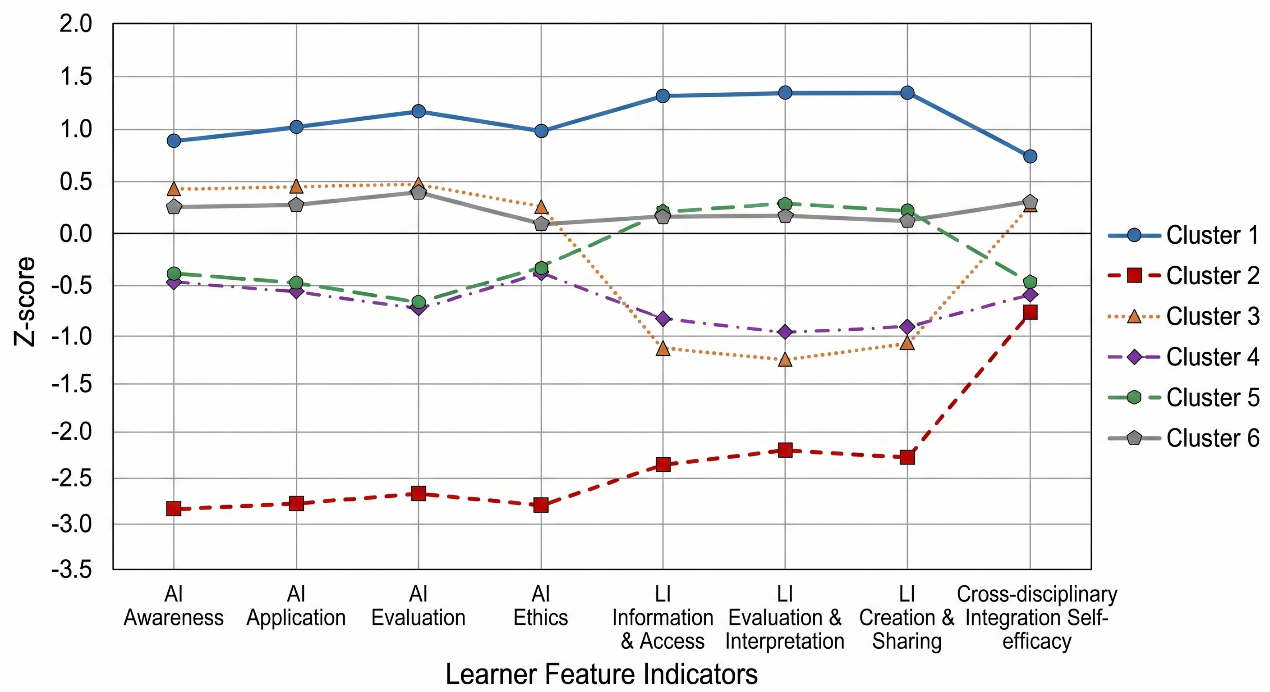
Standardized learner profiles
1. Introduction
Artificial intelligence (AI), which is becoming increasingly embedded in educational settings, is transforming the manner by which students access information, interpret digital content, complete academic tasks, and interact with learning technologies. In contrast to conventional digital tools, AI-supported systems generate probabilistic, adaptive, and context-sensitive responses. Consequently, students must not only operate digital devices but also evaluate AI-generated information, assess the reliability of responses, and integrate technological assistance into disciplinary learning tasks. Thus, AI literacy has become an important educational topic. Prior research has conceptualized AI literacy as a multidimensional competence involving knowledge, skills, attitudes, ethical awareness, and psychological readiness 1,2. Recent reviews further suggest that AI literacy in school contexts should be understood not only as technical knowledge but also as a learner-centered construct shaped by confidence, interpretation, evaluation, and responsible use 3.
However, learner differences in AI-supported educational contexts cannot be easily captured using a single variable. Students may demonstrate confidence in using AI but lack the digital literacy required to evaluate information. Others may possess adequate digital competence but feel uncertain when applying AI tools to academic or cross-disciplinary tasks. Therefore, understanding learner heterogeneity in AI-supported education requires a multidimensional approach that simultaneously considers the psychological, technical, and integrative features of learners. Herein, the term “AI-supported educational contexts” is used as a contextual framing for learner characteristics relevant to settings in which AI may be incorporated; notably, the data do not represent direct observations of students participating in a specific AI-supported instructional intervention.
In this study, learner heterogeneity is examined based on three dimensions: AI self-efficacy, digital literacy, and cross-disciplinary integration self-efficacy. AI self-efficacy reflects students’ perceived capability to understand, apply, evaluate, and ethically engage with AI-related knowledge and tools. This feature is grounded in the broader concept of self-efficacy 4 and recent studies on AI self-efficacy as a domain-specific construct 5. Digital literacy refers to students’ ability to access, evaluate, interpret, create, and share digital information. Existing frameworks and measurement studies emphasize that digital literacy is not merely an operational skill but a structured competence involving information evaluation, interpretation, and production 6,7. Cross-disciplinary integration self-efficacy refers to students’ perceived ability to connect knowledge, tools, and perspectives across domains. This feature is particularly relevant in AI-supported learning because students are required to relate AI-generated information to subject knowledge, task requirements, and broader problem contexts. Prior studies have shown that self-efficacy in cross-disciplinary or interdisciplinary learning is meaningful in complex learning contexts that require students to integrate multiple forms of knowledge and practice 8,9.
Although these three feature dimensions are conceptually related, they should not be assumed to develop in parallel. AI-supported learning requires students to combine confidence, digital information-processing competence, and integrative readiness. A learner may be strong in one feature dimension but weak in another. Therefore, average-based or variable-centered approaches may be insufficient. Mean comparisons, correlations, and regression models can describe general tendencies; however, they may obscure localized subgroup patterns within a multidimensional feature space. By contrast, cluster-based learner profiling enables the identification of recurring configurations in learner characteristics across multiple indicators.
This shift from variable-centered analysis to learner profiling is consistent with educational data mining and learning analytics research. Prior studies used clustering approaches to classify students based on learning features and support differentiated instructional strategies 10. Other studies combined clustering and profile analysis to interpret latent learner characteristics in educational settings 11. Additionally, studies using large-scale educational datasets demonstrated that explainable cluster analysis can reveal student profiles that cannot be easily identified through single-variable comparisons 12. These studies suggest that clustering is not only a statistical tool but also a useful framework for transforming educational data into interpretable learner models.
From a computational perspective, this approach can be understood as a standardized feature-space-based clustering framework. Careful feature engineering, scaling, and preprocessing are required before pattern recognition in educational data can be conducted meaningfully. Standardization is necessary to reduce the scale bias in distance-based clustering when multiple learner indicators are measured on different scales. Previous methodological studies demonstrated that variable standardization can affect cluster recovery and should therefore be integrated into clustering design 13. Additionally, when the number of learner profiles is unknown, cluster enumeration should be guided by transparent criteria. Two-step cluster analysis enables a comparison of candidate cluster solutions using information criteria such as the Akaike information criterion (AIC) and Bayesian information criterion (BIC), whereas \(K\)-means clustering can be subsequently applied to estimate the final cluster centers once the number of clusters has been determined 14,15,16.
Despite the increasing interest in AI literacy and AI-supported education, several research gaps remain. First, many studies have examined AI self-efficacy, digital literacy, or interdisciplinary self-efficacy separately without modeling how these features jointly characterize learners. Second, existing studies typically rely on average-based comparisons, which may overlook asymmetric learner configurations. Third, relatively few studies have applied a standardized feature-space approach to identify learner profiles among junior high school students in AI-supported educational contexts. Addressing these gaps may provide a more differentiated basis for instructional support tailored to learner profiles and data-driven educational decision-making.
To address these gaps, this study identifies learner profiles in AI-supported educational contexts using a large-scale dataset of eighth-grade students in Taiwan. Eight indicators representing AI self-efficacy, digital literacy, and cross-disciplinary integration self-efficacy were standardized into a common feature space. A two-stage clustering procedure was then adopted. First, two-step cluster analysis was performed to compare candidate solutions based on AIC and BIC values; subsequently, \(K\)-means clustering was conducted with the number of clusters fixed at six to estimate the final learner profiles. Next, indicator-based differentiation and gender differences in profile membership were examined.
This study contributes to AI-supported educational research in three ways. First, it extends AI literacy research from variable-centered comparison to cluster-based learner profiling. Second, it demonstrates how psychological, technical, and integrative learner features can be organized into interpretable profile structures within a standardized feature space. Third, it provides empirical evidence for educational decision support based on learner profiles by demonstrating that learner heterogeneity is better represented through multidimensional configurations than by a single overall score. Additionally, the identified profiles reveal asymmetric feature patterns between AI self-efficacy and digital literacy, which cannot be easily detected through average-based analysis alone.
3. Methodology
3.1. Data Source and Participants
This study used secondary data from the Taiwan i-Generation Panel Study and the Taiwan Assessment of Student Achievement: Longitudinal Study, both conducted in collaboration with the National Academy for Educational Research in Taiwan 21,22. The source project was designed to monitor the learning development of Taiwanese students in the digital generation. The baseline population was defined as students who entered the seventh grade in the 2022–2023 academic year. The student questionnaire data used in this study are available upon application from the Survey Research Data Archive (SRDA), Academia Sinica (Accession No.D00268).
The source project adopted a stratified two-stage cluster sampling design. Schools were sampled within explicit strata, including digital development region, school type, and indigenous-area school status. Subsequently, classes were sampled within the selected schools, and students in those classes were invited to participate. The schools were selected using systematic probability proportional to size sampling, thus maintaining coverage across different schools and regional contexts 23.
This study focused on eighth-grade students because the selected AI-related, digital literacy, and cross-disciplinary learning indicators are available at this grade level. The working dataset contained 8,968 cases. After listwise deletion of cases with missing values for any of the eight clustering input indicators, 8,022 valid cases were retained for analysis while 946 cases were excluded. As the study used anonymized secondary data, no direct intervention with students was conducted, and no personally identifiable information was analyzed.
| Feature dimension | Indicator used in analysis |
Standardized variable used for clustering |
Analytical meaning |
| AI self-efficacy | AI awareness | ZAI_1 |
Students’ perceived awareness and understanding of AI-related concepts |
| AI self-efficacy | AI application | ZAI_2 |
Students’ perceived capability to apply AI-related knowledge or tools |
| AI self-efficacy | AI evaluation | ZAI_3 |
Students’ perceived capability to evaluate AI-related information or outputs |
| AI self-efficacy | AI ethics | ZAI_4 |
Students’ awareness of ethical issues in AI use |
| Digital literacy | Data access and retrieval | ZLI_1 |
Students’ ability to access and retrieve digital information |
| Digital literacy | Evaluation and interpretation | ZLI_2 |
Students’ ability to assess, evaluate, and interpret digital information |
| Digital literacy | Creation and sharing | ZLI_3 |
Students’ ability to create and share digital content |
|
Cross-disciplinary integration self-efficacy |
Cross-disciplinary integration self-efficacy |
ZEF |
Students’ perceived ability to integrate knowledge, tools, and perspectives across domains |
Note: The prefix “Z” indicates that the indicator was transformed into a standardized \(Z\)-score before clustering.
3.2. Measures and Learner-Feature Construction
A clustering model was constructed using three learner-feature dimensions: AI self-efficacy, digital literacy, and cross-disciplinary integration self-efficacy. These dimensions were selected because they represent complementary feature dimensions in a multidimensional learner-feature space for AI-supported educational contexts.
AI self-efficacy was represented by four indicators: AI awareness, AI application, AI evaluation, and AI ethics. These indicators reflect students’ perceived capability to understand AI-related concepts, apply AI-related knowledge, evaluate AI-related information or outputs, and recognize ethical considerations in AI use. Digital literacy was represented by three indicators: data access and retrieval, data evaluation and interpretation, and data creation and sharing. These indicators capture students’ ability to locate, assess, interpret, produce, and communicate digital information. Cross-disciplinary integration self-efficacy is represented by one indicator that refers to students’ perceived ability to connect knowledge, tools, and perspectives across domains.
Eight indicators were used as clustering inputs. They were regarded as complementary learner features instead of as interchangeable measures of a single construct. The selected feature dimensions and standardized indicators are listed in Table 1.
After defining the feature dimensions and clustering indicators, an overall data analysis was conducted, as shown in Fig. 1. The workflow included data-source identification, sample screening, feature construction, pre-processing, clustering, and post-clustering analysis.
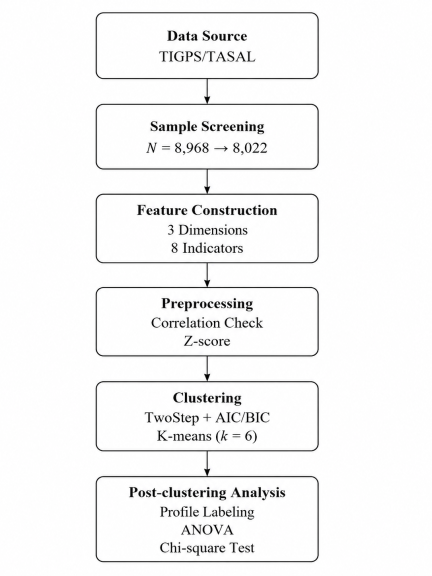
Fig. 1. Data analysis flow of the current study.
3.3. Data Screening and Standardized Feature Space
Before clustering, the eight input indicators were evaluated for their suitability in multivariate profile analysis. Correlations among the standardized indicators were inspected. The results showed that the indicators were positively related but not redundant. No pairwise correlations exceeded 0.90, thus suggesting that the input indicators did not show problematic multicollinearity. This step is important because highly redundant features may distort distance estimation in the cluster analysis.
All eight indicators were transformed into standardized \(Z\)-scores before clustering. This step is necessary for constructing a common feature space across indicators representing different dimensions of learner readiness. Without standardization, variables with larger variances or wider numerical ranges can dominate the distance estimation process and distort the resulting cluster structure.
For each student \(i\) and input indicator \(j\), the standardized score was calculated using Eq. (1).
After this transformation, each input indicator had a mean of 0 and a standard deviation of 1. Positive and negative values represented scores above and below the sample average, respectively. This procedure yielded a standardized learner-feature space in which each student’s relative configuration can be compared across AI self-efficacy, digital literacy, and cross-disciplinary integration self-efficacy.
| Number of clusters | AIC | BIC |
| 2 | 40576.003 | 40799.682 |
| 3 | 40280.040 | 40615.557 |
| 4 | 40225.797 | 40673.153 |
| 5 | 40238.859 | 40798.054 |
| 6 | 40196.023 | 40567.058 |
| 7 | 40211.977 | 40994.850 |
| 8 | 40228.374 | 41123.086 |
3.4. Cluster Enumeration and \(K\)-Means Profile Estimation
The analytical strategy involved a two-stage clustering procedure that combined information-criterion-based cluster enumeration with \(K\)-means profile estimation. In the first stage, two-step cluster analysis was performed to compare the candidate cluster solutions and determine the number of learner profiles. In the second stage, \(K\)-means clustering was conducted with the number of clusters fixed at six to estimate the final learner profiles.
In the two-step cluster analysis, eight standardized indicators—ZAI_1, ZAI_2, ZAI_3, ZAI_4, ZLI_1, ZLI_2, ZLI_3, and ZEF—were entered as continuous variables. The Euclidean distance was used because all eight inputs were continuous variables standardized on the same metric. Candidate cluster solutions from two to eight clusters were compared using the AIC and BIC, as shown in Table 2. The lower bound of the two clusters represented the simplest nontrivial partition, whereas the eight clusters provided a sufficiently broad upper bound to examine additional heterogeneity without extending the comparison to increasingly complex solutions. Cluster selection accounted for the information criteria, parsimony, substantive interpretability, and cluster size.
The six-cluster solution was selected because it yielded the minimum AIC and BIC values among the two- to eight-cluster candidate solutions, with AIC \(=\) 40196.023 and BIC \(=\) 40567.058. Additionally, it yielded interpretable profiles with nontrivial cluster sizes, ranging from 191 to 2,623 students (2.4%–32.7% of the analytical sample).
After the cluster number was determined, \(K\)-means clustering was conducted with the number of clusters fixed at six. This procedure refined the final cluster centers and assigned students to learner profiles. The same eight standardized input indicators were entered into the \(K\)-means procedure, and listwise deletion was applied. The final clustering results retained 8,022 valid cases after excluding 946 cases with missing values. The resulting cluster membership variable was used for subsequent profile interpretations and group comparisons.
3.5. Post-Clustering Interpretation and Group Comparisons
After the final six-profile solution was obtained, post-clustering analyses were conducted to interpret the characteristics of each learner profile. First, the final cluster centers were examined across the eight standardized indicators. These centers represented the average \(Z\)-score configuration of each cluster and served as the basis for naming and describing the learner profiles.
Second, a profile plot was created to visualize the relative strengths and weaknesses of the six clusters across the eight indicators. This visualization enabled generally high or low profiles to be distinguished from asymmetric profiles.
Third, the analysis of variance was performed as a descriptive post-clustering procedure to examine the relative discriminatory strength of each input indicator. The resulting \(F\) values were interpreted only as descriptive indicators of cluster differentiation—not as confirmatory hypothesis tests—because the same variables had been used to form the clusters.
Finally, gender differences in cluster membership were examined using the chi-square test. This analysis explored whether the distribution of learner profiles differed by gender, without assuming that one gender was generally superior in AI-related or digital-learning characteristics.
4. Results
4.1. Cluster Enumeration and Analytic Sample
The final analytical sample comprised 8,022 eighth-grade students with complete data on all eight standardized input indicators. These indicators included four AI self-efficacy variables, three digital-literacy variables, and one cross-disciplinary integration self-efficacy variable. A total of 946 cases were excluded owing to missing values for at least one clustering input indicator.
Before estimating the final learner profiles, the candidate cluster solutions from two to eight clusters were compared using information criteria during two-step cluster analysis. Among the candidate solutions, the six-cluster solution yielded the minimum AIC and BIC values. Specifically, the six-cluster solution yielded AIC \(= 40196.023\) and BIC \(= 40567.058\), thus indicating the most favorable balance between model fit and parsimony. The retained groups were substantively interpretable and nontrivial in terms of size (2.4%–32.7% of the analytical sample). Therefore, the six-cluster structure was retained as the primary learner-profiling framework. \(K\)-means clustering was conducted with the number of clusters fixed at six, and the resulting cluster membership variable was used for subsequent profile interpretations and group comparisons.
Among the candidate solutions, the six-cluster model yielded the lowest AIC and BIC values. Therefore, among the tested alternatives, the six-cluster solution was retained as the most parsimonious and interpretable profiling structure.
4.2. Six Learner Profiles in Standardized Feature Space
| Cluster | \(N\) | Percentage | Profile label |
| Cluster 1 | 1,186 | 14.8% |
High-scoring integrated profile |
| Cluster 2 | 191 | 2.4% |
Very low- scoring profile |
| Cluster 3 | 664 | 8.3% |
AI-moderate, digitally weak profile |
| Cluster 4 | 1,463 | 18.2% |
Broadly below- average profile |
| Cluster 5 | 1,895 | 23.6% |
Digitally adequate, AI-integration weak profile |
| Cluster 6 | 2,623 | 32.7% |
Near-average balanced profile |
The six-cluster solution revealed heterogeneous learner configurations across AI self-efficacy, digital literacy, and cross-disciplinary integration self-efficacy. The distribution of students across the six clusters was uneven. As shown in Table 3, Cluster 6 was the largest group, including 2,623 students (32.7% of the valid sample). Cluster 5 included 1,895 students (23.6%), followed by Cluster 4 with 1,463 students (18.2%). Cluster 1 included 1,186 students (14.8%) and Cluster 3 included 664 students (8.3%). Cluster 2 was the smallest, comprising 191 students (2.4%).
Table 3 provides the numerical distribution and labels of the six learner profiles, whereas Fig. 2 visualizes the uneven distribution of students across these profiles. The visual pattern highlights that the near-average balanced profile was the largest group, whereas the very low-scoring profile represented only a small minority of the sample.
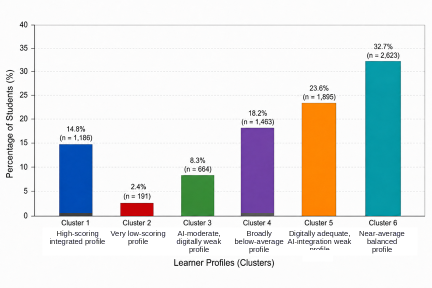
Fig. 2. Distribution of students across six learner profiles. (Percentages are based on 8,022 valid cases. Number of students in each cluster is shown in parentheses.)
| Indicator | C1 | C2 | C3 | C4 | C5 | C6 |
| AI awareness | 0.882 | \(-\)2.806 | 0.427 | \(-\)0.471 | \(-\)0.421 | 0.269 |
| AI application | 1.018 | \(-\)2.771 | 0.469 | \(-\)0.570 | \(-\)0.481 | 0.287 |
| AI evaluation | 1.157 | \(-\)2.650 | 0.481 | \(-\)0.729 | \(-\)0.635 | 0.417 |
| AI ethics | 0.986 | \(-\)2.751 | 0.285 | \(-\)0.362 | \(-\)0.329 | 0.125 |
| Data access and retrieval | 1.306 | \(-\)2.324 | \(-\)1.130 | \(-\)0.834 | 0.241 | 0.166 |
| Evaluation and interpretation | 1.336 | \(-\)2.196 | \(-\)1.227 | \(-\)0.940 | 0.310 | 0.181 |
| Creation and sharing | 1.337 | \(-\)2.271 | \(-\)1.069 | \(-\)0.919 | 0.283 | 0.137 |
| Cross-disciplinary integration self-efficacy | 0.749 | \(-\)0.740 | 0.318 | \(-\)0.590 | \(-\)0.470 | 0.309 |
The final cluster centers are listed in Table 4. As all input indicators were standardized, positive and negative values indicated scores above and below the sample average, respectively. Therefore, the cluster centers describe the relative configuration of each learner profile instead of raw-score differences.
Figure 3 shows the standardized profile patterns of the six learner clusters across the eight input indicators. The profiles did not form a simple high-to-low continuum. Instead, several groups displayed asymmetric configurations, particularly Clusters 3 and 5, which showed opposite patterns between AI-related confidence and digital literacy.
Cluster 1 was labeled as a high-scoring integrated profile. Students in this group scored above the sample average on all eight indicators. Their strongest relative advantages were observed in the three digital-literacy indicators, followed by AI evaluation, AI application, AI ethics, AI awareness, and cross-disciplinary integration self-efficacy. This profile represented students with a generally strong and balanced configuration across AI-related, digital, and integrative learning features.
Cluster 2 was labeled as the very low-scoring profile. This group scored below the sample average for all eight indicators. The lowest values appeared across AI self-efficacy and digital-literacy indicators, with \(Z\)-score centers appearing around or below \(-\)2.00. Although this was the smallest cluster, its profile was distinct because weaknesses appeared across all feature dimensions instead of in a single area. This group represented a small subgroup with broadly low self-reported scores across all three feature dimensions.
Cluster 3 was labeled as the AI-moderate, digitally weak profile. This group showed slightly above average values for AI awareness, AI application, AI evaluation, AI ethics, and cross-disciplinary integration self-efficacy. However, it clearly showed below-average values for all three digital-literacy indicators. This asymmetric configuration suggests that some students report moderate AI-related confidence without possessing strong digital information-processing competence.
Cluster 4 was labeled as a broadly below-average profile. Students in this cluster scored below the sample average for all eight indicators, although the magnitude of weakness was less extreme than that in Cluster 2. The lowest values were observed in the digital-literacy indicators, particularly evaluation and interpretation, and creation and sharing. This group represented students with generally weak but not extreme learner-feature configurations.
Cluster 5 was labeled as a digitally adequate, AI-integration weak profile. In contrast to Cluster 3, this group scored slightly above the sample average on the three digital-literacy indicators but below the sample average on all four AI self-efficacy indicators and cross-disciplinary integration self-efficacy. This configuration indicates a nonparallel feature pattern between digital literacy and AI-related confidence.
Cluster 6 was labeled as a near-average balanced profile and was the largest cluster. Students in this group scored close to the sample average on most indicators and slightly above the average on AI evaluation and cross-disciplinary integration self-efficacy. The profile did not demonstrate any distinct advantages or weaknesses, thus suggesting a relatively stable middle pattern.
Overall, the six profiles showed that learner heterogeneity in AI-supported educational contexts was better represented by multidimensional profile structures than by a single overall score. The contrast between Clusters 3 and 5 was particularly important because it revealed nonparallel feature patterns between AI self-efficacy and digital literacy across learner groups.
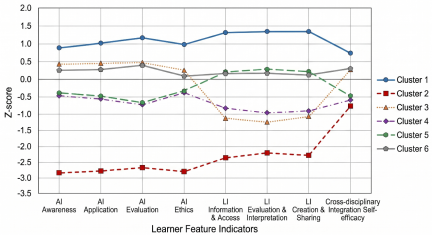
Fig. 3. Standardized profiles of six learner clusters across eight feature indicators. (Values represent standardized \(Z\)-score cluster centers. Horizontal line at \(Z = 0\) represents sample mean. Positive and negative values indicate scores above and below sample mean, respectively.)
| Indicator | \(F\) value |
| AI awareness | 1178.318 |
| AI application | 1584.740 |
| AI evaluation | 2760.039 |
| AI ethics | 1014.667 |
| Data access and retrieval | 2808.731 |
| Evaluation and interpretation | 3678.336 |
| Creation and sharing | 3145.819 |
| Cross-disciplinary integration self-efficacy | 535.813 |
4.3. Indicator-Based Differentiation Across Profiles
Post-clustering analysis of variance was conducted as a descriptive procedure to examine the relative contribution of each input indicator to cluster differentiation. As the same variables were used to form the clusters, the \(F\) values were interpreted as descriptive indicators of discriminatory strength instead of as confirmatory hypothesis tests. The descriptive differentiation results are presented in Table 5.
All eight indicators exhibited descriptive differences across the six learner profiles. The largest descriptive \(F\) values appeared in the digital-literacy indicators. Evaluation and interpretation showed the largest \(F\) value (\(F = 3678.336\)), followed by creation and sharing (\(F = 3145.819\)) and data access and retrieval (\(F = 2808.731\)). Among the AI-related indicators, AI evaluation showed the largest descriptive \(F\) value (\(F = 2760.039\)). Cross-disciplinary integration self-efficacy showed the smallest \(F\) value (\(F = 535.813\)).
Because the same indicators were used to construct the clusters, these \(F\) values were interpreted only as descriptive rankings of between-profile separation and not as independent inferential validations of the cluster solution. Within this descriptive framework, the largest separations were observed in evaluation and interpretation, creation and sharing, and data access and retrieval.
4.4. Gender Differences in Cluster Membership
A chi-square test was conducted to examine whether cluster membership differed by gender. The result was statistically significant (\(\chi^2(5) = 131.022\), \(p < 0.001\), Cramér’s \(V = 0.128\)), thus indicating a small association between gender and cluster membership. The chi-square assumption was satisfied because no expected cell count was below 5, and the minimum expected count was 92.90. The gender distributions across the six learner profiles are summarized in Table 6.
The gender distribution showed several profile-specific patterns. Male students were represented more in Cluster 1 (high-scoring integrated profile), whereas female students were represented more in Cluster 4 (broadly below-average profile). Cluster 3 (AI-moderate, digitally weak profile) included more female than male students. Cluster 6, which exhibited a near-average balanced profile, showed a relatively even distribution.
Therefore, the results should be interpreted with caution. They indicate that although the profile membership exhibits a gender-sensitive distribution, it does not imply that one gender is universally stronger or weaker across all AI-related and digital-learning features. Instead, the result suggests that gender may be associated with different configurations of AI self-efficacy, digital literacy, and cross-disciplinary integration self-efficacy. Further interpretation of this gender-sensitive profile distribution is provided in Section 5.
Collectively, these results map the heterogeneity of learner characteristics in AI-supported educational contexts and provide an empirical basis for discussing profile-specific support strategies in the following section.
| Cluster | Female | Male | Total |
| Cluster 1 | 427 | 759 | 1,186 |
| Cluster 2 | 71 | 120 | 191 |
| Cluster 3 | 350 | 314 | 664 |
| Cluster 4 | 825 | 638 | 1,463 |
| Cluster 5 | 899 | 996 | 1,895 |
| Cluster 6 | 1,330 | 1,293 | 2,623 |
| Total | 3,902 | 4,120 | 8,022 |
5. Discussion
5.1. Multidimensional Learner Profiles Beyond High–Low Continuum
This study identified six learner profiles based on AI self-efficacy, digital literacy, and cross-disciplinary integration self-efficacy. The results show that learner heterogeneity in AI-supported educational contexts cannot be adequately represented by a single high–low continuum. Although the high-scoring integrated profile and very low-scoring profile reflected relatively clear overall patterns, several other profiles showed uneven internal configurations. This finding supports the view that AI-related learner characteristics should be analyzed as multidimensional feature structures instead of as isolated variables or aggregate mean scores.
The most informative contrast appeared between Clusters 3 and 5. Cluster 3—the AI-moderate, digitally weak profile—showed moderate AI-related confidence and cross-disciplinary integration self-efficacy but weak digital literacy. By contrast, Cluster 5—the digitally adequate, AI-integration weak profile—showed relatively adequate digital literacy but lower AI self-efficacy and cross-disciplinary integration self-efficacy. These two profiles indicated nonparallel feature patterns between AI self-efficacy and digital literacy. In other words, students who report relatively higher confidence toward AI-related learning do not necessarily possess stronger digital information-processing competence, whereas students with adequate digital literacy may not necessarily feel confident in performing AI-related or integrative learning tasks.
This result extends previous discussions on AI literacy and learner heterogeneity. Previous profile-oriented studies suggested that AI-related competence is internally differentiated and cannot be fully explained by average-based comparisons 17,18. The present findings provide further evidence for junior high school students by showing that AI self-efficacy, digital literacy, and cross-disciplinary integration self-efficacy may be combined into asymmetric learner configurations. From an informatics perspective, this supports the value of cluster-based learner profiling because subgroup structures can reveal local patterns that remain hidden in variable-centered analyses.
5.2. Digital Literacy as a Key Differentiating Feature
The post-clustering indicator differentiation results were interpreted descriptively because the same indicators were used to construct the clusters. Within this descriptive comparison, evaluation and interpretation showed the largest \(F\) value, followed by creation and sharing, and data access and retrieval. These values characterize between-profile separation and should not be regarded as an independent validation of the cluster solution.
This finding is important because AI-supported learning is typically discussed in terms of students’ attitudes toward AI, their willingness to use AI, and their confidence in AI interactions. However, the present results indicate that differences among learner profiles are not defined solely by AI-related confidence. Instead, they are strongly associated with the students’ ability to evaluate, interpret, create, and share digital information. Digital literacy appears to function as a foundational layer for meaningful AI-supported learning instead of merely as a general technical background skill.
This result is consistent with digital-competence frameworks and digital-literacy measurement research, as it indicates that digital literacy is a structured competence that involves access, evaluation, interpretation, and creation 6,7. In AI-supported contexts, such competence becomes even more consequential because students must evaluate not only ordinary online information but also AI-generated responses that may be incomplete, probabilistic, or context-dependent. Therefore, instructional designs that emphasize AI use without strengthening students’ digital evaluation and interpretation skills may fail to address one of the most important sources of learner differentiation.
5.3. Profile-Based Interpretation of Vulnerability and Readiness
Cluster 2—the very low-scoring profile—represented a small group with consistently low self-reported scores across all three feature dimensions. Its main educational implication is that some learners may require foundational support across psychological, digital, and integrative areas instead of support focused on only one dimension.
Cluster 6—with a near-average balanced profile—was the largest group. Its middle-range configuration suggests that many students may benefit from gradual enhancements, such as opportunities to strengthen critical evaluation, integrative task use, and reflective digital production, instead of from broad remediation.
Collectively, these profiles suggest that AI-supported education should not only focus on learners with generally higher self-reported scores who can readily engage with advanced tools but also identify students whose multidimensional feature profiles indicate potential vulnerability or transitional readiness. Thus, cluster-based learner profiling can support more precise educational decision-making by distinguishing groups that require different types of support.
5.4. Gender-Sensitive Profile Distribution
The gender-distribution analysis showed a statistically significant but small association between gender and learner-profile membership (\(\chi^2(5) = 131.022\), \(p < 0.001\), Cramér’s \(V = 0.128\)). Male students were more represented in the high-scoring integrated profile, whereas female students were more represented in the broadly below-average and AI-moderate, digitally weak profiles. This finding should not be interpreted as evidence that one gender is inherently stronger or weaker in AI-supported learning. Instead, it suggests that gender may be associated with different configurations of AI self-efficacy, digital literacy, and cross-disciplinary integration self-efficacy. Given the small effect size, these distributional differences should not be overstated.
The distribution of Cluster 3 is particularly noteworthy. This group included more female students than male students and was characterized by moderate AI-related confidence but weaker digital-literacy indicators. One interpretation is that this pattern may reflect a discrepancy between AI-related self-perceptions and digital literacy, with relatively moderate AI-related self-perceptions and lower scores on the digital-literacy indicators. However, this interpretation remains tentative because the present study did not include qualitative data, direct behavioral performance measures, or information about the students’ technology-use histories. Accordingly, the gender-related findings should be viewed as hypothesis-generating instead of confirmatory.
5.5. Implications for AI-Supported Learner Profiling and Adaptive Support
The findings of this study enrich our understanding of AI-supported learner profiling in three dimensions. First, they show that learner heterogeneity can be more effectively represented through multivariate profile structures than through isolated variable comparisons. Second, they suggest that AI self-efficacy and digital literacy should not be assumed to develop in parallel. Third, they identify digital literacy as an important source of between-profile differentiation.
These implications are relevant to differentiated educational support and adaptive learning system design, where learner profiling, learning analytics, knowledge tracing, and adaptive feedback have been emphasized as important mechanisms for personalized learning 24,25,26,27,28,29. From a system-design perspective, the identified profiles may inform possible decision rules for personalized learning engines or adaptive feedback algorithms. For example, learners with an AI-moderate, digitally weak profile may not initially require more advanced AI application tasks. Instead, the system could prioritize guidance on information evaluation, digital operations, and the interpretation of AI-generated outputs. By contrast, learners in the digitally adequate, AI-integration weak profile may benefit more from confidence-building prompts and structured tasks that connect AI tools with disciplinary problem solving.
The high-scoring integrated profile may benefit from open-ended AI-supported inquiry tasks, cross-disciplinary projects, or advanced digital production activities. The very low-scoring profile may require more foundational support, including basic digital-literacy development, confidence-building experiences, and structured scaffolding before advanced AI-supported tasks are introduced. These differentiated pathways demonstrate how learner profiling can inform adaptive feedback mechanisms and differentiated instructional support.
5.6. Limitations and Future Studies
This study had several limitations. First, the present analysis used a cross-sectional analytical snapshot from a large-scale secondary dataset; therefore, the identified profiles should not be interpreted as developmental trajectories. Future studies may use later waves of the dataset to examine whether students have shifted between profiles over time. Second, the input indicators were based on self-reported scales. Although these indicators are useful for modeling perceived readiness, future research may combine self-perception measures with performance-based assessments, behavioral log data, or classroom interaction records. Third, the gender-related findings should be regarded as hypothesis-generating instead of confirmatory. Further studies should examine how prior digital access, classroom participation, and technological socialization shape profile membership. Because the present data do not directly observe participation in a specific AI-supported instructional intervention, the term “AI-supported educational contexts” is used herein as a contextual framing for learner characteristics relevant to settings in which AI may be incorporated. Finally, formal resampling-based stability testing was not conducted; future studies should examine the reproducibility of the six-cluster solution using split samples or other resampling procedures.
In general, the results suggest that AI-supported learning environments should not be designed around an average learner but should account for multiple profiles with different combinations of confidence, digital competence, and integrative readiness.
6. Conclusion
This study identified learner profiles in AI-supported educational contexts by integrating AI self-efficacy, digital literacy, and cross-disciplinary integration self-efficacy within a standardized feature space. Using a large-scale dataset of 8,022 eighth-grade students, this study adopted a two-stage clustering procedure in which two-step cluster analysis was first performed for AIC/BIC-guided cluster enumeration, followed by \(K\)-means clustering to estimate the final learner profiles. The results supported a six-profile solution, including a high-scoring integrated profile; a very low-scoring profile; an AI-moderate, digitally weak profile; a broadly below-average profile; a digitally adequate, AI-integration weak profile; and a near-average balanced profile.
The findings showed that learner heterogeneity in AI-supported education cannot be adequately represented by a single overall score or a simple high–low continuum. Instead, the students formed multiple profile structures with different combinations of psychological, technical, and integrative features. In particular, the contrast between the AI-moderate, digitally weak profile and the digitally adequate, AI-integration weak profile revealed nonparallel feature patterns between AI self-efficacy and digital literacy. This finding suggests that confidence toward AI and broader digital information-processing competence should be regarded as related but distinct learner characteristics.
Descriptive indicator differentiation results showed that digital literacy, particularly evaluation and interpretation, exhibited the largest between-profile separation. This implies that AI-supported learning environments should not focus only on students’ AI-related confidence or willingness to use AI but should also strengthen their capacity to evaluate, interpret, and create digital information. Gender-distribution analysis indicated a statistically significant but small association with profile membership. Although these findings should be interpreted with caution, they provide preliminary quantitative indicators for future studies on gendered technology socialization and AI-related learning readiness.
In summary, this study contributes to a standardized feature-space-based learner profiling framework for understanding heterogeneity in AI-supported educational contexts. By transforming multidimensional learner features into interpretable profiles, this study provides an empirical basis for differentiated instructional support, adaptive feedback mechanisms, and data-driven educational decision-making. Future research may extend this framework by incorporating longitudinal data, performance-based assessments, and behavioral-learning records to examine how learner profiles develop and shift over time. In this sense, the framework may offer a practical analytical approach for providing differentiated educational support.
Data Availability
The student questionnaire data analyzed in this study are available upon application from the SRDA, Academia Sinica, at https://srda.sinica.edu.tw/search/metadata/detail/D00268 (Accession No.D00268).
Acknowledgments
During the preparation of this manuscript, the authors used ChatGPT (OpenAI) to assist with text drafting, English-language editing, wording refinement, and manuscript organization in the abstract and main text. All AI-assisted output was critically reviewed and revised by the authors. The authors independently verified all content, analyses, interpretations, and references and take full responsibility for the accuracy, originality, and integrity of the manuscript.
- [1] D. Long and B. Magerko, “What is AI literacy? Competencies and design considerations,” Proc. of the 2020 CHI Conf. on Human Factors in Computing Systems, 2020. https://doi.org/10.1145/3313831.3376727
- [2] D. T. K. Ng, J. K. L. Leung, S. K. W. Chu, and M. S. Qiao, “Conceptualizing AI literacy: An exploratory review,” Computers and Education: Artificial Intelligence, Vol.2, Article No.100041, 2021. https://doi.org/10.1016/j.caeai.2021.100041
- [3] S. Feng and A. Carolus, “Artificial intelligence literacy at school: A systematic review with a focus on psychological foundations,” Computers and Education: Artificial Intelligence, Vol.10, Article No.100551, 2026. https://doi.org/10.1016/j.caeai.2026.100551
- [4] A. Bandura, “Self-efficacy: Toward a unifying theory of behavioral change,” Psychological Review, Vol.84, No.2, pp. 191-215, 1977. https://doi.org/10.1037/0033-295X.84.2.191
- [5] Y.-Y. Wang and Y.-W. Chuang, “Artificial intelligence self-efficacy: Scale development and validation,” Education and Information Technologies, Vol.29, No.4, pp. 4785-4808, 2024. https://doi.org/10.1007/s10639-023-12015-w
- [6] R. Vuorikari, S. Kluzer, and Y. Punie, “DigComp 2.2: The digital competence framework for citizens–With new examples of knowledge, skills and attitudes,” Publications Office of the European Union, 2022. https://doi.org/10.2760/115376
- [7] C.-Y. Chang and H.-C. Kuo, “The development and validation of the digital literacy questionnaire and the evaluation of students’ digital literacy,” Education and Information Technologies, Vol.30, No.9, pp. 11549-11581, 2025. https://doi.org/10.1007/s10639-024-13216-7
- [8] S. P. Schaffer, X. Chen, X. Zhu, and W. C. Oakes, “Self-efficacy for cross-disciplinary learning in project-based teams,” J. of Engineering Education, Vol.101, No.1, pp. 82-94, 2012. https://doi.org/10.1002/j.2168-9830.2012.tb00042.x
- [9] C.-J. Huang, L.-L. Kueh, H.-W. Wang, H. Hung, and H.-H. Wang, “Assessing self-efficacy in interdisciplinary learning experiences and the effects of career-related predictors,” Higher Education, Skills and Work-Based Learning, Vol.14, No.4, pp. 782-795, 2024. https://doi.org/10.1108/HESWBL-09-2023-0259
- [10] X. Zhou, J. An, X. Zhao, and Y. Dong, “Using data mining on students’ learning features: A clustering approach for student classification,” J. Adv. Comput. Intell. Intell. Inform., Vol.20, No.7, pp. 1141-1146, 2016. https://doi.org/10.20965/jaciii.2016.p1141
- [11] Y.-H. Lin and C.-C. Chen, “Integrating fuzzy clustering and profile analysis on retrospective measurement for project-based learning,” J. Adv. Comput. Intell. Intell. Inform., Vol.29, No.4, pp. 968-976, 2025. https://doi.org/10.20965/jaciii.2025.p0968
- [12] M. Alvarez-Garcia, M. Arenas-Parra, and R. Ibar-Alonso, “Uncovering student profiles. An explainable cluster analysis approach to PISA 2022,” Computers and Education, Vol.223, Article No.105166, 2024. https://doi.org/10.1016/j.compedu.2024.105166
- [13] G. W. Milligan and M. C. Cooper, “A study of standardization of variables in cluster analysis,” J. of Classification, Vol.5, No.2, pp. 181-204, 1988. https://doi.org/10.1007/BF01897163
- [14] J. Bacher, K. Wenzig, and M. Vogler, “SPSS TwoStep Cluster–A first evaluation,” Arbeits- und Diskussionspapiere, 2004.
- [15] A. K. Jain, “Data clustering: 50 years beyond K-means,” Pattern Recognition Letters, Vol.31, No.8, pp. 651-666, 2010. https://doi.org/10.1016/j.patrec.2009.09.011
- [16] J. MacQueen, “Some methods for classification and analysis of multivariate observations,” Proc. of the 5th Berkeley Symp. on Mathematical Statistics and Probability, Vol.1, pp. 281-297, 1967.
- [17] L. Medina-Gual, L. Medina-Velázquez, and J.-L. Parejo, “A tridimensional model of AI literacy: An empirical analysis of student performance and demographic patterns in higher education,” Australasian J. of Educational Technology, Vol.41, No.5, pp. 37-55, 2025. https://doi.org/10.14742/ajet.10596
- [18] L. Medina-Gual and J.-L. Parejo, “University students’ engagement with artificial intelligence: A cluster analysis of learner profiles in AI literacy,” Technology, Knowledge and Learning, Vol.31, No.1, pp. 291-309, 2026. https://doi.org/10.1007/s10758-025-09926-7
- [19] M. Sayed, “Student progression and dropout rates using convolutional neural network: A case study of the Arab Open University,” J. Adv. Comput. Intell. Intell. Inform., Vol.28, No.3, pp. 668-678, 2024. https://doi.org/10.20965/jaciii.2024.p0668
- [20] D. Hao, “A hybrid collaborative filtering and LDA-based subject model for bidirectional employment,” J. Adv. Comput. Intell. Intell. Inform., Vol.30, No.2, pp. 566-578, 2026. https://doi.org/10.20965/jaciii.2026.p0566
- [21] J.-C. Hsieh, H.-L. S. Wang, K.-J. Chen, F.-L. Lu, P.-C. Zhao, D.-R. Li, Y.-H. Chen, and C.-I. Wu, “Taiwan assessment of student achievement: Longitudinal study (II),” National Academy for Educational Research, Project, Nos.NAER-2024-012-C-1-1-C3-01, 2024.
- [22] C.-I. Wu, H.-R. Chen, C.-W. Wu, Y.-F. Chen, L.-W. Huang, Y.-H. Chou, M.-H. Tsai, and J.-C. Hsieh, “Taiwan I-Generation Panel Study: Tracking adolescents’ developmental trajectories (2/5),” National Science and Technology Council, Project, Nos.NSTC113-2740-H-001-001-SSS, 2024.
- [23] J.-C. Hsieh, “Applying R to the Complex Sampling and Weight Estimation for a Large-Scale Assessment and Survey: The TIGPS and TASAL in I-Generation Collaborative Database,” J. of Education & Psychology, Vol.49, No.2, pp. 111-148, 2026 (in Chinese). https://doi.org/10.53106/102498852026064902004
- [24] A. González-Nucamendi, J. Noguez, L. Neri, V. Robledo-Rella, R. M. G. García-Castelán, and D. Escobar-Castillejos, “Learning Analytics to Determine Profile Dimensions of Students Associated with Their Academic Performance,” Applied Sciences, Vol.12, No.20, Article No.10560, 2022. https://doi.org/10.3390/app122010560
- [25] A. González-Nucamendi, J. Noguez, L. Neri, V. Robledo-Rella, R. M. G. García-Castelán, and D. Escobar-Castillejos, “The prediction of academic performance using engineering student’s profiles,” Computers and Electrical Engineering, Vol.93, Article No.107288, 2021. https://doi.org/10.1016/j.compeleceng.2021.107288
- [26] J. Xia, H. Wang, Q. Zhuge, and E. H.-M. Sha, “Knowledge tracing model and student profile based on clustering-neural-network,” Applied Sciences, Vol.13, No.9, Article No.5220, 2023. https://doi.org/10.3390/app13095220
- [27] L. Y. Tan, S. Hu, D. J. Yeo, and K. H. Cheong, “Artificial intelligence-enabled adaptive learning platforms: A review,” Computers and Education: Artificial Intelligence, Vol.9, Article No.100429, 2025. https://doi.org/10.1016/j.caeai.2025.100429
- [28] G. Abdelrahman, Q. Wang, and B. Nunes, “Knowledge tracing: A survey,” ACM Computing Surveys, Vol.55, No.11, Article No.224, 2023. https://doi.org/10.1145/3569576
- [29] S. Shen, Q. Liu, Z. Huang, Y. Zheng, M. Yin, M. Wang, and E. Chen, "A survey of knowledge tracing: Models, variants, and applications," IEEE Trans. on Learning Technologies, Vol.17, pp.1898-1919, 2024. https://doi.org/10.1109/TLT.2024.3383325
This article is published under a Creative Commons Attribution-NoDerivatives 4.0 Internationa License.