
Research Paper:
Muscle Synergy Comparison Between Gait and Supine Passive Pedaling Under Different Pedaling Conditions
Yuta Takahashi* and Akinori Sekiguchi**,†

*Sustainable Engineering Program, Graduate School of Engineering, Tokyo University of Technology
1404-1 Katakuramachi, Hachioji, Tokyo 192-0982, Japan
**Department of Mechanical Engineering, Tokyo University of Technology
1404-1 Katakuramachi, Hachioji, Tokyo 192-0982, Japan
†Corresponding author

This study used muscle synergy analysis to quantitatively compare the muscle coordination patterns elicited during passive pedaling with those observed during walking. Surface electromyography signals were recorded from the lower limb muscles of a healthy adult during gait and under four different passive pedaling conditions. To evaluate the muscle coordination patterns, muscle synergies were extracted, and their structures were compared. The integrated electromyography was used to quantify the magnitude of muscle activity. Experimental results demonstrated that the fundamental coordination patterns of the thigh muscles observed during gait were largely reproduced during passive pedaling. In contrast, the coordination patterns of the lower leg muscles, which play critical roles in propulsion and weight-bearing, were not adequately reproduced. In addition, the overall muscle activity increased with pedaling speed. These findings suggest that while passive pedaling can reactivate the fundamental rhythmic patterns of locomotion, it cannot replace task-specific, weight-bearing exercises and should instead be used as a preparatory intervention for gait training.
Muscle synergy analysis of passive pedaling
1. Introduction
Prolonged inactivity leads to disuse muscle atrophy, a common complication in acute-phase patients requiring prolonged bed rest that can delay functional recovery 1. Recent systematic reviews have elucidated the cellular and molecular mechanisms underlying disuse-induced muscle atrophy, highlighting the contributions of neural and inflammatory pathways 2,3,4. Early rehabilitation is therefore essential for mitigating the adverse effects of muscle disuse; however, many patients in the acute phase are unable to perform voluntary movements, making passive exercise a practical rehabilitation strategy that can be implemented at the bedside 5.
Among passive exercise modalities, motorized passive pedaling has emerged as a promising rehabilitation approach. Previous studies have demonstrated its clinical benefits, such as reduced spasticity in patients with stroke and improved cardiovascular responses mediated by reflex-based mechanisms 6,7. More recent trials and meta-analyses have further examined assisted cycling and explored its optimal dosing parameters for neurorehabilitation 8,9. These therapeutic effects are considered to be driven by rhythmic sensory feedback from muscle stretching and joint motion, which can modulate spinal reflex excitability and engage central pattern generators, the spinal circuits responsible for generating locomotor rhythms 10,11,12.
To investigate neuromuscular control strategies underlying locomotor movements, muscle synergy analysis has been widely used to characterize the modular organization of muscle coordination during walking 13,14 and active cycling 15. In clinical populations, alterations in synergy structure, such as the merging of modules, have been associated with motor impairment after stroke 6,16.
Despite the clinical utility of passive pedaling and the applicability of synergy analysis, a key gap remains: the extent to which passive pedaling reproduces gait-related muscle synergies is still unclear. Moreover, the effects of exercise parameters, such as pedaling speed and pedal height, on synergy structure have not been quantitatively examined.
Therefore, the objective of this study was to quantitatively compare muscle coordination patterns between passive pedaling and gait using muscle synergy analysis. By evaluating multiple pedaling conditions, fundamental insights are provided to support evidence-based rehabilitation strategies for gait restoration.
2. Methods
To achieve the objective outlined in the introduction, an experiment was designed to collect and analyze data on muscle activity during gait and passive pedaling. This section details the experimental protocol, data acquisition methods, and analytical procedures employed.
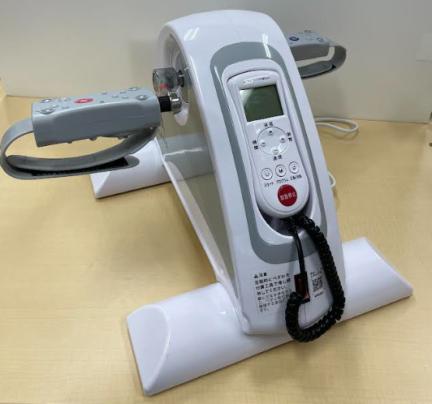
Fig. 1. The motorized pedal exerciser used in the study.
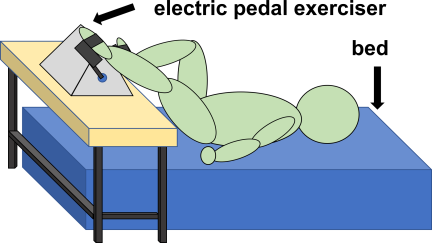
Fig. 2. Schematic of the experimental setup for passive pedaling in a supine position.
2.1. Experimental Tasks
One healthy adult male participated in this study. Written informed consent was obtained from the participant prior to his enrollment in the study. The experimental protocol consisted of two main tasks: a gait task, which served as the reference condition, and a passive pedaling task, which constituted the primary focus of the analysis.
2.1.1. Gait Task
The participant was instructed to walk along a 12-m walkway at a comfortable, self-selected speed (approximately 1.0 m/s). The walking task was repeated five times, and surface electromyography (sEMG) data from ten steady-state gait cycles were collected for subsequent analysis.
2.1.2. Pedaling Task
For the pedaling task, the participant lay in a supine position on a bed and performed passive pedaling using a motorized pedal exerciser manufactured by ALINCO, Inc., Japan, shown in Fig. 1. The setup is illustrated in Fig. 2. The exerciser was mounted on an adjustable-height platform, and four distinct experimental conditions were tested (Table 1). Pedaling speed was set to 40, 70, and 90 revolutions per minute (rpm). Pedal height was defined at the crank angle of maximum lower limb flexion and set to 400 mm for the low setting and 520 mm for the high setting. The 70 rpm condition was tested at both height settings. The 40 rpm and 90 rpm conditions were tested only at the high setting. Throughout this paper, the four pedaling conditions are referred to as 40 rpm, 70 rpm high, 70 rpm low, and 90 rpm. Data from ten consecutive pedaling cycles were collected for each condition.
| Pedaling speed [rpm] | ||||
| 40 | 70 | 90 | ||
| Pedal height [mm] (at max. flexion) | 400 | 70 rpm low | ||
| 520 | 40 rpm | 70 rpm high | 90 rpm | |
2.2. Data Acquisition
Muscle activity was measured from eight lower limb muscles using an sEMG system (biosignalsplux, PLUX, Portugal) at a sampling frequency of 1000 Hz. This study exclusively used sEMG; thus, the term EMG hereinafter refers to sEMG. Before placing electrodes, the participant’s skin at the electrode placement areas was shaved and cleaned with alcohol to reduce skin impedance. Electrodes were placed according to the sEMG for the non-invasive assessment of muscles guidelines 17. The targeted muscles included the lateral head of gastrocnemius (LG), tibialis anterior (TA), vastus medialis (VM), vastus lateralis (VL), rectus femoris (RF), semitendinosus (ST), biceps femoris (BF), and gluteus maximus (Gmax).
Two sensors were used to identify movement cycles:
-
・
Gait: A pressure sensor (FSR UX 402, Interlink Electronics, USA) was attached to the heel to detect heel pressure for heel-strike events, recording at a sampling frequency of 50 Hz. A pressure threshold of 200 was empirically set to determine the initial foot contact.
-
・
Pedaling: A nine-axis inertial measurement unit (AE-BNO055, Akizuki Denshi Tsusho, Japan) was fixed to the pedal crank, and the crank rotation angle was calculated from accelerometer data. The maximum lower limb flexion (top-dead-center, Fig. 3) was set to \(0°\).
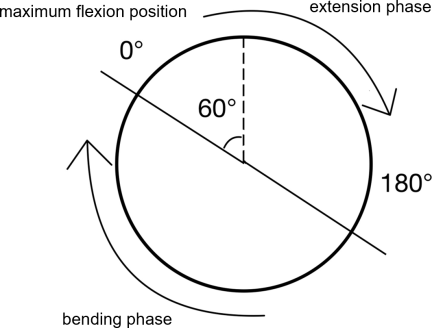
Fig. 3. Definition of the pedal crank angle. The cycle starts at \(0°\), corresponding to the position of maximum lower limb flexion. The cycle is divided into an extension phase and a flexion (bending) phase.
2.3. Data Analysis
In this study, to evaluate and compare the muscle coordination patterns between gait and passive pedaling, muscle synergies were extracted, and their structures were compared. The integrated EMG (iEMG) was used to quantify the magnitude of muscle activity. For these purposes, the acquired data were processed through the following five steps.
2.3.1. EMG Preprocessing and Envelope Creation
The raw EMG signals were first processed with a 50-Hz notch filter to remove power line interference, followed by a 20–450-Hz band-pass filter. The filtered signals were then full-wave rectified, and finally, a zero-lag, fourth-order Butterworth low-pass filter with a 6-Hz cutoff frequency was applied to create smooth EMG envelopes representing muscle activity intensity.
2.3.2. Cycle Normalization and Preparation
The EMG envelopes were segmented into individual cycles based on the heel-strike events for gait and maximum flexion position at \(0°\) for pedaling. The time axis of each cycle was normalized by resampling to 101 data points. Ten time-normalized cycles were then averaged for each condition. The averaged time-normalized waveforms were used for synergy extraction and iEMG quantification. For the synergy extraction via non-negative matrix factorization (NMF), the amplitude of the averaged waveform of each muscle was normalized to its peak value within the same condition 18. For the calculation of iEMG, the averaged waveforms were normalized to the global maximum value observed across all five experimental conditions, which included the gait and four pedaling conditions.
2.3.3. Muscle Synergy Extraction
NMF was applied to the normalized EMG data matrix (\(\pmb{V}\)) for each condition, which consisted of \(m\) muscles and \(t\) time points (\(m \times t\)) 19. NMF is a technique that reconstructs the original muscle activity matrix as an approximate linear combination of \(k\) synergies, based on the following model 20:
The NMF algorithm iteratively searches for non-negative matrices \(\pmb{W}\) and \(\pmb{H}\) that minimize the Frobenius norm of the reconstruction error, \(\| \pmb{V} - \pmb{WH} \|_F^2\). In this implementation, the NMF model was initialized randomly and optimized using a multiplicative update solver with a maximum of 1000 iterations. The number of synergies, \(k\), was determined using the variance accounted for (VAF), calculated as follows:
The smallest number of synergies that satisfied a VAF \(>\) 95% was selected 21.
2.3.4. Synergy Similarity Assessment
To evaluate the similarity of muscle coordination patterns between gait and each pedaling condition, the cosine similarity between their respective synergy patterns (\(\pmb{w}\)) was calculated. This metric assesses similarity in the pattern shape, independent of the magnitude of muscle activations. The similarity between a gait synergy vector (\(\pmb{w}_{\text{gait}}\)) and a pedaling synergy vector (\(\pmb{w}_{\text{pedal}}\)) is given by the following equation:
2.3.5. Quantification of Muscle Activity
We quantified the total activity of each synergy over one cycle by calculating the iEMG 22. This was achieved by summing the values of the time-normalized activation pattern vector \(\pmb{H}\) (101 points). The iEMG for the \(k\)-th synergy with an activation pattern \(\pmb{H}_k(t)\) (where \(t = 1, 2, \ldots, 101\)) is calculated as follows:
3. Results
Following the analytical procedures described in the previous section, we extracted and compared the muscle synergies from the recorded EMG data. This section presents the key findings from this analysis, beginning with the determination of the number of synergies, followed by a detailed comparison of their structures and activation patterns between the gait and various pedaling conditions.
Representative raw data for a single cycle, including raw EMG signals and cycle synchronization signals, are shown in Fig. 4.
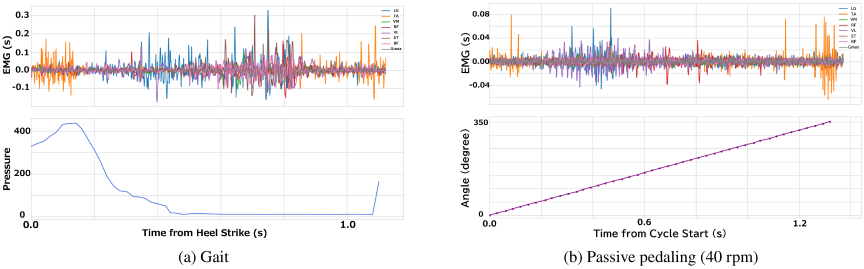
Fig. 4. Representative raw data for a single cycle. The top panels show the raw EMG signals, and the bottom panels show the cycle synchronization signals (heel pressure for gait and crank angle for pedaling).
3.1. Number of Extracted Synergies
Four synergies sufficiently reconstructed the original EMG waveforms across all five experimental conditions. As shown in Fig. 5, the VAF exceeded the 95% threshold with four synergies in every case, whereas adding a fifth synergy produced only a negligible increase in VAF (less than 3%). Therefore, four synergies were used for all subsequent analyses.
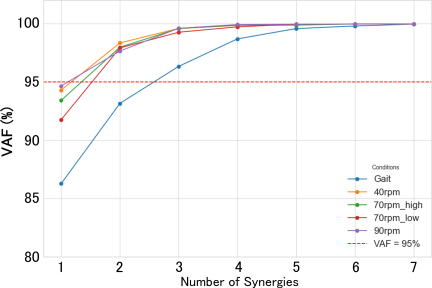
Fig. 5. VAF as a function of the number of extracted synergies for each experimental condition. The dashed line indicates the 95% threshold used to determine the appropriate number of synergies.
3.2. Muscle Synergy Structure of Gait
The four synergies extracted from the gait data are presented in Fig. 6. Each synergy was characterized by a unique combination of muscle weightings (\(\pmb{W}\)) and a distinct temporal activation pattern (\(\pmb{H}\)), corresponding to specific functional roles within the gait cycle. Based on the pressure sensor data, the stance phase corresponds to approximately 0%–60% of the cycle, and the swing phase corresponds to 60%–100%, with toe-off occurring around 60%.
These four synergies are consistent with those identified in previous literature. Notably, Neptune et al. also identified four primary synergies that explain the muscle activity during human walking 14,23,24. The synergies dominated by the lower leg muscles (S2 and S4), which are primarily responsible for propulsion and foot clearance, showed remarkable similarity to those in the Neptune et al. study in terms of their muscle weightings (\(\pmb{W}\)) and activation timings (\(\pmb{H}\)). The thigh-dominant synergies (S1 and S3) also shared similar muscle weightings. However, a minor difference was observed in their activation timings, with our data showing weaker activity during the early stance phase compared to their findings. This discrepancy is considered to be within the range of individual variability, particularly given that our results are based on a single participant.
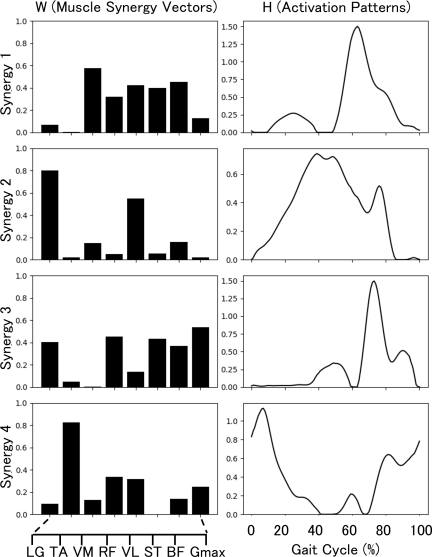
Fig. 6. Muscle synergy structure during gait. The left column shows the muscle synergy patterns (\(\pmb{W}\)), representing the relative weight of each muscle (LG, TA, VM, VL, RF, ST, BF, Gmax) within each of the four synergies. The right column shows the corresponding temporal activation patterns (\(\pmb{H}\)) over a normalized gait cycle (0%–100%).
Synergy 1 (S1)
Characterized by the co-activation of the quadriceps (VM, VL, RF) and hamstrings (BF, ST), its activation peaked at toe-off (\(\sim\)60% of the cycle), contributing to knee stabilization during the transition to the swing phase.
Synergy 2 (S2)
Dominated by a large contribution from the LG, with a secondary contribution from the RF, it exhibited a primary peak in the late stance phase, associated with the push-off function, and a smaller secondary peak during the mid-swing phase.
Synergy 3 (S3)
Composed of multi-joint muscles, including the Gmax, hamstrings (ST, BF), and VL, its activation peaked during the mid-swing phase, acting to decelerate the swinging limb in preparation for landing.
Synergy 4 (S4)
Primarily composed of the TA, it showed a biphasic activation pattern with an initial peak during early stance for shock absorption and the second peak during the swing phase to ensure toe clearance.
3.3. Similarity of Synergies Between Gait and Pedaling
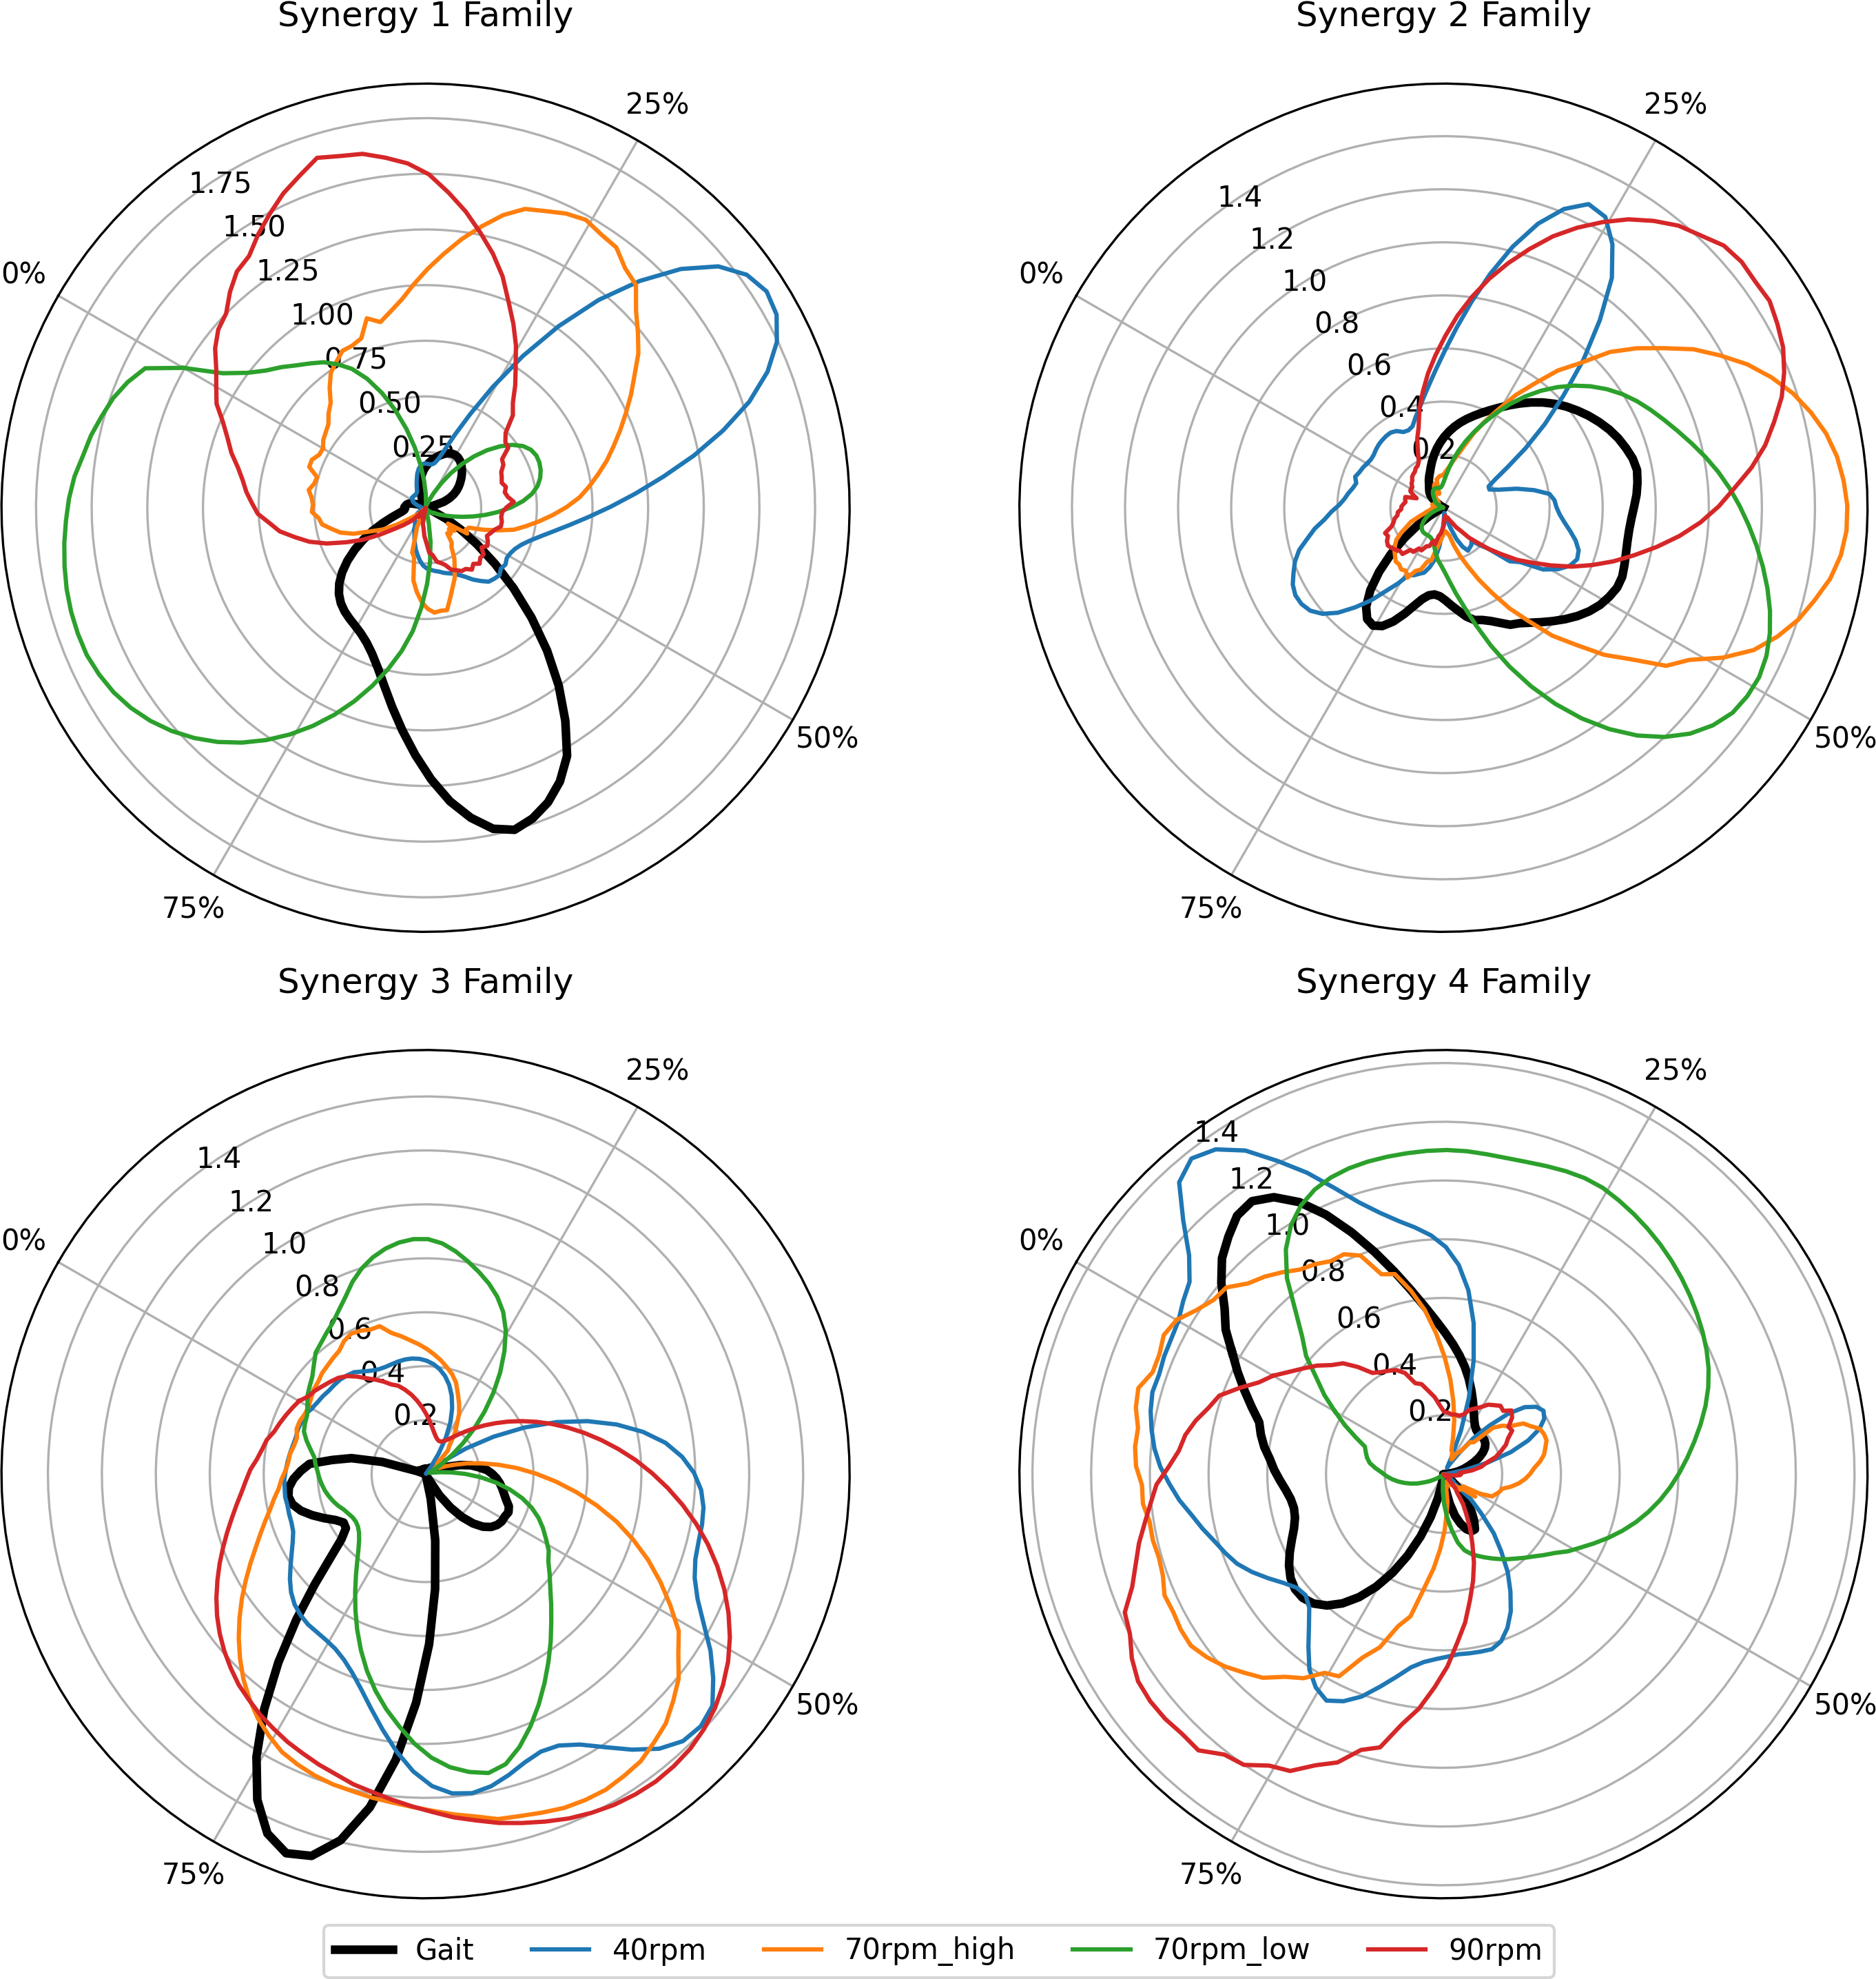
The synergy structures extracted from the four pedaling conditions are shown in Fig. 7. We compared the synergy patterns \(\pmb{W}\) of each pedaling condition with those of the gait using cosine similarity. We denote this cosine similarity score by \(r\) to match the notation in Fig. 8. The results of the cosine similarity analysis are presented in Fig. 8. The corresponding temporal activation patterns \(\pmb{H}\) are compared across conditions in Fig. 9.
Synergy family 1
The vector for this synergy was well-preserved across most pedaling conditions, showing high similarity to gait S1 at 40 rpm (\(r =\) 0.87), 70 rpm high (\(r =\) 0.82), and 90 rpm (\(r =\) 0.85). The fundamental pattern of quadriceps-hamstring co-activation was maintained. However, the timing of activation varied considerably across conditions.
Synergy family 2
High similarity to gait S2 was observed only at high speeds: 70 rpm high (\(r =\) 0.87) and 90 rpm (\(r =\) 0.85). The similarity was low at 40 rpm (\(r =\) 0.44). The activation timing in the high-speed conditions occurred during the latter half of the pedal extension phase, which is kinematically similar to the push-off phase in the gait.
Synergy family 3
This synergy was consistently reproduced with high fidelity across all pedaling conditions, with similarity scores of \(r =\) 0.86 (40 rpm), \(r =\) 0.84 (70 rpm high), \(r =\) 0.93 (70 rpm low), and \(r =\) 0.80 (90 rpm). In pedaling, this synergy was active during the first half of the flexion phase.
Synergy family 4
The similarity of this TA-dominant synergy was moderate, with \(r\)-values ranging from 0.72 to 0.82. The activation timing of this synergy family showed the greatest variability among the four synergies across the different pedaling conditions.
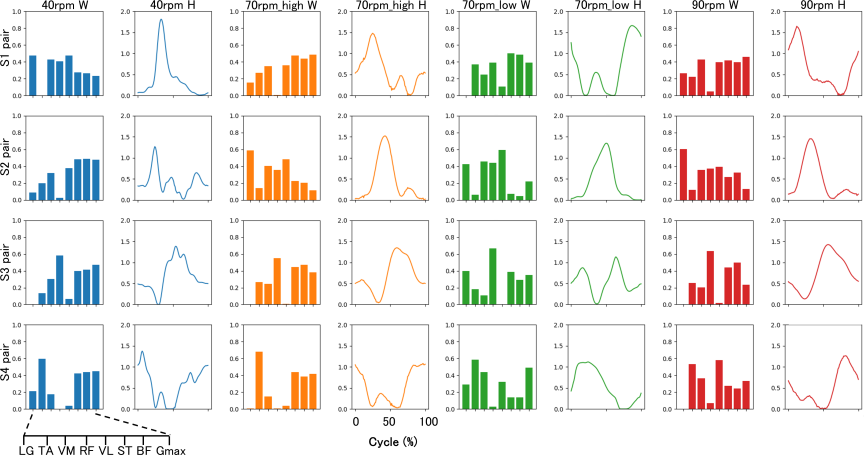
Fig. 7. Muscle synergy structures for the four passive pedaling conditions. The 40 rpm and 90 rpm conditions correspond to the high pedal height setting.
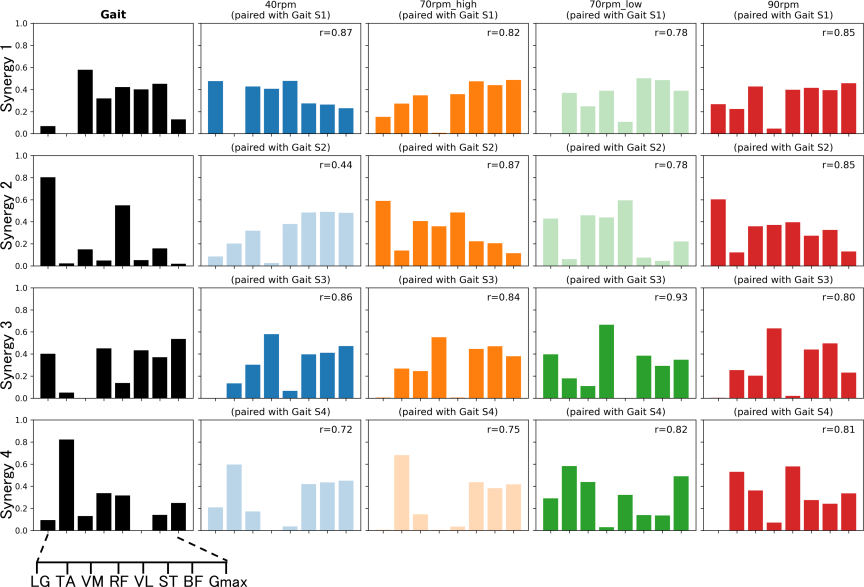
Fig. 8. Comparison of synergy patterns (\(\pmb{W}\)) between gait (black bars, left column) and the four pedaling conditions. Each pedaling synergy is paired with the most similar gait synergy. The cosine similarity score (\(r\)-value) for each pair is shown. Pairs with \(r > 0.8\) are highlighted with a solid fill.
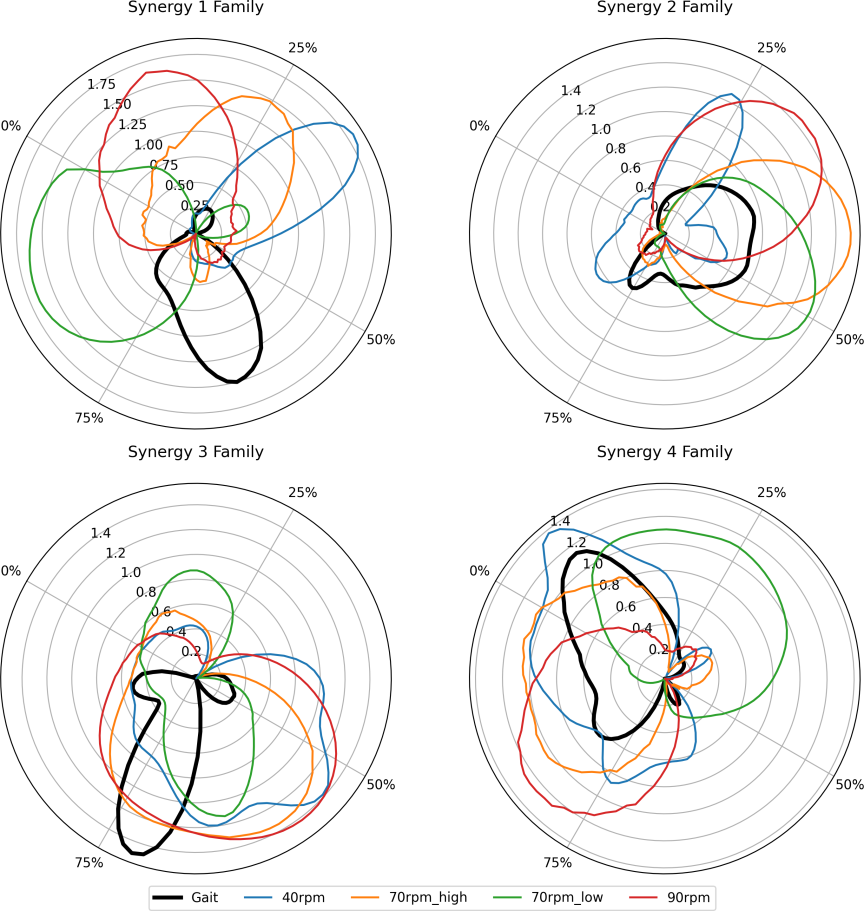
Fig. 9. Polar plots comparing the temporal activation patterns (\(\pmb{H}\)) for each of the four synergy families across all conditions. The black line represents gait, and colored lines represent the pedaling conditions. The angle corresponds to the cycle percentage (0%–100%), and the radius represents the activation amplitude.
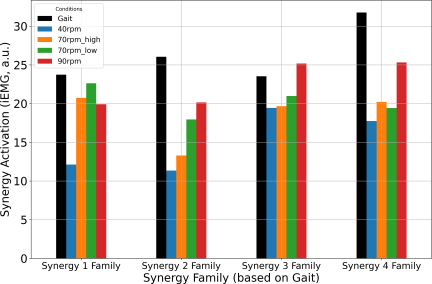
Fig. 10. Comparison of the total synergy activation magnitude (iEMG) per cycle for each synergy family across all conditions.
3.4. Comparison of Muscle Activity Magnitude (iEMG)
The total activity per cycle for each synergy family, quantified by iEMG, is shown in Fig. 10. The overall muscle activity during pedaling increased with the rotation speed. The iEMG values for the lower leg synergies (S2 and S4) during all pedaling conditions were substantially lower than those observed during gait. In contrast, the iEMG values for the thigh muscle synergies (S1 and S3) during some pedaling conditions were comparable to the levels seen in gait.
4. Discussion
The results presented in the preceding section provide a quantitative comparison of muscle synergies between passive pedaling and gait. In this section, these findings are interpreted in the context of neurorehabilitation, discussing the implications of both the similarities and differences observed in the coordination patterns. We also address the limitations of the study and suggest directions for future research.
Importantly, our findings demonstrate that although passive pedaling does not fully replace walking, it offers distinct benefits for early-phase rehabilitation, particularly in reactivating spinal locomotor circuits. The results revealed that, although passive pedaling can effectively reactivate the fundamental rhythmic coordination patterns of the thigh muscles involved in gait, it is less effective in reproducing the patterns of the lower leg muscles responsible for weight-bearing and propulsion.
The high fidelity with which the thigh-dominant synergies S1 and S3 were reproduced suggests that passive pedaling can engage neural circuits that contribute to the basic rhythm of locomotion. Synergy S1 stabilizes the knee joint, and S3 controls the limb during the swing phase, and these roles represent core components of the locomotor pattern. The consistent activation of these synergies, even without voluntary effort or weight-bearing, suggests that rhythmic sensory feedback from muscle stretching and joint movement during pedaling may increase the excitability of spinal locomotor circuits and may involve central pattern generator mechanisms. This interpretation supports the view that passive pedaling can help re-establish the foundational rhythm of walking in patients who cannot move voluntarily.
In contrast, the synergies dominated by the lower leg muscles (S2 and S4) exhibited lower similarity and activity levels compared to gait, particularly at lower speeds. These synergies play critical roles in gait-specific functions, such as generating propulsive force at push-off (S2) and controlling the foot at landing (S4). These actions are heavily dependent on ground contact and mechanical demands of supporting body weight. The absence of these task-specific requirements in the supine, non-weight-bearing pedaling task explains the limited activation of these synergies. This highlights that for the recovery of functions such as propulsion and landing control, more task-specific training in a weight-bearing position is indispensable.
Our results also showed that increasing the pedaling speed led to a general increase in muscle activity (iEMG). In passive movement, muscle activation is primarily driven by reflexive responses to mechanical stimuli, such as the stretch reflex. Higher speeds result in faster and stronger muscle stretches, leading to more potent sensory input to the spinal cord and, consequently, larger reflexive muscle activation. This suggests that the speed of passive pedaling may serve as a practical parameter for modulating the intensity of sensory input and the level of neuromuscular activation.
Based on these findings, passive pedaling appears to be most appropriately positioned as a preparatory intervention for gait rehabilitation during the acute phase. It can be used to enhance the excitability of the nervous system and reactivate the basic locomotor rhythm. Following this preparatory phase, a progressive program could transition patients to active exercises with graded loading, possibly in combination with other therapies such as electrical muscle stimulation, and ultimately to upright gait training.
This study has some limitations. First, the experiment was conducted on a single healthy participant; thus, the generalizability of the findings is limited. Future studies should include a larger cohort and patient populations. Nevertheless, this study provides a clear quantitative framework for evaluating and optimizing passive exercise protocols.
5. Conclusion
This study demonstrated that passive pedaling reproduces fundamental thigh muscle coordination patterns observed in gait, likely through sensory-driven engagement of spinal locomotor circuits that may involve central pattern generator mechanisms. However, it fails to replicate the coordination patterns of lower leg muscles essential for weight-bearing and propulsion. These findings indicate that passive pedaling serves as a valuable preparatory tool in a phased rehabilitation program, designed to re-establish the basic rhythm of locomotion before progressing to more task-specific, weight-bearing exercises.
Our findings offer practical guidance for clinicians to optimize pedaling speed and crank height to enhance gait recovery interventions. As this study was conducted on a single participant, the immediate future direction is to increase the number of participants to ensure more generalizable findings. Further research with a larger cohort, including patient populations, will be essential to establish robust, evidence-based protocols for clinical application.
- [1] N. Haida, “Basic science of disuse muscle atrophy,” Rigakuryoho Kagaku (The Science of Physical Therapy), Vol.21, No.2, pp. 94-97, 1994. (in Japanese).
- [2] E. A. Nunes, T. Stokes, J. McKendry, B. S. Currier, and S. M. Phillips, “Disuse-induced skeletal muscle atrophy in disease and nondisease states in humans: Mechanisms, prevention, and recovery strategies,” Am. J. Physiol. Cell Physiol., Vol.322, No.6, pp. C1068-C1084, 2022. https://doi.org/10.1152/ajpcell.00425.2021
- [3] E. J. Hardy, T. B. Inns, J. Hatt, B. Doleman, J. J. Bass, P. J. Atherton, J. N. Lund, and B. E. Phillips, “The time course of disuse muscle atrophy of the lower limb in health and disease,” J. of Cachexia, Sarcopenia and Muscle, Vol.13, No.6, pp. 2616-2629, 2022. https://doi.org/10.1002/jcsm.13067
- [4] J. McKendry, G. Coletta, E. A. Nunes, C. Lim, and S. M. Phillips, “Mitigating disuse-induced skeletal muscle atrophy in ageing: Resistance exercise as a critical countermeasure,” Experimental Physiology, Vol.109, No.10, pp. 1650-1662, 2024. https://doi.org/10.1113/EP091937
- [5] S. A. Horsley, R. D. Herbart, and L. Ada, “Four weeks of daily stretch has little or no effect on wrist contracture after stroke: A randomised controlled trial,” Australian J. of Physiotherapy, Vol.54, No.1, pp. 33-38, 2008. https://doi.org/10.1016/S0004-9514(07)70004-1
- [6] E. Ambrosini, C. De Marchis, A. Pedrocchi, G. Ferrigno, M. Monticone, M. Schmid, T. D’Alessio, S. Conforto, and S. Ferrante, “Neuro-mechanics of recumbent leg cycling in post-acute stroke patients,” Annals of Biomedical Engineering, Vol.44, No.11, pp. 3238-3251, 2016. https://doi.org/10.1007/s10439-016-1660-0
- [7] R. Nardone, A. Orioli, S. Golaszewski, F. Brigo, L. Sebastianelli, Y. Höller, V. Frey, and E. Trinka, “Passive cycling in neurorehabilitation after spinal cord injury: A review,” The J. of Spinal Cord Medicine, Vol.40, No.1, pp. 8-16, 2017. https://doi.org/10.1080/10790268.2016.1248524
- [8] S. D. Holzapfel, P. R. Bosch, C. D. Lee, P. S. Pohl, M. Szeto, B. Heyer, and S. D. Ringenbach, “Acute effects of assisted cycling therapy on post-stroke motor function: A pilot study,” Rehabilitation Research and Practice, Article No.9028714, 2019. https://doi.org/10.1155/2019/9028714
- [9] W. R. Galvão, L. K. C. Silva, M. F. Formiga, G. A. P. Thé, C. D. C. d. M. Faria, R. T. Viana, and L. A. O. Lima, “Cycling using functional electrical stimulation therapy to improve mobility after stroke: A systematic review and meta-analysis,” BioMedical Engineering OnLine, Vol.23, No.1, 2024. https://doi.org/10.1186/s12938-023-01195-8
- [10] O. Kiehn, “Decoding the organization of spinal circuits that control locomotion,” Nature Reviews Neuroscience, Vol.17, No.4, pp. 224-238, 2016. https://doi.org/10.1038/nrn.2016.9
- [11] A. J. Northcutt and D. J. Schulz, “Molecular mechanisms of homeostatic plasticity in central pattern generator networks,” Dev. Neurobiol., Vol.80, Nos.1-2, pp. 58-69, 2020. https://doi.org/10.1002/dneu.22727
- [12] A. G. Feldman, M. F. Levin, A. Garofolini, D. Piscitelli, and L. Zhang, “Central pattern generator and human locomotion in the context of referent control of motor actions,” Clinical Neurophysiology, Vol.132, No.11, pp. 2870-2889, 2021. https://doi.org/10.1016/j.clinph.2021.08.016
- [13] Y. P. Ivanenko, R. E. Poppele, and F. Lacquaniti, “Motor control programs and walking,” The Neuroscientist, Vol.12, No.4, pp. 339-348, 2006. https://doi.org/10.1177/1073858406287987
- [14] F. Michaud, M. S. Shourijeh, B. J. Fregly, and J. Cuadrado, “Do muscle synergies improve optimization prediction of muscle activations during gait?,” Frontiers in Computational Neuroscience, Vol.14, No.54, 2020. https://doi.org/10.3389/fncom.2020.00054
- [15] F. Hug, N. A. Turpin, A. Couturier, and S. Dorel, “Consistency of muscle synergies during pedaling across different mechanical constraints,” J. of Neurophysiology, Vol.106, No.1, pp. 91-103, 2011. https://doi.org/10.1152/jn.01096.2010
- [16] S. A. Safavynia, G. Torres-Oviedo, and L. H. Ting, “Muscle synergies: Implications for clinical evaluation and rehabilitation of movement,” Topics in Spinal Cord Injury Rehabilitation, Vol.17, No.1, pp. 16-24, 2011. https://doi.org/10.1310/sci1701-16
- [17] H. J. Hermens, B. Freriks, C. Disselhorst-Klug, and G. Rau, “Development of recommendations for SEMG sensors and sensor placement procedures,” J. of Electromyography and Kinesiology, Vol.10, No.5, pp. 361-374, 2000. https://doi.org/10.1016/s1050-6411(00)00027-4
- [18] H. Nakamura, “Essential knowledge of biometry 1 (electromyogram),” Japanese J. of Medical Electronics and Biological Engineering, Vol.57, Nos.4-5, pp. 149-157, 2019. (in Japanese).
- [19] D. D. Lee and H. S. Seung, “Learning the parts of objects with nonnegative matrix factorization,” Nature, Vol.401, pp. 788-791, 1999. https://doi.org/10.1038/44565
- [20] H. Kaneoka, “Non-negative matrix factorization,” J. of the Society of Instrument and Control Engineers, Vol.51, No.9, pp. 835-844, 2012. (in Japanese).
- [21] S. Kuroda, J. She, S. Nakamuro, R. Wang, D. Chugo, K. Ishiguro, H. Sakai, and H. Hashimoto, “Selecting pedal load for lower-limb rehabilitation based on the combination of muscle synergy and fourier series,” J. Adv. Comput. Intell. Intell. Inform., Vol.28, No.3, pp. 595-605, 2024. https://doi.org/10.20965/jaciii.2024.p0595
- [22] Y. Hara, M. Yoshida, M. Matsumura, and N. Ichihashi, “Evaluation of muscle activities with integrated EMG,” The Trans. of the Institute of Electrical Engineers of Japan C, Vol.124, No.2, pp. 431-435, 2004. (in Japanese).
- [23] R. R. Neptune, D. J. Clark, and S. A. Kautz, “Modular control of human walking: a simulation study,” J. of Biomechanics, Vol.42, No.9, pp. 1282-1287, 2009. https://doi.org/10.1016/j.jbiomech.2009.03.009
- [24] D.-S. Komaris, D. Tsaopoulos, K. Risvas, S. Nikolopoulos, V. Baltzopoulos, C. Maganaris, and I. Kompatsiaris, “Comparative analysis of muscle synergies in gait of stroke patients and healthy controls,” Front. Hum. Neurosci., Vol.19, Article No.1601147, 2025. https://doi.org/10.3389/fnhum.2025.1601147
This article is published under a Creative Commons Attribution-NoDerivatives 4.0 Internationa License.