
Research Paper:
Impact of Corporate Digital Transformation on ESG Performance
Jiawen Xu*,**, Kai Yang*,**, Wang Liu*,**, and Wentao Gu*,**,†
*Laboratory for Statistical Monitoring and Intelligent Governance of Common Prosperity
No.18 Xuezheng Street, Xiasha Higher Education Park, Hangzhou, Zhejiang 310018, China
**Department of Statistics, School of Statistics and Mathematics, Zhejiang Gongshang University
No.18 Xuezheng Street, Xiasha Higher Education Park, Hangzhou, Zhejiang 310018, China
†Corresponding author

The digital economy has emerged as a pivotal force reshaping global economic landscapes, prompting an increasing number of firms to prioritize digital transformation. This paper studies the influence of corporate digital transformation on Environmental, Social, and Governance (ESG) performance, integrating both theoretical analysis and empirical evidence. Utilizing a sample of China’s A-share listed firms covering the period 2013–2022, this paper investigates the impact of digital transformation on ESG performance and explores the mechanisms that underlie this relationship. The results reveal several key insights. First, corporate digital transformation is shown to have a beneficial effect on corporate ESG performance. Second, this effect operates through three distinct channels—it enhances environmental performance by fostering green innovation, improves social performance by strengthening corporate reputation, and boosts governance performance by reducing agency costs. Third, the positive impact exhibits notable heterogeneity, which is more pronounced in technology-based firms and those with high carbon emissions. Based on these conclusions, the paper offers corresponding suggestions.
1. Introduction
In the context of the sustained expansion of the digital economy, digital transformation has been regarded as a key strategic choice for firms, particularly since the “Digital China” initiative was proposed in 2015. China’s digital transformation is no longer limited to technology-intensive enterprises. This has gradually expanded across various industries and continued to deepen. Meanwhile, as the economies of various countries continue to develop and information technology progresses, the environmental issues that enterprises have overlooked in the pursuit of short-term economic benefits have become increasingly prominent. In this context, the concepts of global sustainable development and China’s carbon-neutrality agenda have gained increasing prominence. Consequently, the Environmental, Social, and Governance (ESG) framework, which focuses on environmental stewardship, social commitment, and effective governance, has gradually become central to corporate sustainability. It not only creates fresh momentum for enterprise sustainability, but also contributes to the stable and lasting development of the broader economy. These parallel developments raise an important question: can ESG performance be strengthened by corporate digital transformation, and if so, through what specific mechanisms?
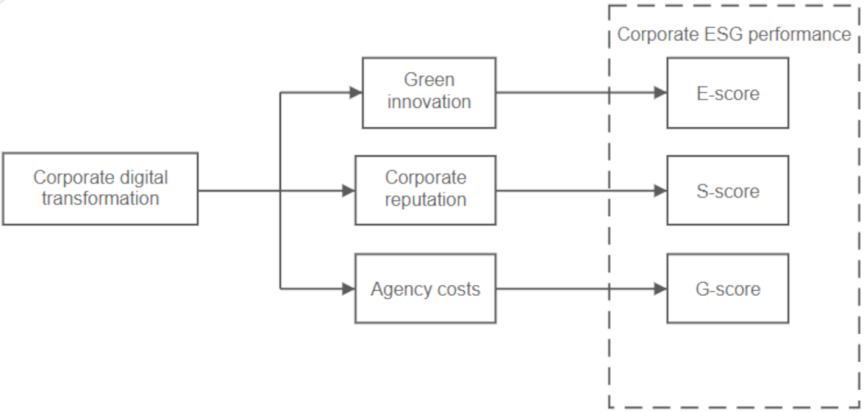
Fig. 1. Mechanism of the mediation effect model.
Taking Chinese A-share listed companies as a sample, this study investigates the association between corporate digital transformation and firms’ overall ESG outcomes, as well as its three individual dimensions, environmental, social, and governance performance. Moreover, this study investigates several plausible channels through which digital transformation might shape ESG outcomes. More specifically, digitalization may promote environmentally oriented innovation activities, strengthen the firms’ external reputations, improve communication and interaction with stakeholders by increasing the standard of transparency and information disclosure, and alleviate agency conflicts through the enhancement of governance efficiency. The specific impact paths are shown in Fig. 1. The main significance and innovation of this study are reflected in two aspects:
-
(1)
It provides a more comprehensive understanding of ESG performance across several dimensions and enhances the theoretical framework between corporate digitization and ESG performance. An integrated framework was constructed, linking digital transformation with the three core elements of ESG, and revealing the relationships and influencing mechanisms among them. By incorporating green innovation, corporate reputation, and agency costs as mediating variables, this study further identifies the concrete ways through which digital transformation contributes to changes in firms’ ESG performance.
-
(2)
It conducts in-depth heterogeneity tests and innovatively explores three dimensions—ownership characteristics, whether the firm belongs to the technology-oriented category, and the carbon emission volume of the enterprise—to discover the differentiated performances of different types of enterprises during digital transformation.
2. Current Literature Review
2.1. Corporate Digital Transformation and ESG Performance
Corporate digital transformation involves integrating digital technologies with traditional production methods. Through technological innovation it reconfigures the production factors to unlock new value potential. It emphasizes the role of leveraging digital technologies in processing and analyzing data, generating executable information, developing new business models, and enhancing enterprise performance and market influence during the transformation process 1,2,3. Existing research operationalizes digital transformation using indicator-based evaluation frameworks 4, firm-level digital input/disclosure proxies 5, and text analysis measures based on corporate reports 6. ESG performance captures corporate sustainability outcomes across environmental, social, and corporate governance dimensions 7. Research on the determinants of ESG performance examines both macro- and micro-level factors. From a broader perspective, the drivers of corporate social responsibility are shaped by political, social, and cultural contexts 8. Under the backdrop of “carbon peak and carbon neutrality,” the ESG performance of enterprises, especially their environmental performance, will receive continuous attention and strict supervision from the government. From a micro perspective, most studies investigate ESG determinants based on managerial characteristics and organizational structures. Following prior practice, this study uses ESG ratings from the Bloomberg Database as the measurement indicators.
2.2. Digital Transformation’s Impact on Corporate ESG Performance
Prior evidence suggests that digital transformation contributes positively to corporate ESG performance 9,10. Mechanistically, digitalization may enhance ESG outcomes by facilitating green innovation. Existing research has found that among the five dimensions that constitute enterprise digital transformation, blockchain technology exerts the strongest promoting effect on the enterprises’ ESG performance 10. In addition, green innovation, greater internal information transparency, and enterprises’ management efficiency play mediating roles. Digital transformation can also enhance ESG performance by lowering agency costs through more effective governance 11 and strengthening corporate reputation and stakeholder communication via better disclosure and transparency 12. These arguments motivated the hypotheses presented in the next section.
Most prior studies have concentrated on firms’ overall ESG performance when examining the consequences of digital transformation. In contrast, limited attention has been paid to how digital transformation affects each individual ESG component, namely environmental performance, social outcomes, and company governance performance, as well as the mechanisms behind these effects. By analyzing the links between enterprise digital transformation and various ESG dimensions, we can clearly understand how digitalization specifically influences performance in different ways, thereby influencing the comprehensive ESG performance of the enterprise. This is conducive to identifying the growth points that enhance an enterprise’s ESG performance. Therefore, this study aims to help firms recognize the significance of digital transformation, understand how it works to enhance their environmental, societal, and governance performance and provide corresponding suggestions for the strategic decisions of enterprises and policy-making in government departments.
3. Research Hypotheses and Design
3.1. Research Hypotheses
3.1.1. The Influence of Corporate Digital Transformation on ESG Performance
The adoption of digital technology provides a solid foundation for the continuous growth and enhancement of an enterprise’s market competitiveness. Therefore, while pursuing their own economic benefits, enterprises are more willing to subjectively undertake social responsibility. Moreover, enterprises tend to be constrained in terms of financing precisely because of the information asymmetry between themselves and outside investors. However, digital transformation can significantly alleviate this situation 13,14. Enterprise digital transformation improves information communication. On the one hand, it enables enterprises to have a deeper understanding of market demand; on the other hand, it also strengthens the external supervision of enterprises, prompting them to behave more responsibly. In conclusion, from the perspectives of both internal motivation and external governance pressure, digital transformation contributes to stronger corporate responsibility fulfillment and, consequently, better ESG performance. Based on the above discussion, the following hypotheses are proposed:
-
H1:
Corporate digital transformation contributes positively to ESG performance.
3.1.2. Corporate Digital Transformation, Green Innovation, and E-Score
Digitalization facilitates openness, information sharing, and interorganizational collaboration. When enterprises undergo digital transformation, they can alleviate environmental information and financing constraints, enhance their ability to integrate and optimize technologies and resources, and promote green innovation 15, thereby improving their environmental performance. Specifically, in terms of alleviating environmental information constraints, digital transformation accelerates information circulation and resource sharing, enabling enterprises to build innovative cooperation networks and ecosystems 16, thereby promoting the learning, borrowing, and collaborative research and development of green technologies. In terms of financing constraints, digital transformation effectively alleviates information asymmetry and agency problems by improving enterprise information transparency, strengthening the willingness to disclose information, and improving internal governance. These changes make it easier for firms to secure stable long-term financial support for green innovation. Green innovation directly helps reduce energy use and emissions during production and improves resource efficiency. Therefore, digital transformation, by stimulating green technological innovation, ultimately improves enterprises’ environmental performance. Based on the above analysis, the following hypotheses are proposed:
-
H2:
Corporate digital transformation promotes the environmental dimension of ESG performance through green technological innovation.
3.1.3. Corporate Digital Transformation, Corporate Reputation, and S-Score
Digital transformation has enhanced the communication capabilities of enterprises, not only accelerating the internal information flow within the organization but also strengthening interaction with the external public. This enables an enterprise to effectively convey its brand value, corporate culture, and social responsibility through various channels and platforms, thereby enhancing its transparency and consumers’ trust in it. Consequently, the enterprise’s reputation improves. The pressure effect formed by the attention of external investors and the public prompts enterprises to restrain themselves. A good corporate reputation motivates enterprises to proactively fulfill their social obligations 17. Therefore, through the intermediary mechanism of enhancing corporate reputation, it is possible to promote social performance in the ESG aspect of the enterprises. Given the aforementioned examination, the H3 hypothesis is formulated.
-
H3:
Digital corporate transformation advances the social aspects of ESG performance by boosting a company’s reputation.
3.1.4. Corporate Digital Transformation, Agency Costs, and G-Score
There is no clear consensus in the literature on the effects of digital transformation on agency costs. Some scholars believe that digital transformation can reduce enterprises’ agency costs by alleviating information asymmetry, reinforcing internal controls, and attracting external monitoring 18. On the other hand, there is a view suggesting that the two factors have an inverted “U”-shaped relationship. In the early stages of transformation, due to changes in business strategies or business models, it may intensify information asymmetry, cause uncoordinated organizational structures, and expand the space for shareholders’ opportunism, thereby leading to an increase in governance costs 19. However, as the transformation progresses and experience accumulates, digital technology can achieve real-time supervision of business activities, restrain the behavior of agents, and encourage the alignment of the goals of the principal and agent, thereby reducing agency costs. Lower agency costs indicate that management is more aligned with the firm’s long-term interests, which helps promote the effective implementation of social responsibility and ESG strategies formulated by the board of directors, thereby improving corporate governance performance. Based on the preceding discussion, we postulated H4.
-
H4:
Corporate digital transformation affects the governance dimension of ESG performance through agency costs, and an inverted U-shaped link exists between digital transformation and agency costs.
3.1.5. The Impact of Digital Transformation on Corporate ESG Performance: Heterogeneity of Corporate Property Rights
The role of ESG performance in achieving long-term corporate sustainability has become increasingly prominent. Although fulfilling social responsibilities can bring long-term benefits to an enterprise, it is also a long-term investment. Currently, state-owned enterprises demonstrate significant advantages over private enterprises in ESG practices. Relevant studies show that state-owned firms bear greater social responsibility and have more concentrated resources than their privately owned counterparts 20. They can effectively allocate and utilize resources to support enterprises in implementing ESG practices. Private enterprises are confronted with intense competitive pressures and survival challenges, leading managers to prioritize short-term profitability and immediate economic returns when formulating business strategies. Therefore, social responsibility can be viewed as a long-term investment that incurs additional short-term costs. Based on this reasoning, H5 is formulated.
-
H5:
ESG performance of state-owned businesses is more affected by digital transformation than that of private businesses.
3.1.6. The Impact of Digital Transformation on Corporate ESG Performance: Heterogeneity of Technology-Based Enterprises
Technology-based enterprises usually have keen insight and rapid adaptability to new technologies. Due to their inherent technical foundations and professional knowledge, they have advantages in the digital transformation process. For non-technology enterprises that lack technical expertise, they are prone to falling into the “pseudo-digitalization” trap during the process of digital transformation. “Fake digitalization” refers to a situation in which enterprises merely apply digital technologies superficially, resulting in their investment in digital transformation failing to translate into actual economic benefits and their resource allocation becoming inefficient or even ineffective. These enterprises lack clear strategic planning during the transformation process and merely adopt digital tools without considering the integration of digital technologies with their long-term goals, or addressing business needs and problems. In the trap of “fake digitalization,” enterprises may also overlook the importance of employee training, which affects the effective utilization of digital tools. Based on this reasoning, H6 is proposed.
-
H6:
Compared with non-technology-based enterprises, technology-based enterprises experience greater enhancement in ESG performance due to digital transformation.
3.1.7. The Impact of Digital Transformation on the ESG Performance of Corporate: Heterogeneity in Corporate Carbon Emissions
Previous research has shown that digital transformation can significantly improve the environmental performance of heavily polluting enterprises. By introducing digital tools such as intelligent production systems and real-time monitoring, production processes were optimized, significantly reducing energy consumption and carbon emissions 21. Digital technologies not only improved the production processes of these enterprises but also enhanced the efficiency of input-output, promoting the transformation of the production model towards a green one. Compared to enterprises with a lower pollution intensity, heavily polluting firms possess a greater potential for improvement in environmental performance. Consequently, digital transformation yields a more pronounced improvement in environmental performance, which amplifies its overall effect on ESG ratings. In view of the preceding discussion, H7 is proposed.
-
H7:
The influence of digital transformation on ESG outcomes is greater in heavy-polluting enterprises than in non-heavy-polluting enterprises.
3.2. Research Design
3.2.1. Sample Selection and Data Sources
The initial sample comprises Chinese A-share listed firms for the period of 2013–2022. After eliminating firms designated as ST and *ST from the sample and handling missing and extreme values, we obtained a final sample of 7,624 firm-year observations. The data were mainly sourced from the CSMAR and Bloomberg databases.
| Variable type | Variable name | Symbol | Calculation method |
| Explanatory variable | Corporate digital transformation | \(\textit{Digital}\) | CSMAR Database Enterprise Digital Transformation Index |
| Explained variable | ESG score | \(\textit{ESG}\_\textit{score}\) | Bloomberg Database ESG Rating Measures the company’s overall ESG score, with the natural logarithm taken for the \(E\) score, \(S\) score, and \(G\) score, respectively |
| E score | \(\textit{E}\_\textit{score}\) | ||
| S score | \(\textit{S}\_\textit{score}\) | ||
| G score | \(\textit{G}\_\textit{score}\) | ||
| Mediating variable | Green innovation | \(\textit{Patent}\) | Log of green patent applications plus one |
| Corporate reputation | \(\textit{Fame}\) | Factor-analysis-based reputation score from 12 indicators, following Guan et al. 22; converted to deciles (\(1= \textrm{lowest}\), \(10= \textrm{highest}\)). | |
| Agency costs | \(\textit{Mfee}\) | Administrative Expenses/Operating Revenue | |
| Control variable | Firm size | \(\textit{Size}\) | Natural logarithm of total assets at period end |
| Institutional ownership | \(\textit{INST}\) | The sum of the shareholding proportions of various institutional investors within an enterprise | |
| Listing age | \(\textit{Age}\) | Natural logarithm of the company’s listing duration | |
| Ownership concentration (TOP10) | \(\textit{Top10}\) | Number of Shares Held by Top Ten Shareholders / Total Number of Shares Issued by the Company | |
| Board independence | \(\textit{Indep}\) | Number of Independent Directors / Total Number of Directors | |
| CEO duality | \(\textit{Dual}\) | Where the Chairman and Chief Executive Officer are the same person, counted as 1; otherwise counted as 0 | |
| CEO age | \(\textit{CEO}\_\textit{age}\) | Natural logarithm of CEO age | |
| Year fixed effects | \(\textit{Year}\) | Assigns 1 for the specified year, otherwise 0 | |
| Industry fixed effects | \(\textit{Industry}\) | 1 for this industry, 0 otherwise |
3.2.2. Definition and Measurement of Variables
Corporate digital transformation (\(\textit{Digital}\)): The key explanatory variable, \(\textit{Digital}\), was measured using the Corporate Digital Transformation Index provided by the CSMAR database. This metric is a pre-constructed overall score calculated by the CSMAR based on a weighted indicator system covering six dimensions: strategic orientation, technology-driven capability, organizational empowerment, environmental support, digitalization outcomes, and digitalization applications. The weights of the indicators for these six dimensions were 34.72%, 16.2%, 9.69%, 3.42%, 27.13%, and 8.84%. Based on this, they are further divided into different secondary indicators. We directly used the overall index calculated from the database. To address outlier concerns, we winsorize all continuous variables at the 1st and 99th percentiles. After winsorization, \(\textit{Digital}\) ranges from 2.33767 to 6.84477 in our sample.
ESG performance (\(\textit{ESG}\_\textit{score}\), \(\textit{E}\_\textit{score}\), \(\textit{S}\_\textit{score}\), and \(\textit{G}\_\textit{score}\)): ESG performance was obtained from Bloomberg ESG ratings. Following prior studies, we take the natural logarithm of \(\textit{ESG}\_\textit{score}\) and its three pillar scores (\(E\), \(S\), and \(G\)).
Mediating variables: Three mediating channels were considered. Green innovation (\(\textit{Patent}\)) is proxied by the natural logarithm of one plus the number of green patent applications. Corporate reputation (\(\textit{Fame}\)) is constructed by applying factor analysis to 12 reputation-related indicators to obtain a composite reputation score. Firms are then sorted into deciles based on this score and assigned values from 1 to 10 22. This composite score captures stakeholders’ overall perceptions of a firm based on multiple performance and governance dimensions and has been widely used as a proxy for corporate reputation. Agency costs (\(\textit{Mfee}\)) are proxied using the management expense ratio (management expenses scaled by operating revenue), which captures managerial inefficiency and potential agency problems. Higher management expense ratios often indicate greater agency frictions and managerial opportunism. Digital transformation can improve transparency and internal monitoring, thereby mitigating such agency costs and affecting ESG outcomes.
Control variables: We include a standard set of firm-level controls and add year- and industry-fixed effects. Detailed definitions and constructions of all variables are summarized in Table 1.
3.3. Model
3.3.1. Baseline Model
According to theoretical reasoning, digital transformation is expected to enhance corporate ESG performance. To test this hypothesis, the following baseline panel regression model is constructed:
3.3.2. Mediation Models
The specific model of the mediating effect is as follows: the environmental score \(\textit{E}\_\textit{score}\) is taken as the dependent variable and green innovation Patent as the mediator. Model (2) tests how digital transformation affects \(\textit{E}\_\textit{score}\), Model (3) examines its effect on green innovation, and Model (4) analyses whether the extent to which digital transformation influences \(\textit{E}\_\textit{score}\) changes after the introduction of green innovation.
In the Social dimension, using corporate reputation as a mediator is similar to Models (2)–(4). We replace \(\textit{E}\_\textit{score}\) and \(\textit{Patent}\) in the above formula with \(\textit{S}\_\textit{score}\) and \(\textit{Fame}\), respectively, to obtain new models (5)–(7) for an enterprise’s social performance. Similarly, in the Governance dimension, using agency costs as the mediator, we replace \(\textit{E}\_\textit{score}\) and \(\textit{Patent}\) in Models (2)–(4) with \(\textit{G}\_\textit{score}\) and \(\textit{Mfee}\), respectively, to obtain new models (8)–(10) for the enterprise’s governance performance.
If in the three mediation models, the coefficients \(\alpha_2\), \(\beta_2\), and \(\gamma_3\) are all significant, while \(\gamma_2\) is insignificant, this indicates full mediation. If the coefficients \(\alpha_2\), \(\beta_2\), \(\gamma_2\), and \(\gamma_3\) remain significant, this indicates partial mediation.
4. Empirical Results and Analysis
4.1. Descriptive Statistics and Correlation Analysis
In Table 2, the mean \(\textit{ESG}\_\textit{score}\) was 3.43, with a standard deviation of 0.30, whereas the digital transformation index averaged 3.81 with a standard deviation of 1.09. Environmental performance shows relatively weaker and more dispersed outcomes than other ESG dimensions. In Table 3, the correlation matrix indicated that except for the associations linking the aggregate ESG score with its three sub-dimensions, most pairwise correlations were below 0.5, suggesting no serious multicollinearity.
4.2. Baseline Regression Results
4.2.1. Impact of Corporate Digital Transformation on ESG Performance
Model (1) provided evidence of a positive association between digital transformation and ESG performance across all the specifications. The regression results are presented in Table 4. After adding full controls, Column (3) showed that the coefficient of \(\textit{Digital}\) was 0.014 and was statistically significant at the 1% level, implying an increase in ESG performance with higher digitalization, thus supporting H1. Among the controls, the regression coefficients for firm size, ownership concentration, and board independence were 1.620, 0.108, and 0.127, respectively, and were all significant at the 1% level. However, the coefficient for institutional ownership was 0.009, reaching significance at the 10% level.
Overall, digital transformation fostered superior ESG outcomes by strengthening operational efficiency, transparency, and effective governance.
| Variable | Mean | Standard deviation | Minimum | Maximum |
| \(\textit{ESG}\_\textit{score}\) | 3.43 | 0.30 | 2.64 | 4.10 |
| \(\textit{E}\_\textit{score}\) | 1.74 | 1.33 | 0 | 4.09 |
| \(\textit{S}\_\textit{score}\) | 2.68 | 0.47 | 1.44 | 3.73 |
| \(\textit{G}\_\textit{score}\) | 4.20 | 0.22 | 3.50 | 4.50 |
| \(\textit{Digital}\) | 3.81 | 1.09 | 2.34 | 6.84 |
| \(\textit{Patent}\) | 0.52 | 1 | 0 | 4.42 |
| \(\textit{Fame}\) | 7.54 | 2.43 | 1 | 10 |
| \(\textit{Mfee}\) | 2.14 | 2.22 | 1.00 | 18.42 |
| \(\textit{Size}\) | 3.20 | 0.050 | 3.09 | 3.34 |
| \(\textit{INST}\) | 3.94 | 0.56 | 1.69 | 4.56 |
| \(\textit{Age}\) | 13.67 | 6.92 | 1 | 28 |
| \(\textit{Top10}\) | 0.61 | 0.15 | 0.26 | 0.93 |
| \(\textit{Indep}\) | 0.38 | 0.06 | 0.33 | 0.57 |
| \(\textit{Dual}\) | 0.22 | 0.41 | 0 | 1 |
| \(\textit{CEO}\_\textit{age}\) | 3.93 | 0.35 | 3.56 | 4.17 |
| \(\textit{ESG}\_\textit{score}\) | \(\textit{E}\_\textit{score}\) | \(\textit{S}\_\textit{score}\) | \(\textit{G}\_\textit{score}\) | \(\textit{Digital}\) | \(\textit{Patent}\) | \(\textit{Fame}\) | ||
| \(\textit{ESG}\_\textit{score}\) | 1 | |||||||
| \(\textit{E}\_\textit{score}\) | 0.742 | 1 | ||||||
| \(\textit{S}\_\textit{score}\) | 0.668 | 0.419 | 1 | |||||
| \(\textit{G}\_\textit{score}\) | 0.823 | 0.331 | 0.29 | 1 | ||||
| \(\textit{Digital}\) | 0.129 | 0.024 | 0.081 | 0.151 | 1 | |||
| \(\textit{Patent}\) | 0.185 | 0.189 | 0.176 | 0.093 | 0.263 | 1 | ||
| \(\textit{Fame}\) | 0.25 | 0.204 | 0.193 | 0.168 | 0.053 | 0.125 | 1 | |
| \(\textit{Mfee}\) | \(-\)0.027 | \(-\)0.096 | \(-\)0.038 | \(-\)0.031 | 0.028 | \(-\)0.071 | \(-\)0.065 | |
| \(\textit{Size}\) | 0.469 | 0.366 | 0.324 | 0.365 | 0.016 | 0.211 | 0.402 | |
| \(\textit{INST}\) | 0.174 | 0.141 | 0.094 | 0.14 | \(-\)0.128 | 0.016 | 0.28 | |
| \(\textit{Age}\) | 0.22 | 0.134 | 0.079 | 0.221 | \(-\)0.054 | \(-\)0.045 | \(-\)0.002 | |
| \(\textit{Top10}\) | 0.139 | 0.124 | 0.115 | 0.094 | \(-\)0.164 | \(-\)0.021 | 0.266 | |
| \(\textit{Indep}\) | 0.085 | 0.048 | 0.058 | 0.077 | 0.055 | 0.014 | 0.089 | |
| \(\textit{Dual}\) | 0.004 | \(-\)0.009 | \(-\)0.013 | 0.013 | 0.127 | 0.044 | \(-\)0.013 | |
| \(\textit{CEO}\_\textit{age}\) | 0.133 | 0.113 | 0.072 | 0.112 | \(-\)0.025 | 0.026 | 0.08 | |
| \(\textit{Mfee}\) | \(\textit{Size}\) | \(\textit{INST}\) | \(\textit{Age}\) | \(\textit{Top10}\) | \(\textit{Indep}\) | \(\textit{Dual}\) | \(\textit{CEO}\_\textit{age}\) | |
| \(\textit{Mfee}\) | 1 | |||||||
| \(\textit{Size}\) | 0.18 | 1 | ||||||
| \(\textit{INST}\) | \(-\)0.01 | 0.40 | 1 | |||||
| \(\textit{Age}\) | 0.04 | 0.28 | 0.24 | 1 | ||||
| \(\textit{Top10}\) | \(-\)0.03 | 0.27 | 0.49 | \(-\)0.18 | 1 | |||
| \(\textit{Indep}\) | 0.02 | 0.09 | 0.01 | \(-\)0.01 | 0.07 | 1 | ||
| \(\textit{Dual}\) | \(-\)0.01 | \(-\)0.11 | \(-\)0.18 | \(-\)0.18 | \(-\)0.03 | 0.09 | 1 | |
| \(\textit{CEO}\_\textit{age}\) | \(-\)0.02 | 0.15 | 0.14 | 0.10 | 0.08 | 0.06 | 0.16 | 1 |
| Variable | \(\textit{ESG}\_\textit{score}\) | \(\textit{ESG}\_\textit{score}\) | \(\textit{ESG}\_\textit{score}\) |
| (1) | (2) | (3) | |
| \(\textit{Digital}\) |
0.028\(^{***}\) (9.43) |
0.012\(^{***}\) (4.36) |
0.014\(^{***}\) (4.79) |
| \(\textit{Size}\) |
1.680\(^{***}\) (31.86) |
1.620\(^{***}\) (30.39) |
|
| \(\textit{INST}\) |
0.022\(^{***}\) (5.13) |
0.009\(^{*}\) (1.89) |
|
| \(\textit{Age}\) |
\(-\)0.001\(^{***}\) (\(-\)2.74) |
0.001 (0.01) |
|
| \(\textit{Top10}\) |
0.108\(^{***}\) (6.02) |
||
| \(\textit{Indep}\) |
0.127\(^{***}\) (3.19) |
||
| \(\textit{Dual}\) |
0.005 (0.89) |
||
| \(\textit{CEO}\_\textit{age}\) |
\(-\)0.001 (\(-\)0.43) |
||
| Constant |
3.322\(^{***}\) (284.41) |
\(-\)2.062\(^{***}\) (\(-\)12.72) |
\(-\)1.945\(^{***}\) (\(-\)11.93) |
| \(\textit{Year}\) | Control | Control | Control |
| \(\textit{Industry}\) | Control | Control | Control |
| \(R^2\) | 0.562 | 0.626 | 0.629 |
Note: *, **, and *** denote significance at the 10%, 5%, and 1% levels, respectively; values in parentheses indicate \(t\)-statistics.
4.2.2. Mediation Mechanisms Test
The mediation test results and Bootstrap mediation effect results are presented in Tables 5 and 6.
(1) Green Innovation as a Mediator: Environmental Performance Channel
Models (2)–(4) indicated that \(\textit{Digital}\) technology had a significantly positive effect on environmental performance and promoted green innovation. For every 1% increase in the enterprise digital transformation index, the environmental performance of the enterprise was expected to improve by approximately 0.059%, and the enterprise’s green innovation was expected to increase by 0.169%. When both \(\textit{Digital}\) and \(\textit{Patent}\) data were included, both remained significant, suggesting a partial mediation. After taking the enterprise green innovation as the mediating variable, according to the results in Column (3), when the enterprise’s digital transformation increased by 1%, the enterprise’s environmental performance improved by 0.039%, and the regression coefficient of \(\textit{Patent}\) was 0.119. This indicated that a 1% increase in the level of green innovation led to a 0.119% increase in environmental performance. This finding demonstrated the mediating effect of enterprise green innovation in this process. Moreover, in Column (3), the regression coefficient of the enterprise’s digital transformation was still significant but smaller than that in Column (1), which provided further evidence of partial mediation.
These results implied that green innovation is an important mechanism by which enterprise digital transformation improves environmental performance. Digital transformation can facilitate green upgrading by accelerating information circulation and resource sharing, mitigating information asymmetry and principal–agent problems, and easing information and financing constraints, thereby supporting green innovation activities. Improved green innovation capability can reduce energy consumption and pollutant emissions during production, enhance resource utilization efficiency, and ultimately improve environmental performance. The bootstrap results also confirmed a meaningful indirect effect. The direct effect was 0.414, the indirect effect was 0.289, and the total effect was 0.703, with green innovation accounting for 41.11% of the total effect, providing additional support for H2.
(2) Corporate Reputation as a Mediator: Social Performance Channel
The results for Models (5)–(7) showed that \(\textit{Digital}\) technology significantly increases social performance and corporate reputation. For every 1% increase in the enterprise digital transformation index, the social performance of the enterprise was expected to improve by approximately 0.029%, and the enterprise’s reputation was expected to increase by 0.132%. When \(\textit{Fame}\) was included, both \(\textit{Digital}\) and \(\textit{Fame}\) remained significant. The regression coefficient of \(\textit{Fame}\) was 0.011, meaning that when an enterprise’s reputation increased by 1%, social performance increased by approximately 0.011%. This indicated that enterprise reputation plays a mediating role in the impact of an enterprise’s digital transformation on its social performance. Bootstrap evidence suggested that the indirect pathway dominates (93.30%), supporting H3. Enterprise digital transformation can enhance communication within the organization, which enables the enterprise to better understand external voices and continuously upgrade products to meet consumer needs, thereby establishing a brand image and improving the enterprise’s reputation. Simultaneously, the enterprise can convey a positive image to the public through various means to enhance its reputation. A good reputation for the enterprise encourages it to undertake more social responsibilities and improves the enterprise’s social performance, and when external attention is higher, the enterprise fulfills more social responsibilities, resulting in better ESG performance.
(3) Agency Costs as a Mediator: Governance Performance Channel
To verify H4, regression estimates were conducted on Models (8)–(10), and the results were presented in Table 5. Column (1) showed the effect of an enterprise’s digital transformation on its governance performance. The coefficient of \(\textit{Digital}\) was 0.024 and was significantly positive at the 5% level, indicating that digital transformation contributes positively to corporate governance. In contrast, as the score of corporate digital transformation, the coefficient of \(\textit{Digital}\_\textit{sq}\) failed to achieve statistical significance in this specification. Column (2) verified the association between an enterprise’s digital transformation and agency costs. The coefficient of \(\textit{Digital}\) was 0.266, which was significantly positive at the 10% level, suggesting that digital transformation may initially increase agency costs. Meanwhile, the squared term yielded a coefficient of \(-\)0.033, significantly negative at the 10% level, revealing an inverted U-shaped pattern in the relationship between digital transformation and agency costs.
After considering the agency costs as the mediating variable, a 1% increase in digital transformation corresponded to a 0.014% enhancement in governance performance. The squared term of \(\textit{Digital}\) was no longer significant, suggesting that although agency costs may rise temporarily in the early stages of digital transformation, governance performance does not necessarily decline. Instead, as the transformation progresses, the enterprise continuously absorbs the successful transformation experience and gradually integrates digital technology into production and operations.
| Variable | \(\textit{E}\_\textit{score}\) | \(\textit{Patent}\) | \(\textit{E}\_\textit{score}\) |
| (1) | (2) | (3) | |
| \(\textit{Digital}\) |
0.059\(^{***}\) (3.60) |
0.169\(^{***}\) (12.66) |
0.039\(^{**}\) (2.36) |
| \(\textit{Patent}\) |
0.119\(^{***}\) (8.50) |
||
| Variable | \(\textit{S}\_\textit{score}\) | \(\textit{Fame}\) | \(\textit{S}\_\textit{score}\) |
| (1) | (2) | (3) | |
| \(\textit{Digital}\) |
0.029\(^{***}\) (4.69) |
0.132\(^{***}\) (4.13) |
0.029\(^{***}\) (4.69) |
| \(\textit{Fame}\) |
0.011\(^{***}\) (4.97) |
||
| Variable | \(\textit{G}\_\textit{score}\) | \(\textit{Mfee}\) | \(\textit{G}\_\textit{score}\) |
| (1) | (2) | (3) | |
| \(\textit{Digital}\) |
0.024\(^{**}\) (2.09) |
0.266\(^{*}\) (1.65) |
0.014\(^{**}\) (2.12) |
| \(\textit{Digital}\_\textit{sq}\) |
\(-\)0.002 (\(-\)1.60) |
\(-\)0.033\(^{*}\) (\(-\)1.73) |
\(-\)0.002 (\(-\)1.63) |
| \(\textit{Mfee}\) |
\(-\)0.001\(^{*}\) (\(-\)1.66) |
| Type of effect | Mediation effect value | \(p\)-value | 95% confidence interval |
| \(\textit{Patent}\) | |||
| Direct effect | 0.414 | 0.000 | \([0.3182, 0.5105]\) |
| Indirect effect | 0.289 | 0.031 | \([0.0256, 0.5516]\) |
| Total effect | 0.703 | 0.000 | \([0.4378, 0.9681]\) |
| \(\textit{Fame}\) | |||
| Direct effect | 0.039 | 0.000 | \([0.0233, 0.0545]\) |
| Indirect effect | 0.543 | 0.000 | \([0.3894, 0.6961]\) |
| Total effect | 0.582 | 0.000 | \([0.4286, 0.7347]\) |
| \(\textit{Mfee}\) | |||
| Direct effect | 0.007 | 0.017 | \([0.0016, 0.0162]\) |
| Indirect effect | 1.795 | 0.000 | \([1.5654, 2.0241]\) |
| Total effect | 1.802 | 0.000 | \([1.5733, 2.0308]\) |
In addition, the coefficient of agency costs was \(-\)0.001 and significantly negative at the 10% level, indicating that lower agency costs are associated with better governance performance. When the agency cost of the enterprise decreased by 1%, enterprise governance performance increased by approximately 0.001%. Meanwhile, the mediation tests suggested that \(\textit{Digital}\) technology affects governance performance mainly through agency costs. Although agency costs may increase in the early stages, the overall indirect pathway is dominant. The indirect effect accounted for 99.61% of the total effect. The above results all demonstrated that H4, digital transformation, can enhance an enterprise’s performance in ESG governance by reducing agency costs, and there is an inverted “U”-shaped relationship between the two.
The mediation shares of the reputation and agency cost channels are relatively high. We interpreted these proportions cautiously for two reasons. First, for the social and governance dimensions of ESG, digital transformation may primarily exert its influence through intermediate organizational and stakeholder-related processes such as improved transparency, external monitoring, and governance efficiency, which is consistent with a largely indirect pathway. Second, measurement overlap may inflate mediation shares, because ESG ratings and reputation/governance proxies can partially reflect common information components related to disclosure and governance quality. Therefore, while the bootstrap results indicate statistically meaningful indirect effects, the magnitudes of the mediation shares should be viewed as suggestive rather than definitive. Future research should further examine additional parallel channels and alternative proxies.
4.3. Endogeneity Test
This study adopted an instrumental variable strategy to mitigate potential endogeneity concerns. Specifically, the average digital transformation index of other enterprises in the same city and industry was used as an instrument for enterprise digital transformation, and the estimation was conducted using two-stage least squares (2SLS).
The regression results are reported in Table 7. Column (1) reports the first-stage regression, in which the endogenous variable \(\textit{Digital}\) is instrumented by the average digital transformation index of other enterprises in the same city and industry. The coefficient of the instrument was 0.134 and statistically significant at the 1% level. Moreover, the corresponding first-stage \(F\)-statistic is approximately 2770.97 (\({t=52.64}\)), indicating that weak instrument concerns are unlikely. Column (2) presents the second-stage results, taking the ESG performance of enterprises as the explained variable. The estimated coefficient of \(\textit{Digital}\) was 0.044 and remained significantly positive at the 1% level. In terms of economic magnitude, a one-unit increase in \(\textit{Digital}\) technology was associated with a 0.044 increase in \(\textit{ESG}\_\textit{score}\). Taken together, these findings indicated that the beneficial influence of digital transformation on ESG outcomes remains robust after accounting for potential endogeneity, lending further support to H1.
| Variable | \(\textit{Digital}\) | \(\textit{ESG}\_\textit{score}\) |
| (1) | (2) | |
| \(\textit{Digital}\) |
0.044\(^{***}\) (11.27) |
|
| \(\textit{Digital}\_\textit{iv}\) |
0.134\(^{***}\) (52.64) |
|
| \(\textit{Size}\) |
2.156\(^{***}\) (10.23) |
2.208\(^{***}\) (27.83) |
| \(\textit{INST}\) |
0.024 (1.26) |
\(-\)0.022\(^{***}\) (\(-\)2.76) |
| \(\textit{Age}\) |
\(-\)0.000 (\(-\)0.08) |
0.006\(^{***}\) (9.03) |
| \(\textit{Top10}\) |
\(-\)0.323\(^{***}\) (\(-\)4.46) |
0.194\(^{***}\) (6.40) |
| \(\textit{Indep}\) |
0.195 (1.20) |
0.032 (0.47) |
| \(\textit{Dual}\) |
0.023 (1.08) |
0.023\(^{**}\) (2.47) |
| \(\textit{CEO}\_\textit{age}\) |
0.002 (1.33) |
0.003\(^{***}\) (3.77) |
| Constant |
\(-\)4.119\(^{***}\) (\(-\)6.20) |
\(-\)4.048\(^{***}\) (\(-\)16.91) |
| \(\textit{Year}\) | Control | Control |
| \(\textit{Industry}\) | Control | Control |
| \(R^2\) | 0.745 | 0.251 |
Note: First-stage \(F\)-statistics for the excluded instrument (\(\textit{Digital}\_\textit{iv}\)) \(=\) 2770.97 (\({t=52.64}\)).
4.4. Robustness Tests
4.4.1. Robustness Test of Benchmark Regression
This study adopted a method to replace the explained variable. The ESG scores of previous enterprises are based on rating data from the Bloomberg database. In the robustness test, Bloomberg ESG ratings were replaced with China Securities ESG ratings and the model was re-estimated. The regression results are shown in Table 8. Regression analysis is re-conducted on Model (1). After gradually incorporating control variables, including the size of the enterprise and the proportion of institutional investors’ holdings, the positive effect of digital transformation on ESG performance remains statistically significant.
| Variable | \(\textit{ESG}\_\textit{score}\) | \(\textit{ESG}\_\textit{score}\) | \(\textit{ESG}\_\textit{score}\) |
| (1) | (2) | (3) | |
| \(\textit{Digital}\) |
0.012\(^{***}\) (11.92) |
0.010\(^{***}\) (9.70) |
0.010\(^{***}\) (9.67) |
| \(\textit{Size}\) |
0.235\(^{***}\) (12.26) |
0.220\(^{***}\) (11.35) |
|
| \(\textit{INST}\) |
0.005\(^{***}\) (3.32) |
0.005\(^{**}\) (2.55) |
|
| \(\textit{Age}\) |
\(-\)0.001 (\(-\)1.61) |
\(-\)0.012 (\(-\)1.74) |
|
| \(\textit{Top10}\) |
0.001 (0.09) |
||
| \(\textit{Indep}\) |
0.127\(^{***}\) (8.83) |
||
| \(\textit{Dual}\) |
\(-\)0.006\(^{***}\) (\(-\)3.09) |
||
| \(\textit{CEO}\_\textit{age}\) |
0.002 (1.33) |
||
| Constant |
4.280\(^{***}\) (1,083.21) |
3.520\(^{***}\) (59.70) |
3.516\(^{***}\) (59.48) |
| \(\textit{Year}\) | Control | Control | Control |
| \(\textit{Industry}\) | Control | Control | Control |
| \(R^2\) | 0.100 | 0.124 | 0.134 |
Column (1), which includes only the core explanatory variable, yields an estimated coefficient of 0.012 for \(\textit{Digital}\). Column (2) reports the regression results after incorporating control variables, including firm size, institutional investor shareholding ratio, and firm listing age, with a regression coefficient of 0.01. Column (3) further incorporates the complete set of control variables, while the coefficient of \(\textit{Digital}\) remains at 0.01. When enterprises’ digital transformation increases by 1%, ESG performance is expected to increase by approximately 0.01%. In all the specifications, the coefficient is significantly positive at the 1% level. Taken together, these results are consistent with previous empirical evidence and provide further support for H1.
4.4.2. Robustness Test of Mediating Effect
To examine the robustness of the mediation mechanisms, we re-estimate Models (2)–(10) using the environmental, social, and governance dimensions of ESG performance.
The corresponding results are presented in Table 9. First, with corporate environmental performance as the explanatory variable, we examine whether green innovation serves as a mediating channel. The coefficients of \(\textit{Digital}\) and green innovation are 0.016 and 0.014, respectively, with each achieving statistical significance at the 1% level. Decomposing the total effect of 1.006 revealed a direct component of 0.238 and an indirect component of 0.768, with the latter explaining 76.34% of the overall effect, further validating H2 robustness.
Secondly, using corporate social performance as the explanatory variable, we examine whether corporate reputation plays a mediating role in social performance. The coefficient of \(\textit{Digital}\) is 0.010, and that of corporate reputation is 0.003, with both achieving statistical significance at the 1% level. The total effect of 1.227 was decomposed into a direct component of 0.048 and an indirect component of 1.179, corresponding to a mediation proportion of 96.09%. These results further validate H3 robustness.
Third, we use governance performance as the explanatory variable to test whether agency costs function as a mediating mechanism. The coefficient of \(\textit{Digital}\) was 0.017 and significantly positive at the 5% level, whereas the coefficient of agency costs was \(-\)0.002 and significantly negative at the 1% level. The direct effect value was 0.00009, the indirect was 0.022, and the total was 0.02209. The mediating effect accounts for nearly 100% of the total effect, further validating H4 robustness.
| Variable | \(\textit{E}\_\textit{score}\) | \(\textit{Patent}\) | \(\textit{E}\_\textit{score}\) |
| (1) | (2) | (3) | |
| \(\textit{Digital}\) |
0.018\(^{***}\) (10.39) |
0.169\(^{***}\) (12.66) |
0.016\(^{***}\) (8.98) |
| \(\textit{Patent}\) |
0.014\(^{***}\) (9.35) |
||
| Variable | \(\textit{S}\_\textit{score}\) | \(\textit{Fame}\) | \(\textit{S}\_\textit{score}\) |
| (1) | (2) | (3) | |
| \(\textit{Digital}\) |
0.013\(^{***}\) (7.18) |
0.132\(^{***}\) (4.13) |
0.010\(^{***}\) (6.96) |
| \(\textit{Fame}\) |
0.003\(^{***}\) (4.57) |
||
| Variable | \(\textit{G}\_\textit{score}\) | \(\textit{Mfee}\) | \(\textit{G}\_\textit{score}\) |
| (1) | (2) | (3) | |
| \(\textit{Digital}\) |
0.016\(^{**}\) (2.00) |
0.266\(^{*}\) (1.65) |
0.017\(^{**}\) (2.07) |
| \(\textit{Digital}\_\textit{sq}\) |
\(-\)0.001 (\(-\)1.36) |
\(-\)0.033\(^{*}\) (\(-\)1.73) |
\(-\)0.001 (\(-\)1.43) |
| \(\textit{Mfee}\) |
\(-\)0.002\(^{***}\) (\(-\)3.63) |
4.5. Heterogeneity Test
In the heterogeneity analysis, we evaluated each hypothesis by examining whether the coefficient of \(\textit{Digital}\) was larger in the subgroup predicted by the hypothesis, rather than relying solely on whether the coefficients were statistically significant within each subgroup.
(1) Enterprise Ownership
Based on a regression analysis examining how digital transformation affects ESG performance within a subsample of non-state-owned enterprises, we obtained a coefficient of 0.016. For state-owned enterprises, the regression coefficient was 0.012. The regression coefficients of state-owned enterprises are slightly lower than those of non-state-owned enterprises, although both are significantly positive. Although state-owned enterprises can respond more actively to government policies and undertake social responsibility, their operations have certain limitations. The business goals of state-owned enterprises are diverse, and social responsibility is not their sole objective. Moreover, the voices of institutional investors in state-owned enterprises are relatively limited, which may suppress their innovation vitality. For non-state-owned enterprises, actively undertaking social responsibility can bring many benefits and help alleviate financing constraints and information asymmetry. Therefore, based on the empirical results, H5 is rejected. Regardless of whether enterprises are state-owned enterprises or private enterprises, digitalization exerts a pronounced influence on corporate ESG performance.
(2) Technology and Non-Technology-Based Enterprises
To verify H6, we divide the sample data into technology- and non-technology-based enterprises. Following the classification method used in prior research 23, the pharmaceutical manufacturing, railway, shipping, aerospace, computer communication, other electronic equipment manufacturing, chemical raw materials and chemical products manufacturing, instrument and meter manufacturing, chemical fiber manufacturing, and other transportation equipment manufacturing industries were classified as technology-based enterprises, while enterprises in all other industries were classified as non-technology-based enterprises. As shown in Table 10, the effect of digital transformation varies by firm type: while the coefficient was an insignificant 0.002 for non-technology enterprises, it stands at 0.02 for their technology-based counterparts. On the one hand, technology-based enterprises can master digital technologies more quickly and apply them to the production process of their organizations, and the benefits of digital transformation are also more significant. On the other hand, the insignificant effect observed for non-technology-based enterprises may be consistent with the “pseudo-digitalization” phenomenon discussed in Section 3.1.6, where digital initiatives are introduced but remain superficial or fragmented and thus do not translate into sustained operational improvements and ESG outcomes. Importantly, our heterogeneity results do not directly identify pseudo-digitalization; rather, they offer a plausible interpretation of the observed pattern and warrant further investigation using more direct measures of implementation quality. Overall, the heterogeneity evidence supports H6, indicating that the impact of digital transformation on ESG performance is stronger for technology-based firms than for firms outside this category.
| Variable | \(\textit{ESG}\_\textit{score}\) | \(\textit{ESG}\_\textit{score}\) |
| (1) | (2) | |
| Enterprise ownership | ||
| \(\textit{Digital}\) |
0.016\(^{***}\) (3.88) |
0.012\(^{***}\) (3.14) |
| \(R^2\) | 0.650 | 0.632 |
| Technology | ||
| \(\textit{Digital}\) |
0.002 (0.32) |
0.020\(^{***}\) (5.74) |
| \(R^2\) | 0.608 | 0.643 |
| Carbon emissions | ||
| \(\textit{Digital}\) |
0.016\(^{***}\) (3.93) |
0.008\(^{*}\) (2.13) |
| \(R^2\) | 0.593 | 0.648 |
(3) Carbon Emissions
To verify H7, we first divided the sample data into high- and low-carbon-emission enterprises. We classified enterprises with an average carbon emission rate higher than the average of all sample enterprises as high-carbon-emission enterprises and those with a lower average carbon emission rate as low-carbon-emission enterprises. The estimated coefficients for \(\textit{Digital}\) were 0.016 and 0.008 in the high- and low-carbon-emissions subsamples, respectively, with significance levels of 1% and 10%. This disparity suggests that digital transformation’s ESG-promoting effect is stronger for enterprises with higher carbon emissions. One possible explanation is that high-carbon-emission enterprises usually face greater environmental pressure and possess a larger scope for performance improvement. By facilitating efficient resource use, lowering energy consumption and pollutant emissions, and strengthening environmental governance through intelligent production and real-time monitoring, digital transformation can generate substantial ESG improvements for such enterprises. These results validate H7.
5. Conclusions and Recommendations
5.1. Research Findings
Regarding the current status of digital transformation and overall ESG performance among Chinese enterprises, the differences among enterprises are relatively modest, although the general level still has room for improvement. Considering different factors, environmental performance exhibits a more pronounced dispersion across enterprises, indicating substantial room for improvement in environmental management. Of the three factors, governance performance was stronger overall. Chinese enterprises are entering a new stage of digital transformation. Service models in the digitalization subsectors of enterprises are gradually maturing, and a new digital supply chain ecosystem is gradually taking shape, bringing fresh opportunities for enterprise development.
Research on the relationship between enterprises’ digital transformation and ESG performance: This study found that enterprises’ digital transformation significantly improves ESG performance. First, it raises operational efficiency and alleviates resource and financing pressures, creating more favorable conditions for ESG-related investment and responsible corporate actions. However, the faster circulation of information brought about by digital technologies enables firms to identify and respond more efficiently to external demands. Simultaneously, enhanced transparency makes it easier for the public and stakeholders to exercise oversight, encouraging enterprises to undertake social responsibility.
Mechanistic analysis of the impact of enterprises’ digital transformation on ESG performance: Taking the environmental, social, and governance dimensions as separate dependent variables, this study examined the specific transmission channels through which digital transformation affects ESG performance. The findings suggest that digital transformation stimulates green innovation, thereby strengthening environmental performance, improving corporate reputation and social performance, and lowering agency costs, which contribute to better governance performance. However, during the initial phase of transformation, integration between newly adopted digital technologies and the original production and operating model may remain incomplete, which can increase agency costs. Nevertheless, during this stage, governance performance does not necessarily deteriorate due to an increase in agency costs.
Examining heterogeneity in the digital transformation-ESG nexus: We conducted subgroup regressions by enterprise ownership type, technology-based versus non-technology-based classification, and carbon-emission level. These findings indicate that the impact of digital transformation on ESG outcomes is not contingent on whether the enterprise is state-owned or private. However, the positive effects of digital transformation are more pronounced for technology-based enterprises and enterprises with higher carbon emissions. Enterprises with higher carbon emissions generally face greater pressure and have more room for ESG improvement. For non-technology enterprises, the insignificant effect may be consistent with the “pseudo-digitalization” phenomenon; importantly, we do not directly identify “pseudo-digitalization,” and it is provided only as a plausible interpretation that warrants further investigation using more direct measures of implementation quality.
5.2. Recommendations
Drawing on the findings, the following recommendations are provided to promote high-quality digital transformation within Chinese enterprises and enhance their ESG performance.
5.2.1. Policy Implications for Government
(1) Given that the ESG effect of digital transformation is stronger among high-carbon-emission enterprises, regulators should adopt more targeted environmental governance tools for heavy emitters. This includes tightening emission standards and enforcement, improving the transparency and comparability of environmental disclosures, and encouraging the adoption of digital monitoring technologies. Policy instruments such as green subsidies, tax incentives, and pilot programs can be used to support “digitalization-enabled green upgrading,” especially for investments that measurably reduce energy consumption and pollutant emissions.
(2) The weaker effect observed for non-technology-based enterprises suggests that policy support should focus on improving implementation quality rather than encouraging “investment for its own sake.” Governments can provide practical guidance through standards, diagnostic toolkits, and training programs and can support capability-building projects that integrate technology adoption with organizational redesign. In addition, evaluation mechanisms for subsidy/tax incentive programs should emphasize implementation outcomes to reduce the risk of superficial digital adoption.
(3) Since our mediation evidence highlights the roles of reputation and governance, regulators should improve ESG disclosure rules and third-party assurance mechanisms to strengthen stakeholder oversight. Promoting standardized ESG reporting and digital disclosure platforms can reduce information asymmetry and amplify market discipline.
5.2.2. Managerial Implications for Enterprises
(1) High-Carbon-Emission Enterprises
High-emission enterprises should prioritize the integration of digital technologies into core production processes and environmental management systems, including real-time monitoring, intelligent process optimization, and resource utilization improvement. Such measures can directly address environmental risks and help translate digital investments into measurable ESG improvements, consistent with our heterogeneous evidence for high-emission enterprises.
(2) Non-Technology-Based Enterprises
Non-technology-based enterprises should treat digital transformation as a long-term organizational change rather than a short-term change. They should formulate clear roadmaps with milestones, invest in complementary assets, and establish cross-departmental coordination mechanisms to ensure continuity. These actions can help digital initiatives translate into sustained operational improvements and ultimately, ESG performance.
(3) All Enterprises
Enterprises should use digital technologies to strengthen internal controls and governance and to improve stakeholder communication and transparency. Establishing a continuous evaluation of digital transformation progress and outcomes can help firms adjust their organizational structures and processes in a timely manner, thereby sustaining ESG improvements in the long run.
Acknowledgments
This study was supported by the Zhejiang Provincial Peak Discipline.
- [1] D. Acemoglu and P. Restrepo, “The race between man and machine: Implications of technology for growth, factor shares, and employment,” Am. Econ. Rev., Vol.108, No.6, pp. 1488-1542, 2018. https://doi.org/10.1257/aer.20160696
- [2] D. Schallmo, C. A. Williams, and L. Boardman, “Digital transformation of business models—Best practice, enablers, and roadmap,” Int. J. Innov. Manag., Vol.21, No.8, Article No.1740014, 2017. https://doi.org/10.1142/S136391961740014X
- [3] P. C. Verhoef et al., “Digital transformation: A multidisciplinary reflection and research agenda,” J. Bus. Res., Vol.122, pp. 889-901, 2021. https://doi.org/10.1016/j.jbusres.2019.09.022
- [4] H. Wang, S. Wang, and R. Liu, “Research on enterprise digital maturity model,” Manag. Rev., Vol.33, No.12, pp. 152-162, 2021 (in Chinese). https://doi.org/10.14120/j.cnki.cn11-5057/f.20210210.005
- [5] F. He and H. Liu, “The performance improvement effect of digital transformation enterprises from the digital economy perspective,” Reform, No.4, pp. 137-148, 2019 (in Chinese).
- [6] C. Yuan, T. Xiao, C. Geng, and Y. Sheng, “Digital transformation and division of labor between enterprises: Vertical specialization or vertical integration,” China Ind. Econ., No.9, pp. 137-155, 2021 (in Chinese). 10.19581/j.cnki.ciejournal.2021.09.007
- [7] J. Greene, “Environmental, social, and corporate governance (ESG),” EBSCO, 2021.
- [8] W. Ali, J. G. Frynas, and Z. Mahmood, “Determinants of corporate social responsibility (CSR) disclosure in developed and developing countries: A literature review,” Corp. Soc. Responsib. Environ. Manag., Vol.24, No.4, pp. 273-294, 2017. https://doi.org/10.1002/csr.1410
- [9] S. Wang and J. P. Esperança, “Can digital transformation improve market and ESG performance? Evidence from Chinese SMEs,” J. Clean. Prod., Vol.419, Article No.137980, 2023. https://doi.org/10.1016/j.jclepro.2023.137980
- [10] J. Hu, Y. Han, and Y. Zhong, “How corporate digital transformation affects corporate ESG performance,” Rev. Ind. Econ., No.1, pp. 105-123, 2023 (in Chinese). https://doi.org/10.19313/j.cnki.cn10-1223/f.20221104.001
- [11] M. Wang, Y. Song, H. Yan, and X. Zhang, “Impact of digital transformation on the scope of firm internationalization: The mediating role of dynamic capability,” Foreign Econ. Manag., Vol.44, No.5, pp. 33-47, 2022 (in Chinese). https://doi.org/10.16538/j.cnki.fem.20211212.204
- [12] Y. Peng, H. Chen, and T. Li, “The impact of digital transformation on ESG: A case study of Chinese-listed companies,” Sustainability, Vol.15, No.20, Article No.15072, 2023. https://doi.org/10.3390/su152015072
- [13] S. N. Kaplan and L. Zingales, “Do investment-cash flow sensitivities provide useful measures of financing constraints?,” Q. J. Econ., Vol.112, No.1, pp. 169-215, 1997. https://doi.org/10.1162/003355397555163
- [14] F. Wu, H. Hu, H. Lin, and X. Ren, “Enterprise digital transformation and capital market performance: Empirical evidence from stock liquidity,” J. Manag. World, Vol.37, No.7, pp. 130-144+10, 2021 (in Chinese). https://doi.org/10.19744/j.cnki.11-1235/f.2021.0097
- [15] D. Song, W. Zhu, and H. Ding, “Can firm digitalization promote green technological innovation? An examination based on listed companies in heavy pollution industries,” J. Finance Econ., Vol.48, No.4, pp. 34-48, 2022 (in Chinese). https://doi.org/10.16538/j.cnki.jfe.20211218.304
- [16] A. Goldfarb and C. Tucker, “Digital economics,” J. Econ. Lit., Vol.57, No.1, pp. 3-43, 2019. https://doi.org/10.1257/jel.20171452
- [17] A. McMillan-Capehart, J. R. Aaron, and B. N. Cline, “Investor reactions to diversity reputation signals,” Corp. Reput. Rev., Vol.13, No.3, pp. 184-197, 2010. https://doi.org/10.1057/crr.2010.20
- [18] M. Fenwick and E. P. M. Vermeulen, “Technology and corporate governance: Blockchain, crypto, and artificial intelligence,” Lex Research Topics in Corporate Law & Economics Working Paper No.2018-7, 2018. https://doi.org/10.2139/ssrn.3263222
- [19] S. Liu, J. Yan, S. Zhang, and H. Lin, “Can corporate digital transformation promote input-output efficiency,” J. Manag. World, Vol.37, No.5, pp. 170-190+13, 2021 (in Chinese). https://doi.org/10.19744/j.cnki.11-1235/f.2021.0072
- [20] S. Wang, “A study of the influence of management background characteristics on corporate social responsibility—Empirical evidence from Chinese A-share listed companies,” Account. Res., No.11, pp. 53-60+96, 2016 (in Chinese).
- [21] K. Li, Y. Zhao, and Q. Yang, “A study on the impact of digitization transformation on the environmental performance of heavily polluting enterprises: From the perspective of data capitalization,” Econ. Surv., Vol.41, No.3, pp. 108-120, 2024 (in Chinese). https://doi.org/10.15931/j.cnki.1006-1096.2024.03.007
- [22] K. Guan and R. Zhang, “Corporate reputation and earnings management: Efficient contract theory or rent-seeking theory,” Account. Res., No.1, pp. 59-64, 2019 (in Chinese).
- [23] Y. Zhao, “Research on ZTE’s 2017 stock option incentive plan,” Master’s thesis, Chongqing University, 2019 (in Chinese). https://doi.org/10.27670/d.cnki.gcqdu.2019.000834
This article is published under a Creative Commons Attribution-NoDerivatives 4.0 Internationa License.