
Research Paper:
Asymmetric Multifractal Risks in Green Finance Markets
Xiaoyang Zhuang†

Institute for Quantitative Economics and Statistics, Huaqiao University
No.668 Jimei Avenue, Jimei District, Xiamen 361021, China
†Corresponding author

This study investigates asymmetric multifractal characteristics and nonlinear risk dynamics of different China’s green finance markets. By asymmetric multifractal detrended fluctuation analysis, this paper examines scaling behaviors and informational efficiency across varying time scales. The empirical results confirm significant long-range dependence in all examined indices, exhibiting highly asymmetric multifractality. Further analysis of asymmetric singularity spectrum uncovers distinct risk structures among green indices. An analysis of time-varying feature of multifractality, long-range memory, and market inefficiency reveals distinct scaling asymmetries, which manifest as locally stable multifractality and pronounced regime-switching driven by policies, crises, and market mechanism. By revealing the dynamics, this research provides critical insights for investors and policymakers in developing robust green hedging strategies.
Asymmetric multifractal spectra
1. Introduction
Market efficiency continues to be a hot issue for academics and practitioners, due to its important impact on profitable trading strategies. A body of studies tested different financial market efficiency with mixed results 1,2,3. For instance, Fan et al. find that the carbon market’s inefficiency value is positively correlated with market activity in the short run while negatively in the long run 1. Arshad et al. assess the efficiency of crude oil prices, showing that oil markets are more efficient in the shorter horizon 2. Meanwhile, a wide range of empirical studies confirmed multifractality and long memory in various markets 4,5,6. These stylized facts indicate that prices exhibit identifiable patterns which contradict the core tenets of efficient market hypothesis (EMH). The degree of multifractality is widely used to ranking inefficiency in subsequent studies 7,8,9.
More recently, a number of empirical literature have contended the fluctuations that have asymmetric trends in various financial markets 10,11,12,13,14,15,16,17,18,19,20. The expected asymmetric response to information may lead to asymmetric correlations in price fluctuation. Cao et al. utilize an asymmetric multifractal detrended fluctuation analysis (A-MFDFA) method to distinguish scaling properties of different market trends 10. A key finding is that asymmetries are more pronounced in large fluctuations compared to small ones. Lee et al. further employ an index-based A-MFDFA, arguing that index dynamics provide a more intuitive criterion 15. Considerable attention has been devoted to the asymmetric effect in financial markets.
Unlike traditional markets, green financial markets are profoundly driven by structural policy shifts and distinct investor ESG preferences, making their price dynamics uniquely susceptible to asymmetric shocks. Therefore, the primary goal of this research is to analyze the asymmetric multifractal behaviors and efficiency of China’s green markets. Is there a significant difference in the multifractal characteristics of the uptrend and the downtrend? While existing studies on green financial markets have explored market efficiency, these analysis fail to capture the severe non-linearity and asymmetric memory effect triggered by extreme external shocks (e.g., macroeconomic crises or sudden policy shifts). How does the dynamic evolution of such asymmetric risks unfold under external macroeconomic shocks (e.g., the COVID-19 pandemic and policy shifts), and what are the practical implications for different market participants? The answers will offer vital insights for decision-making framework for capital allocation in green markets.
Therefore, A-MFDFA is adopted to uncover a persistent structural asymmetry in China’s green markets. Asymmetric multifractality and informational efficiency are investigated for a better understanding of complexity of price movements. The time-varying fluctuation characteristics and inter-dependencies are examined, to capture regime-switching behaviors triggered by explicit macroeconomic events, particularly the COVID-19 pandemic. The empirical evidence implies that traditional diversification strategies may fail during crises due to asymmetric herd behavior in green markets.
The rest of the paper proceeds as follows. Section 2 outlines the methodology, followed by the data in Section 3. Section 4 reports the empirical findings. Section 5 is the conclusion.
2. Methodology
In the study, the index-based A-MFDFA is employed to detect and characterize asymmetric multifractal scaling behavior. Given a time series \(x (t)\), \(t=1,2,\dots,N\) with \(N\) denoting the total number of series, the algorithm proceeds as follows.
-
Step 1:
Construct the profile series.
\begin{equation} \label{eq:1} X_{{t}}=\sum_{i=1}^t \left(x (i)-\bar{x}\right),\quad t=1,2,\dots, N, \tag{1} \end{equation}where \(\bar{x}\) is the mean of \(x ({t})\). This step reduces the impact of measurement noise and in the subsequent analysis.
-
Step 2:
Segmentation. The profile series \(X_{t}\) and indexing proxy series \(I_t\) are each divided into non-overlapping segments of length \(s\). Here, \(I_{{t}}\) is an asymmetric criterion series, defined as \(I_{{t}}={I}_{{t}-1}\exp (x_t)\) for \(t=1,2,\dots,N\), and \(I_0=1\). Given that the series length \(N\) is often not an integer multiple of the scale \(s\), the segmentation procedure is constructed from both its beginning and end to avoid data loss at the end. This yields \(2N_s\) for per series (\({N}_{{s}}=\textrm{int}(N/s)\)) segments. The range of \(s\) is conventionally set as \(5\le s\le N/4\).
-
Step 3:
Detrended covariance estimation. Local fluctuation trends for all \(2N_s\) segments of \(X_t\) are obtained via least-squares fits.
\begin{equation} \label{eq:2} F^2 (s,v)=\dfrac{1}{s}\sum_{i=1}^s \left[X_{ (v-1)s+j}-\tilde{X}_v (i)\right]^2, \tag{2} \end{equation}for the forward-pass segment \({v}\) (\({v}=1,2,\dots, N_s\)) and
\begin{equation} \label{eq:3} F^2 (s,v)=\dfrac{1}{s}\sum_{i=1}^s \left[X_{N- (v-N_s)s+j}-\tilde{X}_v (i)\right]^2, \tag{3} \end{equation}for the backward-pass segment \(v\) (\(v=N_s+1,N_s+2,\dots, 2N_s\)). The local trend in segment \(v\) is estimated by an \(m\)-th order fitting polynomial \(\tilde{X}_v (i)\).
-
Step 4:
Asymmetry discrimination. For segment \(v\) of \(I_{{t}}\), the local linear trend \(I_{v,s} (k)=a_{v}+b_{v,s}k\) is fitted where \(k\) (\(k=1,2,\dots,s\)) is the index within the segment. Then, the local trend of segment \(v\) is assessed by the sign of slope \(b_{v,s}\) (\(\textrm{sign} (b_{v,s})\le 0\) for negative trend, \(\textrm{sign} (b_{v,s})>0\) for positive trend).
-
Step 5:
Compute asymmetric \(q\)-order average functions. For \(q\neq 0\), the directional fluctuation functions are constructed by filtering the segments based on the trend indicator \(\textrm{sign} (b_{v,s})\) as follows:
\begin{equation} \label{eq:4} \left\{\begin{aligned} F_q^{+} (s) &= \left\{\dfrac{1}{M^{+}}\sum_{v=1}^{2N_s}\left[1+\textrm{sign}\left (b_{v,s}\right)\right]\left[F^2 (s,v)\right]^{\frac{q}{2}}\right\}^{\frac{1}{q}},\\ F_q^{-} (s) &=\left\{\dfrac{1}{M^{-}}\sum_{v=1}^{2N_s}\left[1-\textrm{sign}\left (b_{v,s}\right)\right]\left[F^2 (s,v)\right]^{\frac{q}{2}}\right\}^{\frac{1}{q}},\\ \end{aligned}\right. \tag{4} \end{equation}where \(M^{+}=\sum_{v=1}^{2N_s} [1+\textrm{sign} (b_{v,s})]/2\) and \(M^{-}=\sum_{v=1}^{2N_s}[1-\textrm{sign} (b_{v,s})]/2\). Note that \(M^{+}+M^{-}=2N_s\) if \(b_{v,s}\ne 0\) for all segments. The overall fluctuation function of standard MF-DFA is simply the average across all segments
\begin{equation} \label{eq:5} \left\{\begin{aligned} F_q (s) &=\left\{\dfrac{1}{2N_s}\sum_{v=1}^{2N_s}\left[F^2 (s,v)\right]^{\frac{q}{2}}\right\}^{\frac{1}{q}}, & q\ne 0,\\ F_0 (s) &=\exp\left\{\dfrac{1}{4N_s}\sum_{v=1}^{2N_s}\ln \left[F^2 (s,v)\right]\right\}, & q=0.\\ \end{aligned}\right. \tag{5} \end{equation} -
Step 6:
Estimate the asymmetric generalized Hurst exponents. The exponents are derived by quantifying the power-law relationship of \(F_q^{\pm} (s)\) on \(s\), as the scaling behavior of fluctuation functions for different order \(q\),
\begin{equation} \label{eq:6} F_q^{+} (s)\propto s^{H^{+} (q)},\, F_q^{-} (s)\propto s^{H^{-} (q)},\, F_q (s)\propto s^{H (q)}. \tag{6} \end{equation}The order \(q\) weights different fluctuations magnitudes. The corresponding scaling exponents are denoted as overall \(H (q)\), upward \(H^{+} (q)\), and downward \(H^{-} (q)\), describing the long-memory of auto-correlations. Multifractality in auto-correlation of overall scaling behavior is indicated if \(H (q)\) is dependent on \(q\). This interpretation holds equally for \(H^{+} (q)\) and \(H^{-} (q)\).
The traditional Renyi exponent \(\tau (q)\) in terms of the generalized Hurst exponent \(H (q)\) is assessed through the following relationship:
\begin{equation} \label{eq:7} \tau (q)=qH (q)-1. \tag{7} \end{equation}Then by Legendre transform, multifractal spectrum is calculated:
\begin{equation} \label{eq:8} \left\{\begin{aligned} \alpha (q) &=H (q)+qH' (q),\\ f (\alpha) &=q\bigl (\alpha (q)-H (q)\bigr)+1.\\ \end{aligned}\right. \tag{8} \end{equation}In the asymmetric cases of the multifractal singularity spectra, \(f^{+} (\alpha)\) and \(f^{-} (\alpha)\) are derived by replacing \(H (q)\) with asymmetric exponents \(H^{+} (q)\) and \(H^{-} (q)\). Holder exponent, \(\alpha (q)\) (or singularity strength) characterized the singularity of the time series. Its distribution is given by the multifractal spectrum \(f (\alpha)\) that gives the fractal dimension of all points possessing a given \(\alpha\).
3. Data
In this study, eight indices of China’s green finance market are selected, including CSI New Energy Index (NEI), CSI 300 Green Leading Stock Index (GLI), CSI Green Investing Index (GII), SSE 50 ESG Benchmark Index (ESG), SZSE Green Low-Carbon Index (LCI), CNI Green Electricity Index (GEI), CNI Green Coal Index (GCI) and CSI 300 Carbon Neutrality Index (CNI). The data samples range from July 1, 2017 to December 15, 2025, and the original sample data were obtained from the websites of China Securities Index (CSI and CNI Index). The empirical analysis is conducted using log return series calculated as first difference of natural logarithm of daily price.
These sub-markets represent a key component of China’s green financial system, providing a comprehensive view of mechanisms underpinning energy transition and green development. For instance, NEI focuses heavily on high-growth emerging sectors such as lithium batteries and photovoltaics, making it highly sensitive to technological innovations and market speculation. GCI emphasizes the green transformation and clean utilization efforts of traditional heavy-emitting coal enterprises. GEI tracks companies engaged in renewable power generation (hydro, wind, and solar), while ESG and GLI comprise large-cap, blue-chip stocks with high environmental and governance ratings across broader industries.
Table 1 reports the descriptive statistics of the daily returns. The values of skewness and kurtosis show clear deviations from 0 to 3, indicating leptokurtic distributions for all indices are (excess kurtosis is more than 3) with left-skewed. All Jarque-Bera statistics are significant at 1% level, indicating non-normality distribution in all green index return series. This finding indicates the potential presence of complex nonlinear dynamics and fat-tailed distributions in green markets, which provides a rational statistical premise for employing A-MFDFA to capture their underlying complexity.
| Mean | Std | Skew | Kurt | JB-test | |
| NEI | 0.0032 | 0.2487 | \(-\)0.0167 | 3.6771 | 1154.34 |
| GLI | 0.0012 | 0.1662 | \(-\)0.1540 | 5.8735 | 2954.83 |
| GII | 0.0012 | 0.2113 | \(-\)0.3399 | 4.6039 | 1849.65 |
| ESG | 0.0016 | 0.1714 | \(-\)0.2167 | 4.9947 | 2146.61 |
| LCI | 0.0040 | 0.2153 | \(-\)0.1489 | 3.4284 | 1010.90 |
| GEI | \(-\)0.0002 | 0.1516 | \(-\)0.1424 | 5.3018 | 2407.63 |
| GCI | 0.0013 | 0.2283 | \(-\)0.2010 | 2.1388 | 403.93 |
| CNI | 0.0019 | 0.1751 | \(-\)0.2234 | 5.0875 | 2227.59 |
4. Analysis of Empirical Results
4.1. Asymmetric and Multifractal Properties
Figure 1 illustrates A-MFDFA fluctuation functions \(F_q (s)\) versus \(s\) on logarithmic scale when \(q=2\). The fluctuation functions \(F_2 (s)\) curves of upward and downward trends show similar trajectories at multiple frequencies with the overall trend. The pronounced power-law auto-correlations can be observed in the fluctuations under bull and bear markets (upward and downward trends). This finding provides compelling evidence that the relevant indices exhibit prominent multifractality, which indicates that the statistical structure underlying fluctuations exhibits self-similarity across disparate time scales.
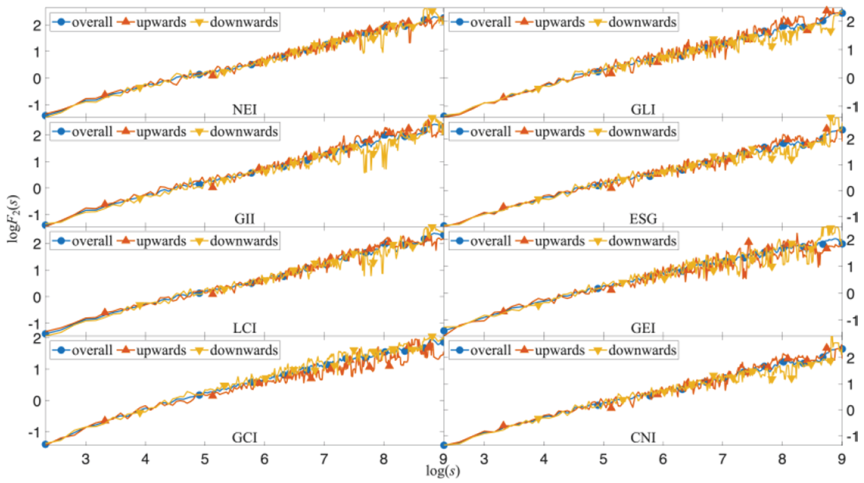
Fig. 1. Power-law dependence of the asymmetric MF-DFA functions \(F_q (s)\) in log-log plot with respect to the scale \(s\) for \(q=2\).
Figure 2 shows the fluctuation function asymmetry \(D_f=\log _2 F_2^{+} (s)-\log_2 F_2^{-} (s)\). If \(D_f=0\), then the symmetric multifractality is observed. Otherwise, the fluctuations behave differently in market upturns and downturns. As shown in Fig. 2, asymmetric multifractality exist in all the indices. The downtrend in GCI shows higher auto-correlations when \(s\) tilts towards larger time scales, whereas the others show high-correlation in uptrend. ESG and GEI exhibit substantial dispersion, indicating highly asymmetric information efficiency and drastic changes under extreme market conditions. The asymmetric MF-DFA is an effective way for detecting long-range correlations and the asymmetry in upward and downward movements.
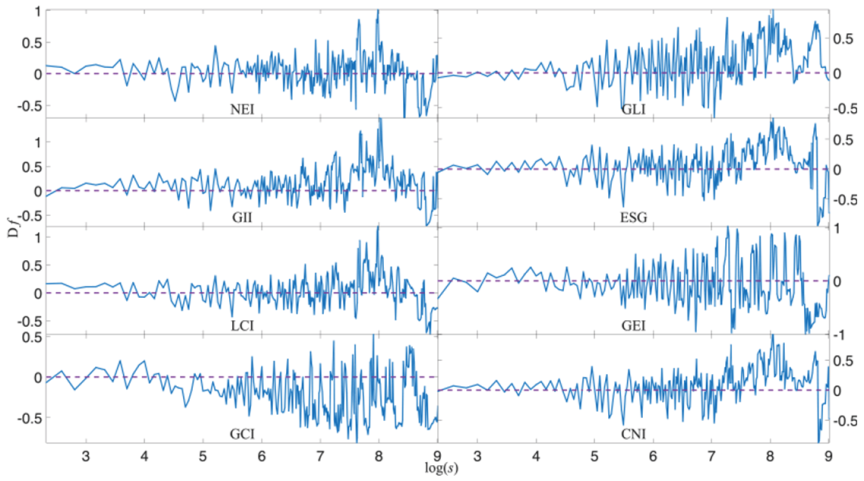
Fig. 2. Asymmetry degree of fluctuation function \(D_f\).
The generalized Hurst exponents of three trends \(H (q)\), \(H^{+} (q)\), and \(H^{-} (q)\) are presented in Fig. 3 for \(q\in [-10,10]\). For \({q}>0\), \({H} ({q})\), \({H}^{+} ({q})\), and \({H}^{-} ({q})\) quantify the large fluctuations of scaling behavior of three trends, respectively. By contrast, for \({q}<0\), \({H}^{\pm} ({q})\) captures the small fluctuations of scaling behavior. The decreasing curves of all the \({H}^{\pm} ({q})\) imply that the scaling of small fluctuations is more persistent than that of large fluctuations (positive \(q\)) across all indices, which reflects a highly resilient market microstructure. This indicates that the market exhibits rapid mean-reverting (anti-persistent) behaviors when faced with extreme shocks. And during the small fluctuations, uptrends show higher persistence in NEI, GLI, GII, and GEI tends to be random for large fluctuations. The small fluctuations of the other four indices exhibit greater persistence in downtrends. The results suggest the more persistent of market inefficiency, and multifractality with smaller average fluctuations at upward periods.
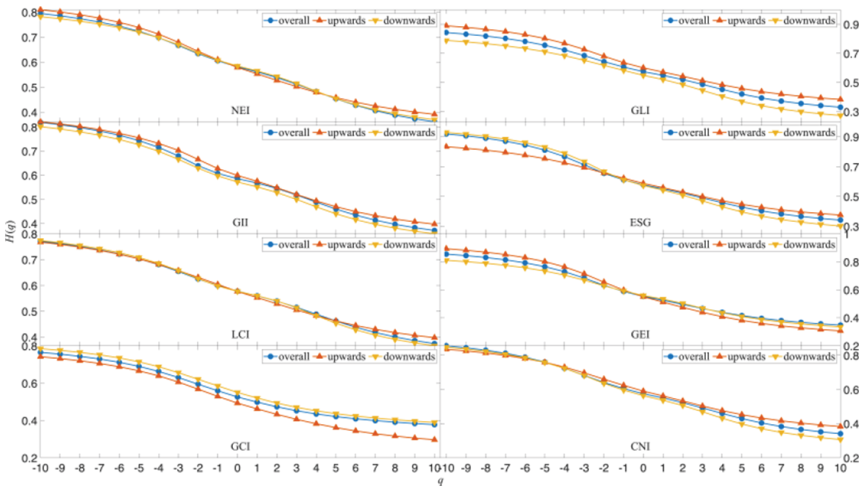
Fig. 3. \(H (q)\), \(H^{+} (q)\), and \(H^{-} (q)\) versus \(q\).
The degrees of asymmetric scaling behavior \(\Delta H^{\pm} (q)=H^{+} (q)-H^{-} (q)\) are illustrated in Fig. 4. Obviously scaling behavior is symmetric if \(\Delta H^{\pm} (q)=0\). The uptrends generate higher auto-correlation if \(\Delta H^{\pm} (q)>0\), and vice versa. Specifically, GII and GLI exhibit more pronounced auto-correlations during upward trends, which is consistent with the characteristics of trend-chasing behaviors and the potential expansion of the green premium often discussed in recent literature. Conversely, GCI demonstrates stronger memory during downward trends, underscoring its unique microstructural resilience as a traditional coal-transition index when facing pessimistic shocks. Interestingly, LCI displays the least asymmetry among the investigated markets, implying a relatively balanced sensitivity to both positive and negative news.
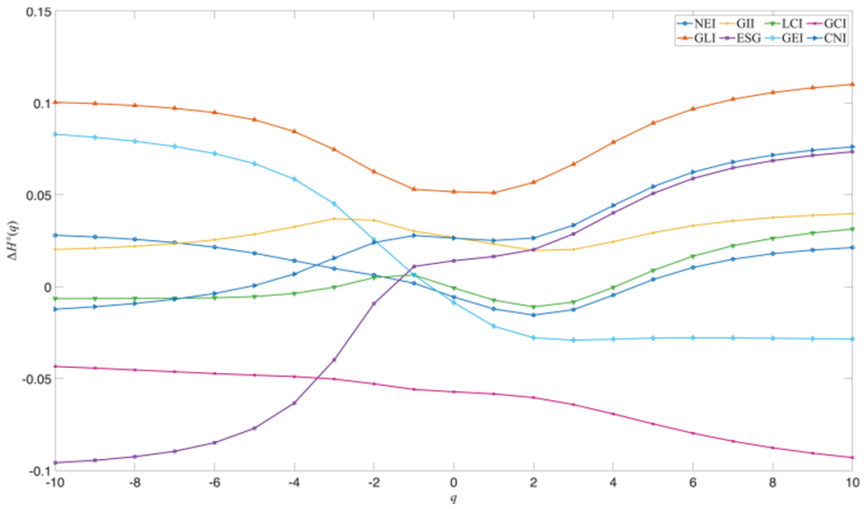
Fig. 4. Asymmetry degree \(\Delta {H}^{\pm} (q)\) versus \(q\).
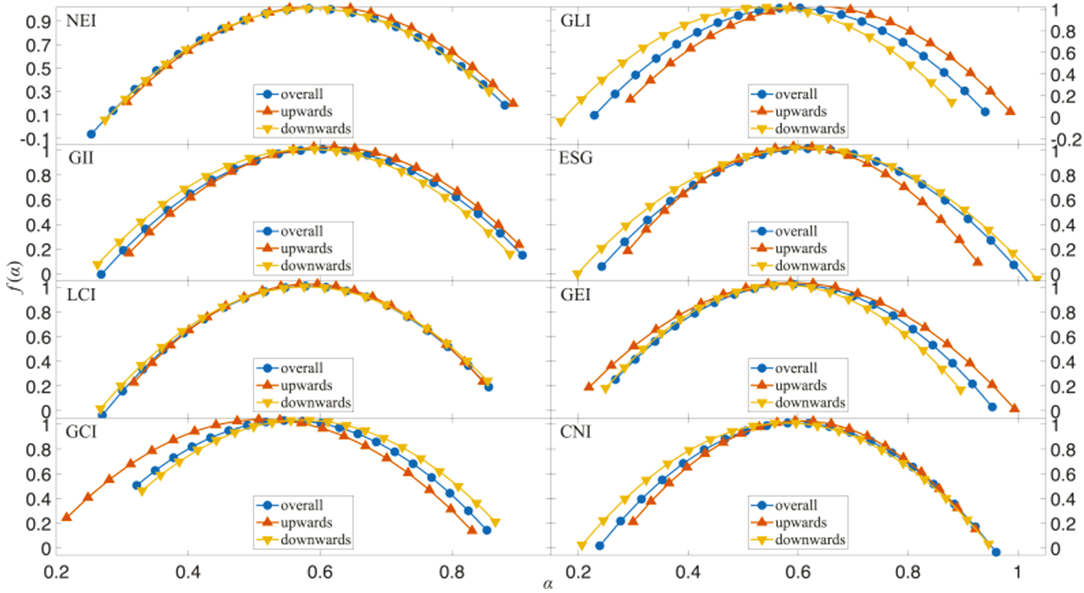
Figure 5 illustrates the multifractal spectrum of three trends \(f (\alpha)\), \(f^{+} (\alpha)\), and \(f^{-} (\alpha)\) versus Hölder exponent \(\alpha\). As known, \(f (\alpha)\) denotes the subset’s fractal dimension of the series with a given \(\alpha\), providing the information on the complexity of the time series. The spectrum of monofractal series converges to \((H (2),1)\). For all the indices, the curves present inverse parabolic shapes. This further validates the previous results regarding asymmetric multifractality. Not surprisingly, the spectra exhibit considerable breadth, and vary significantly depending on the market trend (upward or downward). The generally wider spectra observed during downward trends provide robust empirical evidence for the leverage effect. The panic selling and liquidity dry-ups during bear markets severely disrupt market efficiency, easily overriding the environmental faith that supports these green assets during bull markets.
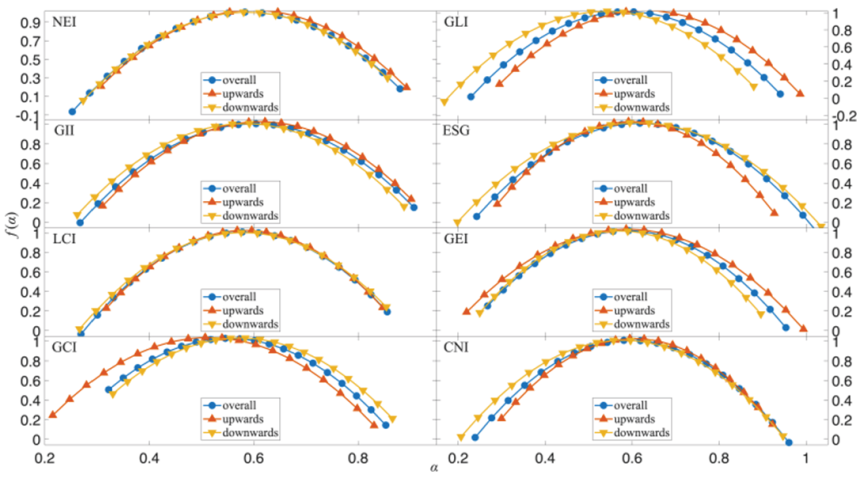
Fig. 5. \(f (\alpha)\), \(f^{+} (\alpha)\), and \(f^{-} (\alpha)\) versus \(\alpha\).
We also conduct quantitative analysis to accurately describe the strength of asymmetric multifractality, which is presented in Table 2. The multifractality degree \(\Delta H\), \(\Delta H^{+}\), \(\Delta H^{-}\) (\(=H_{\max} (q)-H_{\min} (q)\)), singularity strength width \(\Delta\alpha\), \(\Delta\alpha^{+}\), \(\Delta\alpha^{-}\) (\(=\alpha_{\max}-\alpha_{\min}\)), and width of spectrum \(\Delta f\), \(\Delta f^{+}\), \(\Delta f^{-}\) (\(=f (\alpha_{\min})-f (\alpha_{\max}))\) are calculated. The multifractality degree \(\Delta H\) can offer details of how the sequence fluctuates under different amplitude of the fluctuation. The singularity strength width \(\Delta\alpha\) (\(\Delta\alpha=\alpha_{\max}-\alpha_{\min})\) reveals uneven distribution of the local fluctuations and is widely used as an indicator to measure the complexity and risks of the series. \(\Delta f\) gives an additional information on fluctuation direction. The smaller value, the lower heterogeneity of the market and lower market risk.
| \(\mathrm{\mathbf{NEI}}\) | \(\mathrm{\mathbf{GLI}}\) | \(\mathrm{\mathbf{GII}}\) | \(\mathrm{\mathbf{ESG}}\) | \(\mathrm{\mathbf{LCI}}\) | \(\mathrm{\mathbf{GEI}}\) | \(\mathrm{\mathbf{GCI}}\) | \(\mathrm{\mathbf{CNI}}\) | |
| \(\Delta H\) | 0.4336 | 0.5130 | 0.4481 | 0.5771 | 0.3965 | 0.5073 | 0.3876 | 0.5151 |
| \(\Delta H^{+}\) | 0.419 | 0.5059 | 0.4245 | 0.4575 | 0.3699 | 0.5868 | 0.4448 | 0.4524 |
| \(\Delta H^{-}\) | 0.4123 | 0.5157 | 0.444 | 0.6268 | 0.4079 | 0.4754 | 0.3953 | 0.5408 |
| \(\Delta\alpha\) | 0.6273 | 0.7112 | 0.639 | 0.7917 | 0.5863 | 0.6861 | 0.5309 | 0.7216 |
| \(\Delta\alpha^{+}\) | 0.5853 | 0.6913 | 0.5915 | 0.637 | 0.5295 | 0.7746 | 0.6149 | 0.6230 |
| \(\Delta\alpha^{-}\) | 0.5825 | 0.7114 | 0.6256 | 0.8364 | 0.5871 | 0.6462 | 0.5358 | 0.7403 |
| \(\Delta f\) | \(-\)0.2311 | \(-\)0.032 | \(-\)0.1531 | 0.1643 | \(-\)0.2082 | 0.1825 | 0.3221 | 0.0284 |
| \(\Delta f^{+}\) | \(-\)0.0125 | 0.0818 | \(-\)0.0647 | 0.0813 | \(-\)0.0121 | 0.1332 | 0.0818 | 0.0398 |
| \(\Delta f^{-}\) | \(-\)0.2148 | \(-\)0.1476 | \(-\)0.0786 | 0.0197 | \(-\)0.1987 | 0.002 | 0.2129 | \(-\)0.0046 |
From Table 2, all indices exhibit significant asymmetry, yet their underlying economic drivers vary markedly. ESG demonstrates the strongest multifractality especially under the downtrends, implying that panic selling easily triggers a severe leverage effect that profoundly disrupts information transmission. In contrast, GCI and LCI show lower values, reflecting weaker multifractal strength. As a traditional coal-transition index, GCI is heavily supported by steady, long-term institutional allocations, resulting in smoother market operations.
The divergence in scaling behaviors further corroborates the asymmetric information economics of green policies. While the majority of indices exhibit wider spectra (\(\Delta\alpha\)) and stronger complexity during downtrends (fear effect), NEI, GEI, and CNI display the opposite pattern (\(\Delta H^{+}>\Delta H^{-}\)). This upward-sensitive complexity is primarily driven by asymmetric policy transmission: sudden positive directives (e.g., dual-carbon goals) induce heavy speculative capital inflows and irrational exuberance, creating localized inefficiencies during bull markets.
The downtrends’ singularity strength width \(\Delta\alpha^{-}\) is larger than uptrends except NEI, GEI, and CNI. \(\Delta\alpha\) of ESG are largest in the overall trend and downtrend. GEI presents the broadest spectrum, followed by GLI and ESG in the uptrends, indicating highly complex behaviors in the bull market.
Furthermore, the tail-risk properties are further quantified by \({\Delta} f\). Indices with positive \(\Delta f\) (e.g., ESG, CNI) maintain microstructural continuity driven by high-frequency, minor fluctuations. Conversely, the negative \(\Delta f\) in NEI and LCI exposes a deep vulnerability to systemic structural breaks. Under downward macro-shocks, these large-fluctuation-driven markets are prone to cross-scale volatility spillovers, underscoring the urgent need for tail-risk calibrated portfolio management.
4.2. Dynamic Asymmetric Analysis
Based on the distinct fluctuations dynamics, market deficiency measure (MDM) can be quantified as:
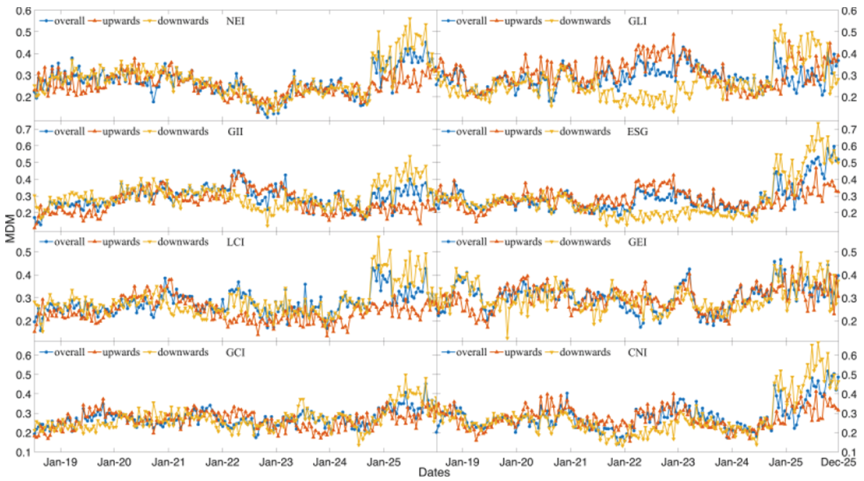
Fig. 6. Plots of asymmetric evolution of MDM with a 250-day rolling window of 10-day step size.
Figure 6 depict the evolution of MDM the three trends under the window length 250 (approximately a year). The slide step is 10 days (two weeks) for a clear trend. As shown in Fig. 6, all the indices are inefficient regardless of the trends as the multifractality degree MDM of three trends deviates from 0. The substantial fluctuations observed in the MDM across different sub-periods underscore the sensitivity of green indices to macroeconomic policy cycles. The distinct spikes in market inefficiency do not occur randomly. In the period of 2020, most MDM showed significant volatility. This may be attributed to the effect of COVID-19 and the global US dollar liquidity crisis in March 2020, which disrupted global supply chains and induced extreme uncertainty triggered by herd behavior in the markets. Distinct increases are observed in MDM of uptrend larger than downtrend in GLI, LCI, and CNI. MDM of three trends follow similar trajectories till mid-2021. This may be driven by the official introduction of China’s Dual-Carbon goals in September 2020. This major domestic policy milestone injected massive speculative capital into the green sectors, particularly new energy, abruptly transitioning the market from panic-driven inefficiency to sentiment-driven speculative bubbles. Subsequently, the uptrend surged distinctly. In 2025, MDM of three trends increases especially in the downtrends. The distinct increase in MDM suggests a temporary deterioration in informational efficiency during this period, potentially pointing to emerging structural imbalances or heightened market uncertainty, which warrants further investigation.
The dynamic Hurst index (\(H (2)\)) is present in Fig. 7. From Fig. 7, it can be found that the Hurst index of the majority indices is larger than 0.5, implying a significant long memory during bear markets. These asymmetric fluctuations indicate that bearish trends have stronger impact on investor behavior than bullish ones. The dynamic evolution of the Hurst exponent reveals a stark regime-switching mechanism triggered by the 2020 COVID-19 pandemic. During the 2020 pandemic crunch, the downward Hurst exponent sharply deviated from the baseline, indicating a severe loss of market efficiency. This statistical anomaly captures the profound panic and herd behavior among green investors, demonstrating that green assets are not immune to systemic macroeconomic shocks but instead experience acute, short-term anti-persistent downward trends. Moreover, all indices experienced extreme polarization in early 2025, the upward Hurst index soared above 0.7, while the downward Hurst index fell to a low near 0.3. This extreme divergence suggests that green markets may have undergone a dramatic unilateral trend switch or structural collapse, with the upward trend exhibiting very strong inertia, while the downward process showed a strong willingness for mean reversion. This similar asymmetric divergence shows a convergent response mechanism in the face of macro systemic risks or significant trend reversals.
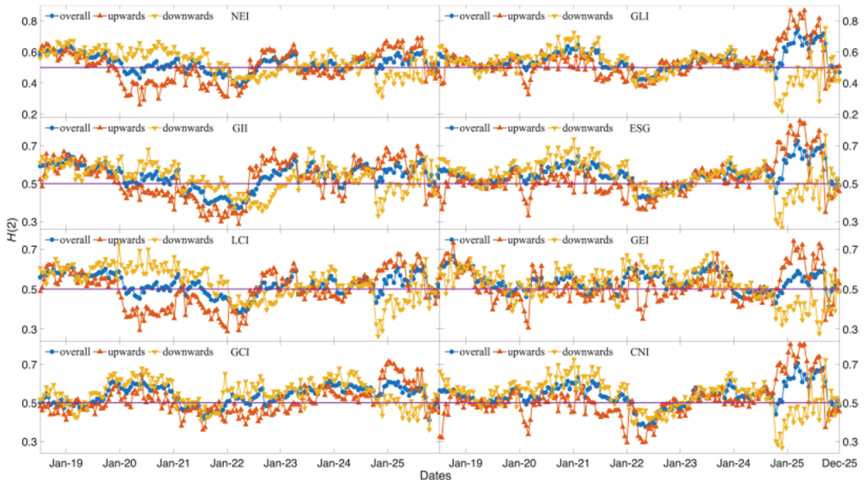
Fig. 7. Asymmetric evolution of Hurst index \(H (2)\) with a 250-day rolling window of 10-day step size.
The significant divergence of multifractality degree \(\Delta H\) between the upwards and downwards in Fig. 8 reveals that asymmetry is a key risk factor. Also, severe fluctuations around the year 2020 are observed. Specifically, the subsequent structural breaks and enhanced multifractality are observed in late 2020. And during several small-scale fluctuations before 2025, and the yellow curve (\(\Delta H^{-}\)) is often higher than the orange curve (\(\Delta H^{+}\)). All indices experienced a dramatic surge at the year of 2025, and \(\Delta H\) rapidly broke through the threshold of 1.0, with some indices even reaching above 1.2, marking the market’s entry into an extremely nonlinear state and a period of structural imbalance. Particularly in the NEI and GLI indices, the surge in downward is especially pronounced, signaling that the market faces immense downward pressure during this phase, and this impact possesses a strong multiscale coupling effect, rendering traditional linear hedging strategies potentially ineffective. This asymmetry can be attributed to the leverage effect and the fragility of the green premium. When adverse shocks—such as policy rollbacks or the pandemic—hit the market, investors’ rapid liquidation of green assets generates wider multifractal spectra than during bullish phases, highlighting a fundamental vulnerability in the liquidity of green investments.
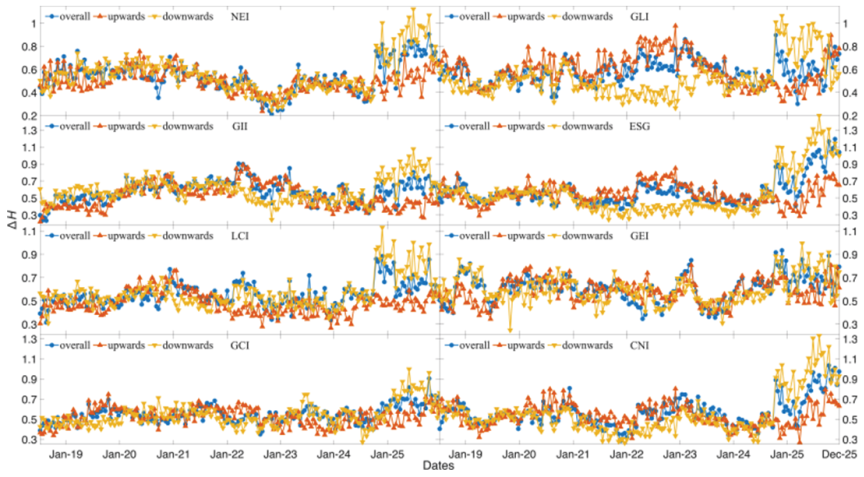
Fig. 8. Asymmetric evolution of \(\Delta H\) with a 250-day rolling window of 10-day step size.
5. Conclusion
This paper investigates asymmetric multifractality and efficiency of China’s green stock index using A-MFDFA method, offering a novel perspective for assessing complex price fluctuations and risk environments.
First, green assets that exhibit pronounced structural asymmetries across different market trends are identified. From a behavioral perspective, green assets are heavily influenced by investors’ green preferences. During bullish phases, optimistic sentiment and trend-chasing behaviors generate a green premium. However, during bearish phases or severe market downturns, the leverage effect dominates. The psychological fragility of this green premium means that panic selling and liquidity demands quickly override environmental faith, leading to more violent, anti-persistent fluctuations (wider multifractal spectra) during downtrends than uptrends. Indices such as ESG and CNI demonstrate a profound bear-market sensitivity, where panic selling and negative news induce significantly higher market complexity and inefficiency compared to positive news. Conversely, the upward-sensitive behavior of the GEI indicates the presence of trend-chasing behaviors and green speculative premia.
Second, the spectral asymmetry highlights heterogeneous risk preferences underlying the indices. Green financial markets are intrinsically policy-driven, heavily relying on top-down directives like carbon-neutrality goals or subsidy adjustments. According to information economics, the transmission of such policy signals is inherently asymmetric. Positive policy support is often anticipated and gradually priced in, whereas negative shocks (e.g., abrupt subsidy cuts or global macroeconomic crises) are unanticipated and cause instantaneous, severe market re-evaluations, contributing to structural asymmetry. Left-skewed markets (NEI, LCI) are fundamentally driven by extreme tail events, rendering them fragile to sudden shocks, whereas right-skewed markets (GCI, GEI) are governed by continuous, minor trading frictions, thereby retaining higher microstructural resilience.
Finally, dynamic rolling-window analysis reveals that these asymmetric risks undergo profound regime-switching triggered by external macro-shocks (e.g., policies and crises). From the perspective of market microstructure, certain segments of the green economy (e.g., emerging renewable energy technologies) may face liquidity constraints compared to mature traditional sectors. Furthermore, green assets possess complex linkages with traditional fossil fuel markets. When exogenous shocks occur, capital flights and cross-market volatility spillovers exacerbate the microstructural fragility of green indices, resulting in significant asymmetric tail risks and regime-switching behaviors. Consequently, policymakers must establish multifractal-based early-warning systems to mitigate systemic risks. For investors, while the GCI offers a relatively efficient harbor for conservative allocation, portfolios involving ESG, GEI, and CNI must rigorously account for asymmetric long-range dependence and cross-scale volatility spillovers.
Acknowledgments
The work is supported by Fujian Province Innovation Strategy Research Project (Grant number 2024R0045) and Fujian Provincial Social Science Foundation (No.FJ2024B202).
- [1] X. Fan, X. Lv, J. Yin et al., “Multifractality and market efficiency of carbon emission trading market: Analysis using the multifractal detrended fluctuation technique,” Applied Energy, Vol.251, Article No.113333, 2019. https://doi.org/10.1016/j.apenergy.2019.113333
- [2] S. Arshad, S. A. R. Rizvi, O. Haroon et al., “Are oil prices efficient?,” Economic Modelling, Vol.96, pp. 362-370, 2021. https://doi.org/10.1016/j.econmod.2020.03.018
- [3] J. Alvarez-Ramirez, M. Cisneros, C. Ibarra-Valdez et al., “Multifractal Hurst analysis of crude oil prices,” Physica A: Statistical Mechanics and its Applications, Vol.313, Nos.3-4, pp. 651-670, 2002. https://doi.org/10.1016/S0378-4371(02)00985-8
- [4] X. Zhuang, Y. Wei, and F. Ma, “Multifractality, efficiency analysis of Chinese stock market and its cross-correlation with WTI crude oil price,” Physica A: Statistical Mechanics and its Applications, Vol.430, pp. 101-113, 2015. https://doi.org/10.1016/j.physa.2015.02.085
- [5] A. K. Tiwari, S. Kumar, R. Pathak et al., “Testing the oil price efficiency using various measures of long-range dependence,” Energy Economics, Vol.84, Article No.104547, 2019. https://doi.org/10.1016/j.eneco.2019.104547
- [6] L. H. S. Fernandes, F. H. A. de Araújo, and I. E. M. Silva, “The (in)efficiency of NYMEX energy futures: A multifractal analysis,” Physica A: Statistical Mechanics and its Applications, Vol.556, Article No.124783, 2020. https://doi.org/10.1016/j.physa.2020.124783
- [7] W. Mensi, A. K. Tiwari, and K. H. Al-Yahyaee, “An analysis of the weak form efficiency, multifractality and long memory of global, regional and European stock markets,” The Quarterly Review of Economics and Finance, Vol.72, pp. 168-177, 2019. https://doi.org/10.1016/j.qref.2018.12.001
- [8] S. Ali, S. J. H. Shahzad, N. Raza et al., “Stock market efficiency: A comparative analysis of Islamic and conventional stock markets,” Physica A: Statistical Mechanics and its Applications, Vol.503, pp. 139-153, 2018. https://doi.org/10.1016/j.physa.2018.02.169
- [9] K. H. Al-Yahyaee, W. Mensi, and S.-M. Yoon, “Efficiency, multifractality, and the long-memory property of the Bitcoin market: A comparative analysis with stock, currency, and gold markets,” Finance Research Letters, Vol.27, pp. 228-234, 2018. https://doi.org/10.1016/j.frl.2018.03.017
- [10] G. Cao, J. Cao, and L. Xu, “Asymmetric multifractal scaling behavior in the Chinese stock market: Based on asymmetric MF-DFA,” Physica A: Statistical Mechanics and its Applications, Vol.392, No.4, pp. 797-807, 2013. https://doi.org/10.1016/j.physa.2012.10.042
- [11] A. Khurshid, K. Khan, J. Cifuentes-Faura et al., “Asymmetric multifractality: Comparative efficiency analysis of global technological and renewable energy prices using MFDFA and A-MFDFA approaches,” Energy, Vol.289, Article No.130106, 2024. https://doi.org/10.1016/j.energy.2023.130106
- [12] G. Cao and L. Zhou, “Asymmetric risk transmission effect of cross-listing stocks between mainland and Hong Kong stock markets based on MF-DCCA method,” Physica A: Statistical Mechanics and its Applications, Vol.526, Article No.120741, 2019. https://doi.org/10.1016/j.physa.2019.03.106
- [13] M. A. F. Chowdhury, M. Abdullah, M. Alam et al., “NFTs, DeFi, and other assets efficiency and volatility dynamics: An asymmetric multifractality analysis,” Int. Review of Financial Analysis, Vol.87, Article No.102642, 2023. https://doi.org/10.1016/j.irfa.2023.102642
- [14] M. Lee, J. W. Song, J. H. Park et al., “Asymmetric multi-fractality in the U.S. stock indices using index-based model of A-MFDFA,” Chaos, Solitons & Fractals, Vol.97, pp. 28-38, 2017. https://doi.org/10.1016/j.chaos.2017.02.001
- [15] M. Lee, J.-W. Song, J.-H. Park, and W. Chang, “Asymmetric multi-fractality in the U.S. stock indices using index-based model of A-MFDFA,” Chaos, Solitons & Fractals, Vol.97, pp. 28-38, 2017. https://doi.org/10.1016/j.chaos.2017.02.001
- [16] X. Zhuang and D. Wei, “Asymmetric multifractality, comparative efficiency analysis of green finance markets: A dynamic study by index-based model,” Physica A: Statistical Mechanics and its Applications, Vol.604, Article No.127949, 2022. https://doi.org/10.1016/j.physa.2022.127949
- [17] K. Khan, C.-W. Su, A. Khurshid et al., “COVID-19 impact on multifractality of energy prices: Asymmetric multifractality analysis,” Energy, Vol.256, Article No.124607, 2022. https://doi.org/10.1016/j.energy.2022.124607
- [18] W. Mensi, A. Sensoy, X. V. Vo et al., “Pricing efficiency and asymmetric multifractality of major asset classes before and during COVID-19 crisis,” The North American J. of Economics and Finance, Vol.62, Article No.101773, 2022. https://doi.org/10.1016/j.najef.2022.101773
- [19] T. Takaishi, “Time-varying properties of asymmetric volatility and multifractality in Bitcoin,” PLOS ONE, Vol.16, No.2, Article No.e0246209, 2021. https://doi.org/10.1371/journal.pone.0246209
- [20] P. Cho and M. Lee, “Forecasting the Volatility of the Stock Index with Deep Learning Using Asymmetric Hurst Exponents,” Fractal and Fractional, Vol.6, No.7, Article No.394, 2022. https://doi.org/10.3390/fractalfract6070394
This article is published under a Creative Commons Attribution-NoDerivatives 4.0 Internationa License.