
Research Paper:
Evaluation of Visuospatial Ability in Elderly Adults Using Eye Tracking and Virtual Reality Content
Fumiya Kinoshita*,†
 , Kansuke Kawaguchi**, and Tomiko Takeuchi**
*Graduate School of Engineering, Mie University
1577 Kurimamachiya-cho, Tsu, Mie 514-8507, Japan
†Corresponding author
**Faculty of Nursing, Toyama Prefectural University
2-2-78 Nishi-nagaeda, Toyama, Toyama 930-0975, Japan

Early detection of mild cognitive impairment (MCI) is essential for preventing progression to dementia. Conventional neuropsychological tests, such as cube copying and clock drawing, are widely used to assess visuospatial and executive functions; however, these assessments rely largely on qualitative observation by clinicians, which may limit their objectivity. Therefore, a quantitative method for objectively evaluating visuospatial function is desirable. This study develops and validates a virtual reality (VR)-based assessment using eye-tracking that enables objective differentiation between healthy elderly adults and individuals suspected of having MCI. VR content presenting periodic depth stimuli was developed, and gaze behavior was recorded using a head-mounted display equipped with an eye-tracking system. Changes in interpupillary distance induced by depth perception were analyzed to derive quantitative indices, including the coefficient of determination (R2) obtained using sinusoidal fitting and spectral power in the frequency domain. Experiments were conducted with elderly participants consisting of a healthy group and individuals suspected of having MCI, as determined based on the Japanese version of the Montreal Cognitive Assessment. Significant differences were observed between the groups (p=0.026), and linear discriminant analysis achieved accurate classification, with no misclassification in the healthy group and two misclassifications in the suspected MCI group. These findings indicate that the proposed method enables objective and quantitative evaluation of visuospatial function and may contribute to the early detection and screening of MCI.
VR-based classification of healthy and MCI-suspected groups
1. Introduction
The early detection of mild cognitive impairment (MCI), which is an intermediate state between healthy cognition and dementia, is important for delaying cognitive decline. MCI is a concept proposed by Petersen and colleagues in 1999 and is defined as the “boundary or transitional state between normal aging and dementia” 1. Patients diagnosed with MCI are at a high risk of developing dementia, suggesting that MCI is a predecessor of dementia. The MCI concept originally focused on memory impairment; however, recent research has divided MCI into amnestic MCI, which is primarily characterized by memory impairments, and non-amnestic MCI, which is related to impairments in other areas such as executive function, attention, language, and visuospatial cognition. A multifaceted assessment of multiple cognitive domains, including memory, language, executive function, visuospatial cognition, and attention, is generally used to diagnose MCI. The Montreal Cognitive Assessment (MoCA) is a widely used assessment battery for effective MCI detection 2. Screening tests based on memory load effectively detect amnestic MCI, but show reduced accuracy in detecting non-amnestic MCI. The high annual progression rate from MCI to dementia (approximately 10%) 3 highlights the importance of establishing testing methods for the early detection of non-amnestic MCI.
Early symptoms of Alzheimer’s disease, such as difficulty drawing shapes, becoming lost while driving, and being unable to park a car, may appear even in the absence of visual impairment 4. These symptoms constitute visuospatial cognitive impairment and are important for the early diagnosis of dementia. The cerebral cortex uses two pathways for processing visual information 5. First, the ventral visual pathway processes information for object identification. This pathway begins in the primary visual cortex, passes through the temporal cortex, and reaches the prefrontal cortex. Second, the dorsal visual pathway processes information such as the position and depth of an object. The dorsal visual pathway originates in the primary visual cortex and passes through the parietal cortex before reaching the prefrontal cortex. Visual information from these two pathways converges again in the prefrontal cortex for visual information processing. Reduced blood flow to the parietal–occipital lobe occurs in the early stages of Alzheimer’s disease 6. In other words, the reduced blood flow to the parietal–occipital lobe observed in patients with Alzheimer’s disease likely influences the function of the dorsal visual pathway. This may impair the dorsal visual pathway, resulting in symptoms such as difficulty estimating the spatial location and depth of objects. Visuospatial cognitive impairment is a clinical symptom observed not only in Alzheimer’s disease, but also in dementia with Lewy bodies and non-amnestic MCI. Therefore, the quantitative assessment of visuospatial function may contribute to the early detection of MCI.
Visuospatial cognitive impairment is often detected using cube copying and clock drawing tests. However, patients with neurodegenerative diseases such as dementia may have multiple damaged areas, rendering these tests inadequate for assessment and differentiation. Hence, specialized testing methods should be established to assess visuospatial cognitive impairment. Therefore, we developed virtual reality (VR) content to quantitatively assess depth perception. The purpose of this study was to objectively demonstrate the discriminative capability of the proposed system for differentiating between healthy elderly individuals and those suspected of having MCI based on statistical analysis and machine learning.
2. Methods
2.1. Experiments
Our research group previously created VR content that enables spheres to be displayed on a screen and move freely along the depth direction 7,8,9. The VR content was created using Unity and allows up to three spheres to be displayed within the VR environment. The adjustable parameters included the number, color, size, speed, movement range, and initial position of the sphere(s).
The VR content was presented through a head-mounted display (HMD) equipped with eye-tracking to acquire gaze information. We used the HTC Vive Pro Eye HMD with embedded eye-tracking to display the VR content. This HMD was equipped with an eye tracker produced by Tobii Technology, the world’s largest manufacturer of eye-tracking products. The tracker acquired gaze information (e.g., gaze vector, eyeball position, pupil position, pupil diameter, and eye opening and closing) from each eye at a sampling rate of 119.5 Hz.
In the experiments, we assessed the created VR content by presenting it to eight healthy elderly adults (age, 71.5\(\pm\)4.6 years) working at the Toyama Nursing Association and 10 elderly adults (age, 81.6\(\pm\)6.86 years) with suspected MCI who were attending nursing homes in Toyama Prefecture. The healthy elderly group consisted of older adults working at the Toyama Nursing Association who were able to perform their daily work activities without difficulty. Cognitive screening using the Japanese version of the Montreal Cognitive Assessment (MoCA-J) was conducted only for participants in the suspected MCI group. Participants with MoCA-J scores of 25 or lower were classified as “suspected of having MCI” in this study. As the MoCA-J is a screening tool rather than a clinical diagnostic instrument, the term “suspected MCI” was used throughout this study. We fully explained the experiment to the participants in advance and obtained their written informed consent to participate. The experiments were approved by the Toyama Prefectural University Ethics Committee (approval number R3-1).
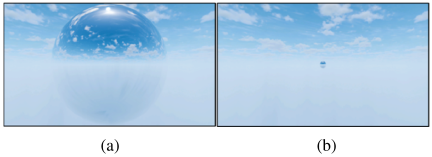
Fig. 1. VR content used in experiments at depths of (a) 1 and (b) 15.
The VR content consisted of a single sphere displayed at the center of the screen, which periodically moved along the depth direction toward the observer at a pace of five times every 30 s. The sphere depth parameter was set to 1 for the nearest position and 15 for the farthest position (Fig. 1). Calibration of the eye-tracking system was performed after confirming that the HMD was comfortably worn by the participant. Before the experiments, the participants were instructed to constantly gaze at the sphere displayed at the center of the screen and to try not to move their neck or body during eye-tracking. Participants wearing glasses were asked to remove them to avoid interference with the equipment, whereas those wearing contact lenses were allowed to wear them during the experiments. The presentation time of the VR content in the experiment was set to at least 35 s per trial over multiple trials.
2.2. Analyses
In the experiments, we focused on the pupillary distance (PD) between the left and right eyes as an indicator of the participant’s depth perception. The PD fluctuates owing to convergence and divergence. Therefore, we used the Vive Pro Eye system to obtain PD by calculating the Euclidean distance between the estimated eyeball positions of the left and right eyes. In addition, we used the coefficient of determination (\(R^2\)) and the power estimate from the power spectrum of the sinusoidal fitting of the acquired PD time series as representative values for each participant. The time series used to calculate each representative value is shown in (Fig. 2).
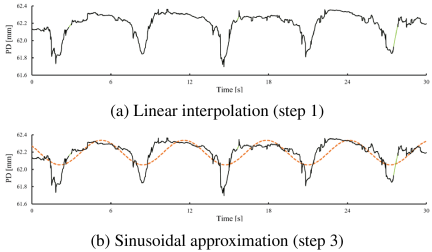
Fig. 2. Acquisition of representative time series.
-
1)
We aimed to exclude the influence of blinking by treating the intervals in the acquired PD time series where blinks were observed, including the 0.05 s period before and after the blink interval, as missing values and conducting linear interpolation of the missing data points 10.
-
2)
The linearly interpolated time series was segmented by shifting a 30 s window (3586 data points) in 1 s intervals (120 data points).
-
3)
\(R^2\) per segment of the time series was calculated using sinusoidal fitting. This approximate fitting was conducted by searching for a sinusoidal wave with the maximum \(R^2\) by gradually changing the amplitude of the sinusoidal wave synchronized with the sphere movement period.
-
4)
The 30 s period with the highest \(R^2\) per participant was used as the representative time series. However, time series with abundant noise or data loss owing to eye blinking exceeding 20% was excluded from the analysis. This procedure was intended to extract the time interval at which the participant stably tracked the target stimulus and to ensure sufficient data quality for subsequent analyses.
3. Results
A representative PD time series acquired from the healthy group is shown in Fig. 3. Measurements were obtained from eight participants; however, two participants were excluded because their time series did not meet the criteria described in step 4 of the analysis procedure. The time series from the healthy group showed a tendency for shorter PD with decreasing sphere depth and longer PD with increasing depth. The coefficients of determination for the sinusoidal approximation exceeded 0.5, confirming that the PD fluctuated with changes in sphere depth. Next, we calculated the power spectrum using a discrete Fourier transform for the representative time series data from the healthy group. The number of oscillations per 30 s constituted cycles per half minute [cphm], which was set as the unit for measuring the peak frequency position. The peak frequency of the representative time series data for the healthy group was 5 cphm for all participants.
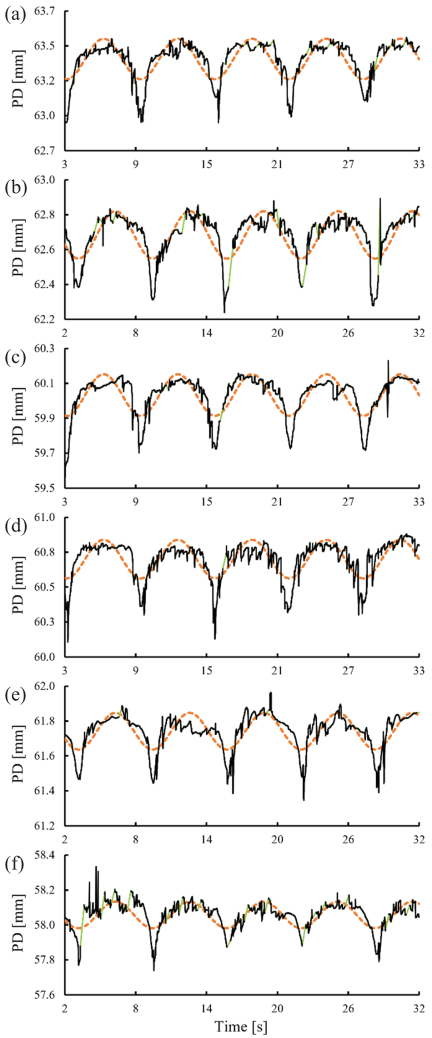
Fig. 3. Representative time series of the healthy group for the following participants: (a) female, 68 years old (\(R^2=0.60\)), (b) female, 67 years old (\(R^2=0.58\)), (c) female, 73 years old (\(R^2=0.58\)), (d) female, 77 years old (\(R^2=0.56\)), (e) female, 66 years old (\(R^2=0.55\)), and (f) female, 79 years old (\(R^2=0.51\)).
A representative PD time series obtained for the suspected MCI group is shown in Fig. 4. In this group, four participants (including those whose measurements were discontinued) did not satisfy criterion (4) for representative time series data and were therefore excluded from the analysis, leaving six participants for further analysis. The representative time series for the suspected MCI group confirmed that some participants could track the sphere suitably with their gazes, whereas others failed to follow the sphere. The power spectrum was obtained by applying a discrete Fourier transform to the representative time series of the suspected MCI group (Fig. 5). The power at 5 cphm in the power spectrum was small for participants, with low coefficients of determination obtained using sinusoidal wave fitting.
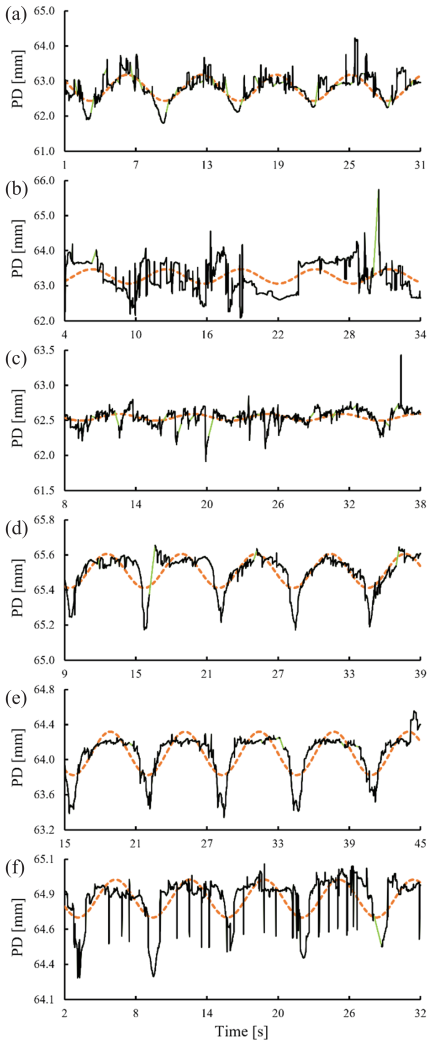
Fig. 4. Representative time series of the suspected MCI group for the following participants: (a) female, 73 years old (\(R^2=0.50\)), (b) male, 91 years old (\(R^2=0.09\)), (c) female, 89 years old (\(R^2=0.09\)), (d) female, 67 years old (\(R^2=0.51\)), (e) female, 86 years old (\(R^2=0.60\)), and (f) male, 84 years old (\(R^2=0.36\)).
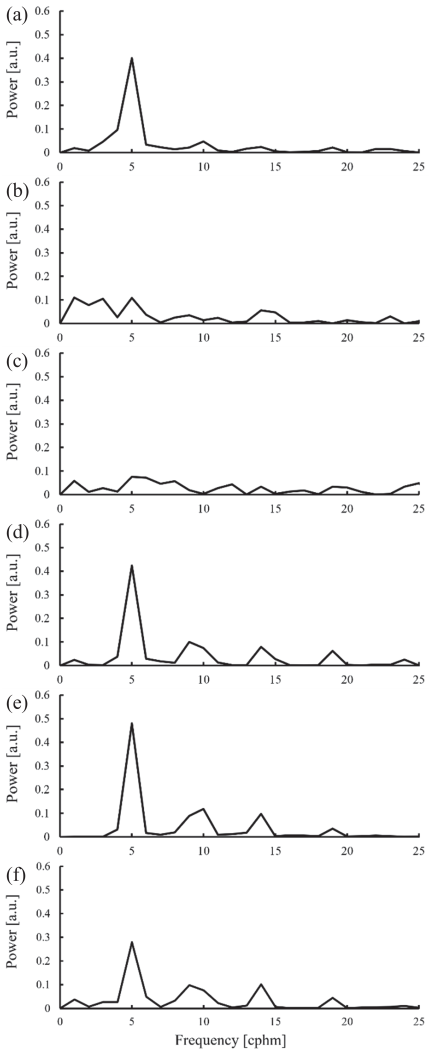
Fig. 5. Power spectra of the MCI group for the following participants: (a) female, 73 years old, (b) male, 91 years old, (c) female, 89 years old, (d) female, 67 years old, (e) female, 86 years old, and (f) male, 84 years old.
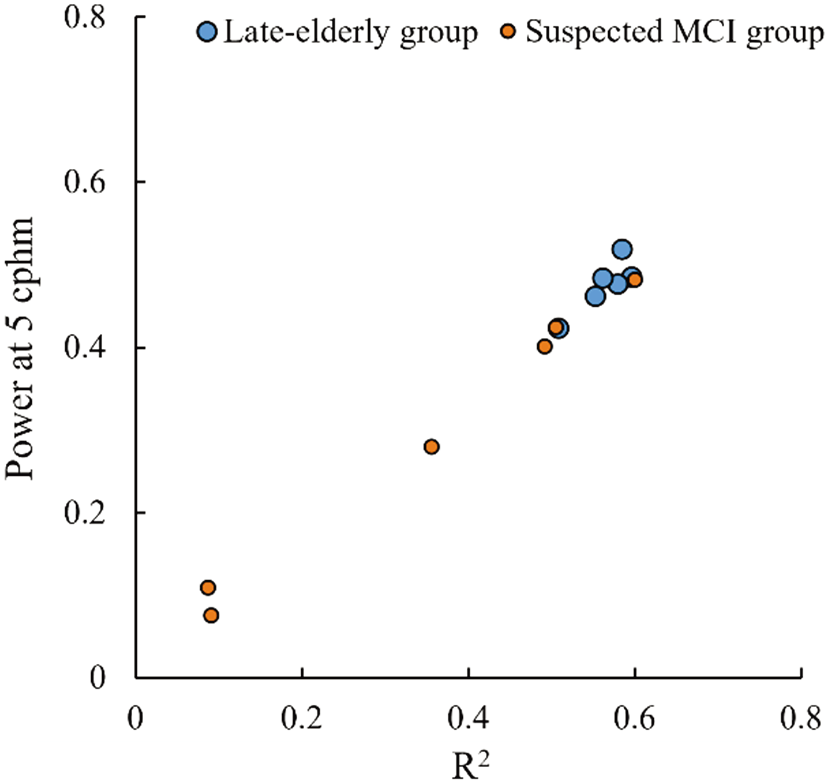
Finally, we conducted a statistical analysis using the Mann–Whitney U test on the representative values obtained from the healthy and suspected MCI groups. Statistical significance was set at \(p<0.05\). The results of the statistical analyses are shown in Figs. 6 and 7. The coefficient of determination for the sinusoidal approximation tended to be lower in the suspected MCI group than in the healthy group (\(p=0.065\)). The power at 5 cphm in the power spectrum was also significantly lower in the suspected MCI group than in the healthy group (\(p=0.026\)).
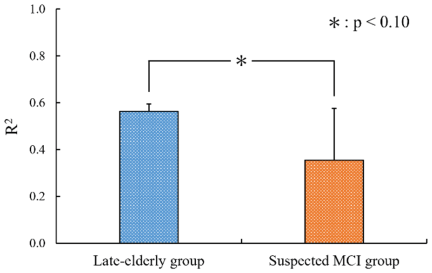
Fig. 6. \(R^2\) for sinusoidal fitting (mean \(\pm\) standard deviation).
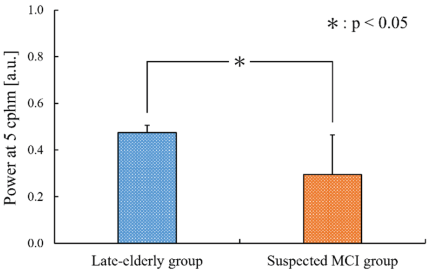
Fig. 7. Power at 5 cphm obtained from the power spectrum (mean \(\pm\) standard deviation).
Finally, we conducted group classification by applying linear discriminant analysis 11 to the two representative values that showed significant differences in the experimental results. No misclassifications were observed in the healthy group, whereas two misclassifications occurred in the suspected MCI group (Fig. 8).
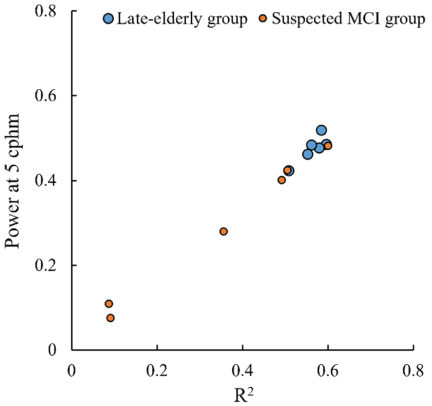
Fig. 8. Feature space according to power and \(R^2\) values.
4. Discussion
Visuospatial cognitive impairment is a clinical symptom observed not only in patients with Alzheimer’s disease, but also in those with non-amnestic MCI. Therefore, quantitative assessment of visuospatial cognitive impairment seems promising for early MCI detection. Our research group is developing VR content that allows the quantitative assessment of depth perception abilities. Our previous study involved an experiment with healthy young adults and confirmed that the PD between the left and right eyes is an effective indicator of depth perception 7. This measurement is relatively insensitive to visual acuity and the use of contact lenses 8,9. In this study, we used this indicator to evaluate healthy elderly adults working at the Toyama Nursing Association and elderly individuals with suspected MCI attending nursing homes.
We assumed that the measurement results in the healthy group were influenced by presbyopia. However, an investigation of the representative time series confirmed that the PD values fluctuated according to changes in sphere depth for all participants. The coefficients of determination for the sinusoidal approximation exceeded 0.5 in the healthy group, indicating stable tracking performance. In the suspected MCI group, all participants had MoCA-J scores of 25 or lower and were therefore classified as individuals suspected of having MCI 12,13. The representative time series showed that some participants successfully tracked the stimulus, whereas others failed to do so, and this trend was not clearly associated with the MoCA-J scores. Statistical analysis revealed significant differences between the healthy and suspected MCI groups in both the coefficient of determination for sinusoidal fitting and power at 5 cphm. Linear discriminant analysis using these indices correctly classified all healthy participants with two misclassifications in the suspected MCI group.
MCI is a heterogeneous condition arising from various underlying pathologies, and its characteristics may differ depending on the cause. Linear discriminant analysis based on the visuospatial and executive function items in the MoCA-J identified four participants (a, b, c, and f) as suspected of having MCI. These participants showed impairments in the cube copying and clock drawing tests (Fig. 9). In particular, participants b and c showed marked deficits in clock drawing and cube copying, respectively, whereas participant f also performed poorly in cube copying. Participant a was classified as having MCI by the proposed method, despite relatively preserved representative values, but also showed impairment in cube copying. These results suggest that the proposed quantitative indices may capture visuospatial dysfunction, which is consistent with the results of conventional neuropsychological tests. In contrast, participant d showed distortions in drawing tasks but had non-dominant right hemiplegia, suggesting that the observed deficits were not due to visuospatial or executive dysfunctions. This interpretation is consistent with the high coefficient of determination obtained in the proposed analysis.
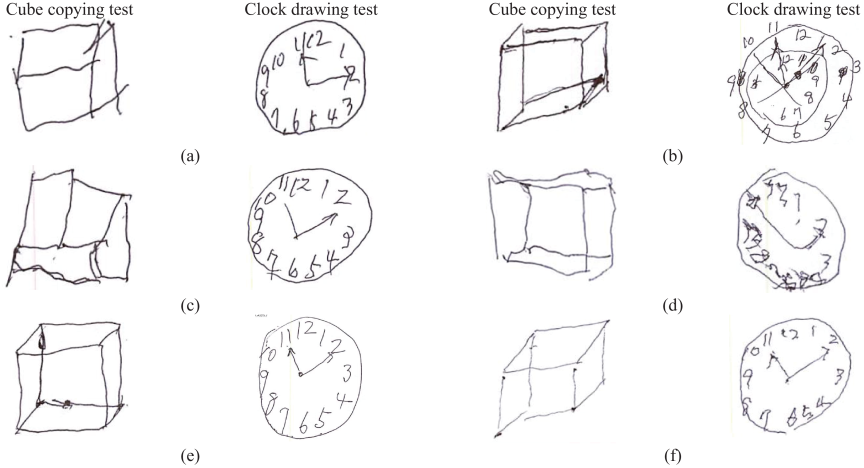
Fig. 9. Results of MoCA-J (excerpt) in the MCI group for the following participants: (a) female, 73 years old (TS \(=24\)), (b) male, 91 years old (TS \(=21\)), (c) female, 89 years old (TS \(=18\)), (d) female, 67 years old (TS \(=17\)), (e) female, 86 years old (TS \(=15\)), (f) male, 84 years old (TS \(=12\)) (TS, MoCA-J test score).
However, this study had several limitations. First, the suspected MCI group was older than the healthy group, and age-related changes in visual and oculomotor functions may have influenced the results. Therefore, the observed differences may partially reflect age-related effects in addition to cognitive decline. Future studies should include age-matched groups or apply statistical adjustments to isolate the effects of cognitive impairment better. Second, the number of participants was limited and the classification results may have been influenced by overfitting; therefore, the findings should be interpreted as preliminary. Third, the analysis employed the 30 s segment with the highest \(R^2\) as the representative time series. Although this approach reduces the influence of noise caused by blinking or gaze instability, it may reflect the participants’ best performance rather than their average performance, which should be considered when interpreting the results.
In addition, several factors specific to elderly participants affected eye-tracking measurements. These include difficulties in stabilizing the HMD owing to facial characteristics, difficulty in detecting the pupil owing to ptosis, frequent blinking leading to missing data, and interference with the infrared camera caused by eyebrows or other facial features. In some cases, these factors could not be identified before measurement, resulting in unsuitable data for analysis. These findings indicate that device fitting and eye-tracking robustness are critical factors for the practical application of VR-based assessments in elderly populations.
Despite these limitations, the proposed method has advantages over conventional qualitative assessments such as cube copying and clock drawing tests. The use of quantitative indices, including \(R^2\) and spectral power, enabled an objective and reproducible evaluation. Furthermore, these indices may allow the detection of subtle changes in visuospatial function that are difficult to capture through visual inspection alone, and may enable longitudinal tracking of functional changes over time. These characteristics highlight the potential of the proposed method for early detection and monitoring of non-amnestic MCI.
Finally, we initially considered measuring static and dynamic visual acuity using an ophthalmological optometer because visual decline has been associated with an increased risk of dementia 14. However, such systems often require slow operation and complex judgments, making them unsuitable for elderly individuals with cognitive decline. In contrast, the proposed VR-based assessment requires no complex operations and only requires the participants to observe the presented stimuli. This simplicity suggests that this method may be useful as a practical tool for quantitative screening for early MCI detection.
5. Conclusion
We created VR content that allowed quantitative assessment of the depth perception ability of individuals and conducted demonstration experiments with groups of healthy individuals and individuals with suspected MCI. The results showed significant differences between the groups in both the coefficient of determination when fitting a sinusoidal wave to the acquired PD time series and the power at 5 cphm in the power spectrum. Linear discriminant analysis using these two values revealed no misclassifications in the healthy group and two misclassifications in the suspected MCI group. All participants with suspected MCI demonstrated problems with questions related to visuospatial and executive functions in the MoCA-J. These findings suggest that the proposed VR content may contribute to the quantitative assessment of an individual’s visuospatial function. In future studies, we plan to increase the number of evaluated individuals and verify the effectiveness of the proposed approach as a screening method for MCI.
Acknowledgments
This research was supported in part by the Tateisi Science and Technology Foundation, the Hoso Bunka Foundation, and JSPS Grants-in-Aid for Scientific Research (KAKENHI) (Nos.23K16928 and 26K14923).
- [1] R. C. Petersen, G. E. Smith, S. C. Waring, R. J. Ivnik, E. G. Tangalos, and E. Kokmen, “Mild cognitive impairment: Clinical characterization and outcome,” Archives of Neurology, Vol.56, No.3, pp. 303-308, 1999. https://doi.org/10.1001/archneur.56.3.303
- [2] H. Suzuki, M. Yasunaga, and T. Naganuma, “Validation of the Japanese version of the Montreal Cognitive Assessment to evaluate the time course changes of cognitive function: A longitudinal study with mild cognitive impairment and early-stage Alzheimer’s disease,” Japanese J. of Geriatric Psychiatry, Vol.22, No.2, pp. 211-218, 2011 (in Japanese).
- [3] K. Nakajima, S. Shimohama, H. Tomimoto, M. Mimura, and T. Arai, “Dementia Disease Treatment Handbook (2nd ed.),” Igaku-Shoin, 2021.
- [4] M. F. Mendez, and J. L. Cummings, “Dementia: A Clinical Approach (3rd ed.),” Butterworth-Heinemann, 2003.
- [5] M. A. Goodale and A. D. Milner, “Separate visual pathways for perception and action,” Trends in Neurosciences, Vol.15, No.3, pp. 20-25, 1992. https://doi.org/10.1016/0166-2236(92)90344-8
- [6] S. N. Thiyagesh, T. F. D. Farrow, R. W. Parks, H. Accosta-Mesa, C. Young, I. D. Wilkinson, M. D. Hunter, and P. W. R. Woodruff, “The neural basis of visuospatial perception in Alzheimer’s disease and healthy elderly comparison subjects: An fMRI study,” Psychiatry Research: Neuroimaging, Vol.172, No.2, pp. 109-116, 2009. https://doi.org/10.1016/j.pscychresns.2008.11.002
- [7] F. Kinoshita and H. Takada, “A study on the development of VR content for quantitative evaluation of impaired visuospatial ability,” Proc. of the 24th Int. Conf. on Human–Computer Interaction, Lecture Notes in Computer Science, Vol.13521, pp. 440-450, 2022. https://doi.org/10.1007/978-3-031-17902-0_31
- [8] T. Ohara, K. Kawaguchi, T. Takeuchi, and F. Kinoshita, “Visuospatial ability of elderly using head-mounted display with gaze measurement function,” Proc. of the 25th Int. Conf. on Human–Computer Interaction, Lecture Notes in Computer Science, Vol.14021, pp. 81-90, 2023. https://doi.org/10.1007/978-3-031-35897-5_6
- [9] T. Ohara, K. Kawaguchi, T. Takeuchi, and F. Kinoshita, “Study on the quantitative evaluation of convergence-divergence motion using head-mounted display with gaze measurement function,” Proc. of the 18th Int. Conf. on Computer Science & Education, Communications in Computer and Information Science, Vol.2025, pp. 277-285, 2023. https://doi.org/10.1007/978-981-97-0737-9_25
- [10] H. Togawa, “Information Processing Introduction Course 7: Numerical Calculation,” Iwanami Shoten, 1991.
- [11] O. Uchida, “Easy-to-Understand Multivariate Analysis with Excel (2nd ed.),” Tokyo Tosho, 2000.
- [12] Z. S. Nasreddine, N. A. Phillips, V. Bédirian, S. Charbonneau, V. Whitehead, I. Collin, J. L. Cummings, and H. Chertkow, “The Montreal cognitive assessment, MoCA: A brief screening tool for mild cognitive impairment,” J. of the American Geriatrics Society, Vol.53, No.4, pp. 695-699, 2005. https://doi.org/10.1111/j.1532-5415.2005.53221.x
- [13] H. Suzuki, “Points of attention regarding implementation and interpretation related to Japanese version of the Montreal Cognitive Assessment (MoCA-J),” Japanese J. of Geriatric Psychiatry, Vol.29, No.11, pp. 1145-1149, 2018 (in Japanese).
- [14] S. P. Chen, J. Bhattacharya, and S. Pershing, “Association of vision loss with cognition in older adults,” JAMA Ophthalmology, Vol.135, No.9, pp. 963-970, 2017. https://doi.org/10.1001/jamaophthalmol.2017.2838
This article is published under a Creative Commons Attribution-NoDerivatives 4.0 Internationa License.