
Research Paper:
Digitalization, Environmental Regulation, and Carbon Productivity: Evidence from China
Leifeng Zhang*, Yanfang Lyu**,†, and Dong Wang***
*School of Economics and Management, Henan University of Urban Construction
No.8 Longxiang Street, New City District, Pingdingshan, Henan 467036, China
**School of Economics, Guangdong University of Technology
No.161 Yinglong Road, Tianhe District, Guangzhou, Guangdong 510520, China
†Corresponding author
***School of Business, Minnan Normal University
No.36 Xianqianzhi Street, Xiangcheng District, Zhangzhou, Fujian 363000, China

This study incorporates digital factors into the corporate production function and extends the firm-level pollution emission decision-making model. From both technological and structural perspectives, it examines the mechanisms through which digitalization influences carbon productivity. An orthogonal projection-based dynamic evaluation framework is employed to quantify the level of digitalization across Chinese provinces for the period 2011–2022. On this basis, fixed effects, mediation, and partially linear functional-coefficient models are applied to analyze how digitalization affects carbon productivity and its boundary conditions. The results indicate that digitalization significantly enhances carbon productivity, primarily through technological diffusion, industrial restructuring, and energy decarbonization. The results are confirmed by multiple robustness tests. Moreover, environmental regulation plays a nonlinear moderating role, resulting in an inverted U-shaped relationship between digitalization and carbon productivity. When environmental regulation is weak, digitalization crowds out carbon reduction investment, thereby suppressing carbon productivity. As environmental regulation intensifies, the positive impact of digitalization on carbon productivity strengthens. However, once regulation exceeds a certain threshold, digitalization begins to hinder carbon productivity. This study verifies the applicability of the “Porter Hypothesis” in China from the viewpoint of digitalization and offers policy implications for better alignment between digital development and environmental regulation.
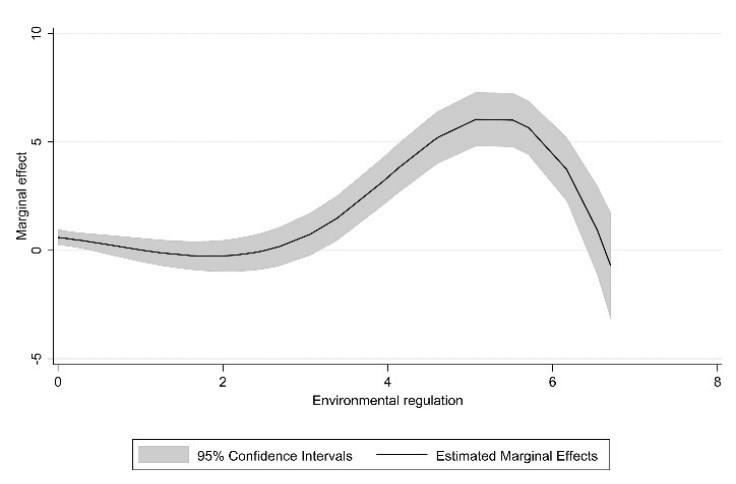
Functional coefficient estimation results
1. Introduction
As the world’s largest developing country, China is also one of the largest contributors to global carbon dioxide emissions. International Energy Agency statistics indicate that its emissions reached 12.6 billion tons in 2024, accounting for approximately 33.5% of the global total. The effective promotion of carbon emission reduction has emerged as a pressing and significant topic of study in China. Compared with the recessionary carbon reduction achieved by reducing production, enhancing carbon productivity is a key approach to reconciling economic development with carbon mitigation 1. Therefore, enhancing carbon productivity is essential to advance the carbon peaking and carbon neutrality targets of China while sustaining long-term economic growth.
Digital technologies are advancing rapidly and becoming increasingly embedded in the real economy. Data from the China Academy of Information and Communications Technology indicate that the digital economy represented 42.8% of the GDP of China in 2023, with its average annual growth rate exceeding that of overall economic output. Amid the digital economy revolution, digital transformation has become an inevitable trend for countries seeking to drive economic growth 2. Despite the onset of digital transformation, its effects on carbon emissions remain unclear.
Some researchers argue that, as a cutting-edge technology, the widespread application of digital technology can improve energy efficiency and reduce carbon emissions 3,4,5. From the perspective of internal corporate governance, Shang et al. 6 report that digitalization markedly reduces carbon emission intensity by enhancing firms’ internal control and environmental information disclosure capabilities. From the perspective of industrial structure, Lyu et al. 7 argue that, as an environmentally friendly sector, the rapid expansion of the digital industry can crowd out energy- and pollution-intensive activities, thereby optimizing the industrial structure and fostering low-carbon economic and social development. However, other studies suggest that the extensive deployment of digital equipment raises electricity demand and may consequently harm environmental outcomes 8. In terms of energy efficiency, Benedetti et al. 9 find that while digital technologies improve energy utilization efficiency, they also expand overall energy demand. Such efficiency gains may result in a carbon rebound effect 10. From the perspective of production scale expansion, Mula et al. 11 find that digital technologies can drive the expansion of production scale, which may, in turn, increase total carbon emissions. From the perspective of institutional pressure, Wang et al. 12 identify a non-monotonic relationship linking the digital economy with carbon emissions, whereby more stringent environmental regulation enhances carbon mitigation.
Although previous studies have explored this issue from diverse perspectives, the channels through which digitalization affects carbon emissions remain unclear. In particular, few studies have explored how external environmental constraints shape the impact of digitalization on carbon productivity. It remains unclear whether digitalization ultimately exerts a beneficial or adverse effect on carbon productivity. Moreover, it is uncertain whether external environmental constraints explain the heterogeneity in the effects of digitalization on carbon productivity. Addressing these questions is of considerable importance for leveraging digitalization, achieving the “dual-carbon” goals, and promoting high-quality economic growth.
2. Theoretical Analysis and Hypothesis
2.1. Digitalization and Carbon Productivity
Classical environmental impact assessment models identify technology, structure, and scale as the primary determinants of carbon emissions 13. Building on the production function framework proposed by Acemoglu and Restrepo 14, this study incorporates digital intermediate goods into a firm-level pollution emission decision model 15 to explore how digitalization shapes carbon productivity and its underlying mechanisms. Based on this, the decision function for firms’ carbon productivity is derived as follows:
Equation (1) shows that carbon productivity depends on various technologies, the energy structure, and composition of intermediate inputs. This relationship is consistent with economic theory. First, technological improvements can improve firm production efficiency and reduce energy waste 16. Second, the clustering and spillover effects generated by digitally connected industries can reshape regional industrial structures and accelerate the exit of low-efficiency firms. Third, digital technologies facilitate the integration of clean energy into power grids, crowding-out the demand for fossil fuels. Simplifying Eq. (1) yields:
According to Eq. (3), the factors influencing carbon productivity can be divided into four categories: digitally biased technology, energy structure, technological progress, and intermediate input structure. The variable \(\ln n\) captures digitally biased technology. Differentiating Eq. (3) with respect to \(\ln n\) gives the partial derivative of \(\ln \textit{CP}\) as: \(\partial \ln\textit{CP}/\partial \ln n=\varepsilon\), where \(\varepsilon\) is the elasticity of substitution between intermediate inputs, with \(0<\varepsilon<1\). Therefore, \(\partial \ln\textit{CP}/\partial \ln n>0\), indicating that digitally biased technology promotes the improvement of carbon productivity 17. The digital economy is fundamentally driven by innovations rooted in digitally biased technologies. As a critical driver of digitalization, digital technologies enable manufacturing firms to upgrade production processes and optimize input structures, while simultaneously enhancing efficiency and lowering energy use, thereby creating positive spillovers for carbon mitigation.
The intermediate input structure is: \(X_i=x_i^{\varepsilon}g_i^{1-\varepsilon}\). Differentiating Eq. (3) with respect to \(\ln X\) gives: \(\partial \ln\textit{CP}/\partial \ln X=1-\kappa>0\). Since \(\partial \ln X/\partial \ln g>0\), we obtain \(\partial \ln\textit{CP}/\partial \ln g>0\). This finding indicates that digital intermediate inputs enhance carbon productivity in manufacturing industries. From the perspective of intermediate input structure, digital inputs facilitate the spatial agglomeration of complementary production factors, thereby driving carbon mitigation through the crowding-out effect in low-productivity industries. The demand for digitalization has driven the rapid development of the digital industry, which, in turn, has fostered the agglomeration of digital industries and related technological sectors within regions. This industrial agglomeration exerts a “crowding-out effect” on inefficient industries, thereby promoting the transformation of regional industrial structures toward R&D-intensive and service-oriented manufacturing 18. Because high-tech industries are typically characterized by higher production efficiency and lower energy consumption, digitalization can improve carbon productivity by reshaping the sectoral structure.
To examine the role of energy structure in shaping carbon productivity, we differentiated Eq. (3) with respect to \(\ln\theta_G\) and obtained \(\partial \ln\textit{CP}/\partial \ln\theta_G=-1\). Since \(\partial \ln\textit{CP}/\partial \ln\theta_G<0\), this suggests that a higher proportion of fossil fuels (such as coal) in total energy consumption suppresses carbon productivity. From the standpoint of energy structure decarbonization, digital inputs accelerate the substitution of clean energy for conventional energy, promoting the cleanliness of the energy structure, with \(\partial \ln\theta_G/\partial \ln g>0\). The deployment of digital technologies, including big data and artificial intelligence, in power systems enables real-time monitoring of energy networks, thereby promoting the widespread deployment of renewable energy sources, such as wind and solar power, into the grid. On the other hand, the widespread adoption of digital products boosts the demand for clean energy and decreases the dependence on nonrenewable energy sources 19. A growing share of clean energy in total energy use helps reduce carbon emissions in the manufacturing sector. Therefore, digitalization enhances carbon productivity through the decarbonization effect of the energy structure.
To examine the effect of technological progress on carbon productivity, we differentiate Eq. (3) with respect to \(\ln A\), yielding: \(\partial \ln\textit{CP}/\partial \ln A=-\mu\). Since \(\mu<0\), we obtain \(\partial \ln\textit{CP}/\partial \ln A>0\). This indicates that with technological advancement, energy utilization efficiency has increased and energy consumption per unit of output has declined. From the perspective of technology spillover, digital inputs can overcome the time and space constraints of factor flows and promote the spread of technology and knowledge. Based on technology diffusion theory, new knowledge and technology gradually penetrate various fields through the interaction between economic entities, thus promoting production efficiency and innovation capability of the entire economic system. First, digital platforms exhibit virtual agglomeration characteristics that help reduce transaction costs in technology searches by mitigating information asymmetry and market friction, thereby enhancing technological innovation efficiency 20. Second, digital platforms can aggregate valuable information and resources, facilitating technology sharing and complementary learning among enterprises through collaborative innovation. This enhances the technological absorptive capacity of firms and accelerates the diffusion of core technologies to peripheral areas. In summary, digitalization enhances carbon productivity by driving technological progress and diffusion.
Drawing on the preceding theoretical analysis, we formulate Hypothesis 1:
-
\(H_1\):
Digitalization improves carbon productivity by facilitating the restructuring of industrial sectors, driving energy decarbonization, and accelerating technological diffusion.
2.2. Moderating Effect of Environmental Regulation
Under different levels of environmental regulation, digitalization may have varying impacts on carbon productivity 21. In the absence of environmental constraints, enterprises focus primarily on short-term economic benefits, while giving little attention to environmental sustainability. Therefore, the main goal of digitalization is to enhance production performance and lower costs rather than reduce carbon emissions. Although digitalization improves production efficiency, the carbon-reduction effect remains limited due to insufficient incentives for carbon-reduction within enterprises.
As environmental regulations tighten, enterprises face increasing pressure from government policies, consumer demands, and social responsibilities, leading them to incorporate environmental protection and ESG considerations into their economic decision-making. According to signaling theory, when society and the government place greater emphasis on environmental issues, the environmental constraints faced by enterprises strengthen, prompting them to invest in more digital technologies in green production. For instance, digital technologies have been applied in energy management and intelligent manufacturing. Therefore, appropriate environmental regulations can strengthen the carbon-reduction effects of digitalization.
However, excessive environmental constraints and policy interventions by government authorities may inhibit corporate carbon reduction. When faced with stringent environmental regulations, some enterprises tend to adopt low-cost end-of-pipe pollution control methods for carbon reduction or even temporarily halt or reduce production. According to the theory of excessive intervention, when government environmental requirements become overly stringent, enterprises may engage in “adaptive innovation” rather than “breakthrough innovation” because of rising compliance costs and intrusive administrative interference. Such excessive environmental constraints cause firms to allocate more resources to meeting regulatory demands instead of investing in green technology research and development, which can yield long-term innovative benefits 22. Therefore, overly stringent environmental regulations may suppress the carbon-reduction effects of digitalization by increasing compliance costs and limiting firms’ capacity for autonomous innovation. Building on this, Hypothesis 2 is proposed.
-
\(H_2\):
When environmental regulation acts as a moderator, the impact of digitalization on carbon productivity exhibits an “inverted U-shaped” pattern.
3. Empirical Design
3.1. Variables
3.1.1. Core Explanatory Variable
This study employs a dynamic measurement approach using orthogonal projections to evaluate the extent of digitalization across 30 Chinese provinces. Suppose there are \(n\) evaluated entities and \(m\) evaluation indicators. The original data for the \(m\) indicators over periods \(t_1,t_2,\dots,t_N\) form a panel data matrix \(x_{ij}(t_k)\), where \(i=1,2,\dots,n\); \(j=1,2,\dots,m\); and \(k=1,2,\dots,N\). If any value of the \(j\)-th indicator satisfies \(x_{ij}(t_k)<0\), the data are transformed to ensure non-negativity, as follows:
For simplicity, let \(x'_{ij}(t_k)\) be denoted by \(x_{ij}(t_k)\). We then apply the following globally improved normalization to non-negative positive indicators:
Furthermore, the proportion of indicator \(j\) for entity under evaluation \(i\) at time \(t_k\) is represented by \(p_{ij}(t_k)\):
The highest value of the \(j\)-th indicator across all entities and time periods is defined as the ideal solution, whereas the lowest value serves as the negative ideal solution. To facilitate computation, the origin is shifted to the ideal solution through coordinate translation. The ideal solution before translation is denoted as: \(F_0^{+}=(f_{ij}(t_k))=(f_1^{+}f_2^{+},\ldots,f_m^{+})\). The ideal solution after translation is: \(F^{+}=(0,0,\dots,0)\). The translated negative ideal solution is: \(F^{-}=(f_1^{-},f_2^{-},\dots,f_m^{-})\). Based on the translated ideal solution \(F_0^{+}\), the matrix is obtained as: \(V(t_k)=v_{ij}(t_k)=f_{ij}(t_k)-f_j^{+}\). For each entity under evaluation, the distance between the ideal and negative ideal solutions remains unchanged. Therefore, the perpendicular distance of each region to the ideal solution, denoted as \(P_i(t_k)\), is
| Primary indicator | Secondary indicator | Weight |
| Digital infrastructure | Internet broadband access rate | 0.0701 |
| Scale of mobile phone facilities | 0.0679 | |
| Long-distance optical cable line length | 0.0684 | |
| Domain name size | 0.0532 | |
| Web page size | 0.0396 | |
| Number of websites per hundred enterprises | 0.0728 | |
| Number of post offices | 0.0639 | |
| Digital policy |
Policy intensity of digital economy |
0.0702 |
| Digital innovation investment | R&D expenditure of large-scale industrial firms | 0.0553 |
| Science and technology expenditure | 0.0558 | |
| Investment in new product development | 0.0522 | |
| Digital industry transformation efficiency | Per capita scale of telecommunications business | 0.0610 |
| Mobile phone usage rate | 0.0728 | |
| Internet usage rate | 0.0702 | |
| Number of information technology services | 0.0563 | |
| Digital inclusive finance score | 0.0704 | |
| Share of e-commerce transactions | 0.0690 | |
| E-commerce revenue | 0.0513 |
Compared with the existing literature, which typically relies on single proxies such as Internet penetration rates or ICT investment intensity to measure digitalization, this study develops a multidimensional evaluation framework. Specifically, we construct a composite index that captures four key dimensions: digital infrastructure, digital policy support, digital innovation input, and the effectiveness of digital industrial transformation. The specific indicators are listed in Table 1.
3.1.2. Dependent Variable
Provincial carbon emissions are calculated using the IPCC’s sectoral approach:
Single-factor carbon productivity is defined as the industrial production value per unit of carbon emission.
Furthermore, a Super-SBM-VRS model incorporating undesirable outputs was employed to assess total factor carbon productivity. Assume there are \(n\) decision-making units (DMUs), each utilizing \(m\) inputs to produce \(r_1\) desirable outputs and \(r_2\) undesirable outputs. Each DMU generates \(r_1\) types of expected output and \(r_2\) types of undesirable output. The corresponding input factors, expected outputs, and undesirable outputs are denoted as: \(x_{ik}\), \(y_{qk}\), and \(b_{tk}\), respectively. The efficiency value \(\rho\) is calculated using the following model:
3.1.3. Control Variables
The control variables in this study include regional economic performance (Pgdp), approximated by the logarithm of per capita GDP, and urbanization (Urban), quantified by the proportion of urban residents in each province at year-end. Population density (Popul) was calculated as the regional resident population divided by administrative areas. Foreign direct investment (Fdi) is expressed as the ratio of FDI to real GDP. Innovation output (Innov) is measured by the logarithm of patent applications. The transportation infrastructure (Traf) was measured using road mileage. Social consumption (Consum) is measured as the share of consumer goods retail turnover in GDP, whereas the tax burden (Tax) is computed as the proportion of tax revenue to GDP. Environmental infrastructure (Envir) is proxied by the logarithm of urban greenspace area.
3.2. Data Sources
Data were obtained from the China Social Statistical Yearbook, provincial and municipal statistical yearbooks, the National Bureau of Statistics website, and the CNRDS, CEADs, and EPS databases. For small amounts of missing data, a linear interpolation method was used. Based on data availability, this study uses panel data from 30 Chinese provinces from 2011 to 2022. Table 2 presents the descriptive statistics of the variables.
| Variable | \(N\) | Mean | SD | Med | Min | Max |
| Tlcp | 360 | 0.397 | 0.218 | 0.339 | 0.112 | 1.597 |
| Slcp | 360 | 0.432 | 0.614 | 0.264 | 0.035 | 6.847 |
| Digital | 360 | 0.149 | 0.147 | 0.098 | 0.000 | 0.911 |
| Pgdp | 360 | 6.080 | 3.045 | 5.286 | 1.641 | 19.03 |
| Urban | 360 | 0.601 | 0.121 | 0.588 | 0.350 | 0.896 |
| Popul | 360 | 8.208 | 0.741 | 8.280 | 6.342 | 9.448 |
| Fdi | 360 | 0.124 | 0.626 | 0.043 | 0.008 | 8.317 |
| Innov | 360 | 10.29 | 1.458 | 10.41 | 6.219 | 13.68 |
| Traf | 360 | 1.170 | 0.085 | 1.197 | 0.940 | 1.291 |
| Consum | 360 | 0.387 | 0.059 | 0.392 | 0.180 | 0.504 |
| Tax | 360 | 2.073 | 0.311 | 2.033 | 1.268 | 2.935 |
| Envir | 360 | 0.096 | 0.091 | 0.072 | 0.004 | 0.540 |
3.3. Econometric Model
3.3.1. Benchmark Model
This study developed the following benchmark model to examine the effect of digitalization on carbon productivity:
3.3.2. Mediation Model
To investigate the channels through which digitalization operates, a mediation effect model was constructed:
Here, \(\textit{Med}_{\textit{it}}\) includes technology diffusion (\(\textit{Techdif}_{\textit{it}}\)), industrial restructuring (\(\textit{Indust}_{\textit{it}}\)), and energy decarbonization (\(\textit{Energy}_{\textit{it}}\)) effects. The specifications of the remaining variables are provided in Eq. (14).
3.3.3. Partially Linear Functional-Coefficient Model
The functional coefficient model can better capture nonlinear relationships that align with real-world characteristics than panel models that incorporate interaction terms 23. Unlike estimation errors and model misspecifications caused by improper sample segmentation, incorrectly specified interaction terms, overly strict assumptions, or specific functional forms, the functional coefficient model accounts for both individual and temporal heterogeneity, thereby overcoming these limitations 24. Therefore, a partially linear functional coefficient model was employed to assess the moderating role of environmental regulation.
In this model, \(G(\textit{Er}_{\textit{it}})\) denotes an unknown function that reflects the marginal impact of digitalization; \(\textit{Er}_{\textit{it}}\) represents environmental regulatory pressure, and the remaining variables follow Eq. (14). This study employed the sequential estimation approach of An et al. 25 to estimate \(G(\textit{Er}_{\textit{it}})\). First, the varying coefficient function \(G(\textit{Er}_{\textit{it}})\) is approximated using a weighted sum of the sieve basis functions as follows:
Here, \(h(\textit{Er}_{\textit{it}})=[h_1(\textit{Er}_{\textit{it}}),\dots,h_k(\textit{Er}_{\textit{it}})]'\) is a basis function vector of \(k\times 1\). \(\eta=[\eta_1,\dots,\eta_k]'\) is a \(k\times 1\) unknown parameter vector. As \(k\) increases, the variable coefficient function \(G(\textit{Er}_{\textit{it}})\) can be closely approximated using the weighted sum of the basic functions \(h(\textit{Er}_{\textit{it}})\), with the residual error approaching zero. Therefore, Eq. (16) is expressed as follows:
All explanatory variables are assumed to be exogenous. Eq. (19) provides the estimation of the coefficient vector \((\hat{\eta},\hat{\rho})\) by the least squares estimation method:
Therefore, the coefficients of the variable coefficient function \(G(\textit{Er}_{\textit{it}})\) are estimated by \(\hat{G}(\textit{Er}_{\textit{it}})=h(\textit{Er}_{\textit{it}})'\hat{\eta}\).
4. Results and Discussion
4.1. Benchmark Regression
The benchmark regression employs a panel fixed-effects model to account for regional heterogeneity and temporal effects. As reported in Table 3, the estimated coefficient of digitalization is significantly positive, indicating that digitalization effectively enhances carbon productivity. Digitalization strengthens regional resource advantages and improves the synergistic efficiency of technology integration. This, in turn, enhances firms’ capacity to absorb technologies and facilitates the widespread adoption of green innovations 26. Moreover, the introduction of new production factors displaces inefficient ones, thereby promoting a cleaner production structure. These findings provide strong empirical support for hypothesis \(H_1\) proposed in this study.
| Variable | (1) | (2) | (3) | (4) | (5) |
| Tlcp | Tlcp | Tlcp | Tlcp | Slcp | |
| Digital | 0.9116\(^{\ast\ast\ast}\) | 1.1999\(^{\ast\ast\ast}\) | 1.2490\(^{\ast\ast\ast}\) | 1.3445\(^{\ast\ast\ast}\) | 2.2374\(^{\ast\ast\ast}\) |
| (5.8214) | (10.6356) | (10.9487) | (8.5320) | (3.3852) | |
| Pgdp | \(-\)0.0001 | \(-\)0.0137 | 0.0029 | 0.1273\(^{\ast\ast\ast}\) | |
| (\(-\)0.0135) | (\(-\)1.6007) | (0.2629) | (2.8164) | ||
| Urban | 0.6711\(^{\ast\ast}\) | \(-\)0.4614\(^{\ast\ast}\) | 1.1222\(^{\ast\ast}\) | \(-\)0.0596 | |
| (2.0379) | (\(-\)2.4195) | (2.4050) | (\(-\)0.0420) | ||
| Popul | \(-\)1.0425\(^{\ast\ast\ast}\) | \(-\)0.0751\(^{\ast\ast}\) | \(-\)1.2193\(^{\ast\ast\ast}\) | \(-\)2.8863\(^{\ast\ast\ast}\) | |
| (\(-\)4.1207) | (\(-\)2.3722) | (\(-\)3.7108) | (\(-\)2.5966) | ||
| Fdi | 0.0046 | \(-\)0.0126\(^{\ast}\) | 0.0024 | \(-\)0.0004 | |
| (0.9510) | (\(-\)1.7653) | (0.4840) | (\(-\)0.0333) | ||
| Innov | \(-\)0.0048 | 0.0030 | 0.0178 | 0.0324 | |
| (\(-\)0.2125) | (0.1778) | (0.6833) | (0.6163) | ||
| Traf | \(-\)1.6557 | \(-\)1.3564\(^{\ast\ast\ast}\) | \(-\)1.3242 | 2.1336 | |
| (\(-\)1.5118) | (\(-\)5.3596) | (\(-\)1.1537) | (0.9528) | ||
| Consum | \(-\)0.2300 | 0.3019\(^{\ast\ast}\) | \(-\)0.1890 | \(-\)2.1324\(^{\ast\ast}\) | |
| (\(-\)1.4118) | (2.2829) | (\(-\)0.7436) | (\(-\)2.1119) | ||
| Tax | \(-\)0.2008\(^{\ast\ast\ast}\) | \(-\)0.1808\(^{\ast\ast\ast}\) | \(-\)0.2051\(^{\ast\ast\ast}\) | \(-\)0.3789\(^{\ast\ast}\) | |
| (\(-\)3.4108) | (\(-\)3.4448) | (\(-\)2.8468) | (\(-\)2.4285) | ||
| Envir | \(-\)0.0031 | \(-\)0.0121 | 0.0145 | 0.1683 | |
| (\(-\)0.0503) | (\(-\)0.1440) | (0.2257) | (1.5071) | ||
| Constant | 0.2613\(^{\ast\ast\ast}\) | 10.8647\(^{\ast\ast\ast}\) | 3.0058\(^{\ast\ast\ast}\) | 11.3755\(^{\ast\ast\ast}\) | 21.8166\(^{\ast\ast\ast}\) |
| (11.4143) | (4.6549) | (8.5594) | (4.2716) | (2.9627) | |
| Province FE | Yes | Yes | No | Yes | Yes |
| Time FE | Yes | No | Yes | Yes | Yes |
| \(R^2\) | 0.8232 | 0.8384 | 0.5430 | 0.8449 | 0.8779 |
Note: \(t\)-values are in parentheses. *, **, and *** denote significance at the 10%, 5%, and 1% levels, respectively.
4.2. Robustness Results
Robustness checks are conducted by replacing both the core explanatory variable and the dependent variable. First, the digital technology innovation indicator (Digtech) was used as an alternative proxy for digitalization. As digital technological innovation underpins digitalization, higher innovation capacity reflects a more advanced level of digital development 27. Accordingly, the number of regional digital technology patent applications was employed as a proxy. Second, alternative dependent variables were constructed. Carbon emissions estimated using the apparent consumption method were used to calculate total-factor carbon productivity (Tlcp_1) and single-factor carbon productivity (Slcp_1).
Columns (1) and (2) of Table 4 show that when Digitech is used, the estimated coefficients remain significantly positive at the 1% level for both total-factor and single-factor carbon productivity. The direction and magnitude of the coefficients are consistent with the baseline results, confirming their robustness. Columns (3) and (4) present the results after replacing the dependent variables. Digitalization remains significantly positive, further reinforcing the reliability of the main findings.
| Variable | (1) | (2) | (3) | (4) |
| Tlcp | Slcp | Tlcp_1 | Slcp_1 | |
| Digtech | 1.3991\(^{\ast \ast \ast }\) | 3.0258\(^{\ast \ast \ast }\) | ||
| (6.3616) | (2.5982) | |||
| Digital | 0.4180\(^{\ast \ast }\) | 0.4314\(^{\ast \ast }\) | ||
| (2.1987) | (2.1903) | |||
| Controls variables | Yes | Yes | Yes | Yes |
| Province FE | Yes | Yes | Yes | Yes |
| Time FE | Yes | Yes | Yes | Yes |
| \(R^2\) | 0.8416 | 0.8860 | 0.4603 | 0.4334 |
4.3. Endogeneity Analysis
To address potential endogeneity concerns, instrumental variables were constructed for digitalization. Following Feng et al. 28, topographic relief was used as an instrumental variable (IV1). This choice is justified for two reasons. First, topographic relief is an exogenous geographical characteristic determined outside the economic system, satisfying the exclusion restriction.
Second, terrain conditions significantly affect the development of digital infrastructure; regions with lower topographic relief are more conducive to infrastructure construction and thus exhibit higher levels of digitalization.
Additionally, following the approach of Bartik 29, the first-order difference of digitalization (\(\Delta \textit{Digital}_{\textit{it}}\)) and its interaction with its lagged value (\(\Delta \textit{Digital}_{\textit{it}}\times \textit{Digital}_{\textit{it}-1}\)) were used as instrumental variables (\(IV2)\). These instruments are valid because past digitalization levels are unlikely to be influenced by current carbon productivity, mitigating reverse causality. Previous digital investments affect current digitalization levels, satisfying the relevance condition.
Table 5 reports the instrumental variable estimation results. The first-stage regressions show that both IV1 and IV2 are statistically significant at the 1% level, indicating strong relevance. In the second stage, the Kleibergen–Paap rk LM statistic is significant at the 1% level, confirming instrument validity. Furthermore, the Kleibergen–Paap rk Wald F statistic exceeds the 15% Stock–Yogo critical threshold, indicating that weak instruments are not a concern. After addressing endogeneity, digitalization remains positively and significantly associated with carbon productivity, further supporting the robustness of the baseline findings.
| Variable | (1) | (2) | (3) | (4) |
| Digital | Tlcp | Digital | Tlcp | |
| Digital | 4.5078\(^{\ast \ast \ast }\) | 1.2526\(^{\ast \ast \ast }\) | ||
| (3.3424) | (3.0288) | |||
| IV1 | \(-0.0942^{\ast \ast \ast }\) | |||
| (\(-\)3.0253) | ||||
| IV2 | 3.0043\(^{\ast \ast \ast }\) | |||
| (3.1356) | ||||
| KP rk LM | 10.935 | 13.738 | ||
| KP rk Wald F |
9.153 {8.96} |
9.832 {8.96} |
||
| Controls variables | Yes | Yes | Yes | Yes |
| Province FE | Yes | Yes | Yes | Yes |
| Time FE | Yes | Yes | Yes | Yes |
| \(R^2\) | 0.9503 | \(-\)0.7710 | 0.9672 | 0.2774 |
Note: The KP rk LM statistic tests the validity of the instrumental variables, whereas the KP rk Wald F statistic assesses weak instruments. [\(\cdot\)] denotes the LM test \(p\)-values, and {\(\cdot\)} represents the Stock–Yogo 15% critical threshold.
4.4. Mechanism Test
The preceding theoretical analysis suggests that digitalization improves carbon productivity through both technical and structural effects. On the one hand, digitalization accelerates the agglomeration of collaborative production factors within a region, provides resource advantages for technological integration, and facilitates the diffusion of emission-reduction technologies in the production sector. On the other hand, digitalization attracts innovative capital and talent, crowds out traditional high-energy-consuming and inefficient industries, and fosters the restructuring of the regional industrial structure. Given this, a key question arises: Can digitalization exert both technological and structural carbon reduction effects by accelerating the diffusion of emission-reduction technologies, promoting industrial upgrading, and advancing the energy transition? This section examines this question empirically.
-
(1)
Technology diffusion effect. Digitalization helps build a more interconnected knowledge-exchange network and provides valuable resources for regional development. In terms of knowledge absorption and technological integration, digitalization facilitates technology sharing and complementary learning within regional industrial collaboration. It not only enhances the technology absorption capacity of innovative actors but also accelerates the diffusion of core technologies into peripheral areas. Moreover, the “superposition effect” and “aggregation effect” of digital elements help weaken organizational boundaries during technological upgrading, break down barriers between innovation entities across regions and industrial chains, and shorten the spatiotemporal distance of technology and knowledge diffusion. The existing literature generally considers technological progress as a key driver of corporate carbon emissions reduction 30. Improved production technologies enhance efficiency and decrease energy use per unit of output. By contrast, technology diffusion broadens the application scope of low-carbon technologies, enabling their adoption across a wider range of industries and production processes 31. This study uses technology market turnover as a proxy for technology diffusion to test the mechanism linking digitalization to carbon productivity. The empirical results in Column (1) of Table 6 indicate that the coefficient of digitalization is 0.5783 and is statistically significant at the 1% level. This finding confirms that digitalization accelerates the diffusion of low-carbon technologies, expands their scope of application, and consequently improves carbon productivity across regions.
Table 6. Mechanism test results.Variable (1) (2) (3) Techdif Indust Energy Digital 0.5783\(^{\ast \ast \ast }\) 0.1247\(^{\ast }\) \(-0.1470^{\ast \ast \ast }\) (7.5355) (1.7598) (\(-\)3.2855) Controls variable Yes Yes Yes Province FE Yes Yes Yes Time FE Yes Yes Yes \(R^2\) 0.9211 0.9450 0.9046 -
(2)
Industrial restructuring effect. According to industrial structure theory, when production factors move from low- to high-productivity sectors, a “structural dividend” emerges, whereby aggregate productivity exceeds the average productivity of individual sectors 32. From the viewpoint of industrial restructuring, digitalization promotes the clustering of collaborative production factors, intensifies market competition, and drives the reallocation of resources toward more efficient industries. With the expansion of the digital economy, conventional high energy-intensive industries have been displaced, thereby accelerating the exit of low-efficiency firms. Meanwhile, digitalization promotes the formation and agglomeration of supporting industries, facilitating a shift in local industrial structures toward service-oriented and innovation-driven manufacturing. Existing research has generally identified high energy-intensive industrial structures as major contributors to carbon-intensive development 33. This study employs the share of the tertiary industry in total output to capture the industrial structure and examine its mediating role between digitalization and carbon productivity. Column (2) of Table 6 indicates that the coefficient of digitalization is 0.1247, which is significant at the 10% level. This suggests that digitalization contributes to the optimization of regional industrial structures and supports carbon emission reduction.
-
(3)
Energy decarbonization effect. The limited technical capabilities of existing energy systems are a key factor constraining the large-scale deployment of renewable energy. Compared with traditional fossil fuels, which provide stable and controllable power outputs, renewable energy sources, such as wind and solar energy, are characterized by intermittency and volatility. These characteristics not only restrict the application scope of clean energy but also increase its operational costs. Digital infrastructure and technological investments play a vital role in addressing these constraints. On the one hand, digitalization enhances the integration capacity of distributed renewable energy systems, thereby facilitating the transition from coal-dependent power systems. On the other hand, advancements in energy storage and cross-regional transmission have improved the efficiency and flexibility of clean energy utilization, significantly reducing associated costs. Moreover, intelligent monitoring systems powered by digital technologies help identify vulnerabilities in power networks and reduce energy transmission losses. For example, Dong et al. 34 demonstrated that reducing the share of coal consumption is a critical pathway for reducing carbon emissions during production.
Building on the approach of Xie and Wang 35, this study adopts the share of coal consumption as an inverse indicator of energy structure cleanliness to empirically assess whether digitalization contributes to carbon emission reduction by promoting the decarbonization of the energy system. Column (3) of Table 6 reports that the coefficient of digitalization is \(-0.1470\) and statistically significant at the 1% level, suggesting that digitalization helps reduce carbon emissions by lowering the share of coal in energy consumption.
4.5. Moderating Effect of Environmental Regulation
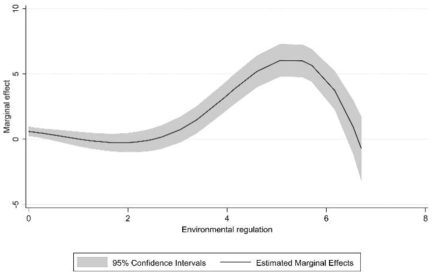
Fig. 1. Functional coefficient estimation results.
This study further incorporates environmental regulation into its framework to examine how institutional pressure influences the relationship between digitalization and carbon productivity. The effect of digitalization was modeled as an unknown function of environmental regulation, which was estimated using a partially linear functional-coefficient model with 500 bootstrap iterations.
Figure 1 shows the estimated functional coefficient, which indicates that the marginal effect of environmental regulation on the influence of digitalization on carbon productivity follows an “inverted U-shaped” pattern. When environmental regulations are low, the enhancing effect of digitalization on carbon productivity is insignificant. As environmental regulation increases, this promoting effect begins to manifest but declines after reaching a certain threshold.
This phenomenon may be explained by the fact that when environmental regulation is relatively weak, economic agents tend to prioritize short-term economic gains while neglecting environmental benefits. According to the theory of opportunity cost, in the absence of strong environmental regulations, enterprise digitalization is typically driven by goals such as improving production efficiency and reducing costs, rather than reducing carbon emissions. In some cases, digitalization may even exert a “crowding-out effect” on green investments. As environmental regulations intensify, economic agents begin to place greater emphasis on green investment and sustainable development, and environmental externalities are internalized more effectively. According to signaling theory, enterprises driven by social responsibility are more likely to incorporate green transformation into their decision-making when facing environmental regulations, such as consumers’ environmental demands, shareholders’ pressure for green investment, and government environmental policies. This leads to increased investment in carbon-reducing digital technologies. However, when environmental regulations become overly stringent, excessive intervention and pressure from the government and society may cause enterprises to focus more on compliance costs than innovative investments in digital technologies 22. This, in turn, reduces the efficiency and innovation potential of digitalization and weakens firms’ ability to independently develop low-carbon technologies.
The results of the partially linear functional-coefficient model indicate that environmental regulation exerts a nonlinear moderating effect on the link between digitalization and carbon productivity. These findings not only deepen the theoretical understanding of digitalization’s role in carbon reduction but also provide a basis for better understanding the mechanisms through which digitalization drives emission reductions.
5. Conclusions and Policy Recommendations
This study examines how digitalization influences carbon productivity, both technologically and structurally. A dynamic orthogonal projection model was constructed to measure the level of digitalization across Chinese provinces from 2011 to 2022. On this basis, fixed-effects, mediation, and partially linear functional-coefficient models are employed to empirically examine the impact of digitalization on carbon productivity and its boundary conditions. The main findings are as follows. First, digitalization significantly improves carbon productivity. This finding is consistent with the conclusions of previous literature 36. For example, Lyu et al. 37 demonstrated that digitalization within the manufacturing sector significantly advances the transition toward low-carbon development. Similarly, Zhang et al. 38 found that digital transformation contributes to a reduction in corporate carbon emissions. Second, digitalization enhances carbon productivity through three channels: technology diffusion, industrial restructuring, and energy decarbonization. According to classical environmental impact assessment models, technology and structure are the main factors shaping carbon emissions. By helping bridge the “information gap,” digitalization strengthens technology diffusion and thereby promotes carbon emission reduction 39. In addition, digital factors improve carbon productivity by facilitating the optimization of industrial structure and the adoption of cleaner energy 40. Third, under the moderating effect of environmental regulation, the relationship between digitalization and carbon productivity exhibits an “inverted U-shaped” pattern. When environmental regulations are relatively weak, the impact of digitalization on carbon productivity is insignificant. As environmental regulations strengthen, the carbon reduction effect of digitalization increases. However, once environmental regulations exceed a certain threshold, digitalization begins to suppress carbon productivity. This study offers empirical evidence supporting the relevance of the “Porter Hypothesis” in China from a digitalization perspective. It provides valuable insights into how China can leverage the synergy between digital and environmental policies.
Understanding the relationship between digitalization and carbon productivity offers valuable policy insights for China to address global climate change and achieve its “dual carbon” targets. As the foundation of digitalization, digital technological innovation plays a vital role in enabling digitalization to contribute to carbon emission reduction. Specifically:
-
(1)
Introduce targeted fiscal incentives to promote the growth of digital technology enterprises. By introducing digital innovation subsidy policies, direct financial support should be provided to high-growth technology-driven digital enterprises. For example, Research and Experimental Development (R&D) tax credits should be increased for enterprises that develop patented digital technologies with carbon-reduction effects, thereby channeling resources toward green-oriented digital solutions.
-
(2)
Foster the deep integration of digital and low-carbon technologies to unlock synergistic effects. The findings suggest that the emission-reduction potential of digitalization is maximized when coupled with advancements in low-carbon technologies. Policymakers should establish cross-sectoral innovation alliances and dedicated funding programs that support R&D projects at the intersection of AI, big data, and clean energy systems.
-
(3)
Narrow regional disparities in digital economy development by formulating region-specific digital industry development strategies, leveraging local resource endowments, and fostering distinctive regional digital economy clusters. For example, digitally advanced eastern regions should focus on breakthrough innovations and the application of frontier technologies for emission reduction. By contrast, central and western regions should prioritize the expansion of digital infrastructure.
-
(4)
Strengthen the coordination between digital and environmental policies by incorporating carbon-reduction goals into digital transformation strategies to ensure that digitalization actively promotes green and low-carbon development. This includes integrating carbon productivity targets into the evaluation systems for digital pilot projects and smart city initiatives, thereby ensuring that digitalization actively and consistently contributes to the low-carbon transition, rather than merely pursuing economic efficiency.
Acknowledgments
This study was funded by the China National Social Science Foundation (Grant No.24XJY013).
- [1] K. Yin et al., “Can the combination of urban development models promote carbon productivity? Evidence from an empirical analysis in China,” Sust. Cities Soc., Vol.114, Article No.105802, 2024. https://doi.org/10.1016/j.scs.2024.105802
- [2] Q. Zhang et al., “Digital transformation and economic growth efficiency improvement in the digital media era: Digitalization of industry or Digital industrialization?,” Int. Rev. Econ. Financ., Vol.92, pp. 667-677, 2024. https://doi.org/10.1016/j.iref.2024.02.010
- [3] T. Kopp, M. Nabernegg, and S. Lange, “The net climate effect of digitalization, differentiating between firms and households,” Energy Econ., Vol.126, Article No.106941, 2023. https://doi.org/10.1016/j.eneco.2023.106941
- [4] D. Zhou and J. Chu, “The carbon emission reduction effect of the digital economy from the perspective of biased technological progress,” J. Environ. Manage., Vol.373, Article No.123857, 2025. https://doi.org/10.1016/j.jenvman.2024.123857
- [5] L. Li et al., “Digital technology-enabled carbon-neutral management: A mechanism of supply chain digitalization in carbon performance,” Technol. Forecast. Soc. Chang., Vol.210, Article No.123834, 2025. https://doi.org/10.1016/j.techfore.2024.123834
- [6] Y. Shang et al., “Does enterprise digital transformation contribute to the carbon emission reduction? Micro-level evidence from China,” Int. Rev. Econ. Financ., Vol.86, No.7 pp. 1-13, 2023. https://doi.org/10.1016/j.iref.2023.02.019
- [7] Y. Lyu, L. Zhang, and D. Wang, “Does digital economy development reduce carbon emission intensity?,” Front. Ecol. Evol., Vol.11, Article No.1176388, 2023. https://doi.org/10.3389/fevo.2023.1176388
- [8] M. Salahuddin and K. Alam, “Internet usage, electricity consumption and economic growth in Australia: A time series evidence,” Telemat. Inform., Vol.32, No.4, pp. 862-878, 2015. https://doi.org/10.1016/j.tele.2015.04.011
- [9] I. Benedetti, G. Guarini, and T. Laureti, “Digitalization in Europe: A potential driver of energy efficiency for the twin transition policy strategy,” Socio-Econ. Plan. Sci., Vol.89, Article No.101701, 2023. https://doi.org/10.1016/j.seps.2023.101701
- [10] T. Baležentis et al., “Exploring the limits for increasing energy efficiency in the residential sector of the European Union: Insights from the rebound effect,” Energy Policy, Vol.149, Article No.112063, 2021. https://doi.org/10.1016/j.enpol.2020.112063
- [11] C. Mula, N. Zybura, and T. Hipp, “From digitalized start-up to scale-up: Opening the black box of scaling in digitalized firms towards a scaling process framework,” Technol. Forecast. Soc. Chang., Vol.202, Article No.123275, 2024. https://doi.org/10.1016/j.techfore.2024.123275
- [12] Q. Wang et al., “Digital economy and carbon dioxide emissions: Examining the role of threshold variables,” Geosci. Front., Vol.15, Article No.101644, 2024. https://doi.org/10.1016/j.gsf.2023.101644
- [13] G. M. Grossman and A. B. Krueger, “Environmental impacts of a North American Free Trade Agreement,” National Bureau of Economic Research Working Paper, Article No.3914, 1991. https://doi.org/10.3386/w3914
- [14] D. Acemoglu and P. Restrepo, “Demographics and automation,” The Review of Economic Studies, Vol.89, No.1, pp. 1-44, 2022. https://doi.org/10.1093/restud/rdab031
- [15] R. Forslid, T. Okubo, and K. H. Ulltveit-Moe, “Why are firms that export cleaner? International trade, abatement and environmental emissions,” J. Environ. Econ. Manage., Vol.91, No.9, pp. 166-183, 2018. https://doi.org/10.1016/j.jeem.2018.07.006
- [16] N. Kuosmanen, T. Kuosmanen, and T. Maczulskij, “Micro-level structural change decomposition of carbon productivity: Application to electricity generation in Finland,” Environ. Impact Assess. Rev., Vol.113, Article No.107877, 2025. https://doi.org/10.1016/j.eiar.2025.107877
- [17] Y. Yang, P. Mukhopadhaya, and Z. Yu, “How does enterprise digitalization affect corporate carbon emission in China: A firm-level study,” China Econ. Rev., Vol.88, Article No.102285, 2024. https://doi.org/10.1016/j.chieco.2024.102285
- [18] X. Shi and S. Geng, “Double-edged sword? Heterogeneous effects of digital technology on environmental regulation-driven green transformation,” J. Environ. Manage., Vol.389, Article No.125960, 2025. https://doi.org/10.1016/j.jenvman.2025.125960
- [19] Y. Hao, Y. Jiang, and S. Lv, “Can the digital economy effectively contribute to the clean energy transition? A provincial panel data analysis from China,” Environ. Innov. Soc. Trans., Vol.56, Article No.101003, 2025. https://doi.org/10.1016/j.eist.2025.101003
- [20] Y. Shen and X. Zhang, “The impact of artificial intelligence on employment: The role of virtual agglomeration,” Humanities and Social Sciences Communications, Vol.11, Article No.122, 2024. https://doi.org/10.1057/s41599-024-02647-9
- [21] Y. Li et al., “Digital economy, environmental regulations, and green economic development,” Financ. Res. Lett., Vol.75, Article No.106858, 2025. https://doi.org/10.1016/j.frl.2025.106858
- [22] Y. F. Xiao, B. L. Zhang, and H. L. Wang, “Research on the impact of environmental regulations on green technological innovation in China from the perspective of digital transformation: A threshold model approach,” Environ. Res. Commun., Vol.6, No.3, Article No.035001, 2024. https://doi.org/10.1088/2515-7620/ad2bb6
- [23] K. Du, Y. Yu, and J. Li, “Does international trade promote CO emission performance? An empirical analysis based on a partially linear functional-coefficient panel data model,” Energy Econ., Vol.92, Article No.104983, 2020. https://doi.org/10.1016/j.eneco.2020.104983
- [24] J. Li, H. Liu, and K. Du, “Does market-oriented reform increase energy rebound effect? Evidence from China’s regional development,” China Econ. Rev., Vol.56, Article No.101304, 2019. https://doi.org/10.1016/j.chieco.2019.101304
- [25] Y. An, H. Cheng, and L. Dong, “Semiparametric estimation of partially linear varying coefficient panel data models,” G. Gonzalez-rivera, R. C. Hill, and T. Lee (Eds.), “Essays in Honor of Aman Ullah,” Advances in Econometrics, Vol.36, pp. 47-65, Emerald Group Publishing Limited, 2016.
- [26] Y. Han and T. Wei, “Supply chain digitization and corporate carbon emissions: A chain mediation examination based on digital transformation and green innovation,” J. Environ. Manage., Vol.379, Article No.124825, 2025. https://doi.org/10.1016/j.jenvman.2025.124825
- [27] Y. Liu, N. Liu, and Y. Huo, “Impact of digital technology innovation on carbon emission reduction and energy rebound: Evidence from the Chinese firm level,” Energy, Vol.320, Article No.135187, 2025. https://doi.org/10.1016/j.energy.2025.135187
- [28] L. Feng et al., “Exploring the nexus between rural economic digitalization and agricultural carbon emissions: A multi-scale analysis across 1607 counties in China,” J. Environ. Manage., Vol.373, Article No.123497, 2025. https://doi.org/10.1016/j.jenvman.2024.123497
- [29] T. J. Bartik, “How do the effects of local growth on employment rates vary with initial labor market conditions?,” Upjohn Institute Working Paper, Article No.09-148, 2006. https://doi.org/10.2139/ssrn.1372814
- [30] R. Calel and A. Dechezleprêtre, “Environmental policy and directed technological change: Evidence from the European carbon market,” The Review of Economics and Statistics, Vol.98, No.1, pp. 173-191, 2016. https://doi.org/10.1162/REST_a_00470
- [31] S. Jacobsson and V. Lauber, “The politics and policy of energy system transformation-explaining the German diffusion of renewable energy technology,” Energy Policy, Vol.34, No.3, pp. 256-276, 2006. https://doi.org/10.1016/j.enpol.2004.08.029
- [32] M. Peneder, “Industrial structure and aggregate growth,” Struct. Change and Econ. Dyn., Vol.14, No.4, pp. 427-448, 2003. https://doi.org/10.1016/S0954-349X(02)00052-8
- [33] Y. Zhang et al., “The impact of economic growth, industrial structure and urbanization on carbon emission intensity in China,” Nat. Hazards, Vol.73, No.2, pp. 579-595, 2014. https://doi.org/ 10.1007/s11069-014-1091-x
- [34] F. Dong et al., “Drivers of carbon emission intensity change in China,” Resources, Conservation and Recycling, Vol.129, No.2, pp. 187-201, 2018. https://doi.org/10.1016/j.resconrec.2017.10.035
- [35] X. Xie and J. Wang, “Study on the impact of industrial digitization on carbon emissions: Evidence from China’s Logistics Industry,” Environ. Res. Commun., Vol.5, No.10, Article No.105008, 2023. https://doi.org/10.1088/2515-7620/acf918
- [36] Y. Shen and X. Zhang, “Towards a low-carbon and beautiful world: Assessing the impact of digital technology on the common benefits of pollution reduction and carbon reduction,” Environ. Monit. Assess., Vol.196, Article No.695, 2024. https://doi.org/10.1007/s10661-024-12860-3
- [37] Y. Lyu, L. Zhang, and D. Wang, “The impact of digital transformation on low-carbon development of manufacturing,” Front. Environ. Sci., Vol.11, Article No.1134882, 2023. https://doi.org/10.3389/fenvs.2023.1134882
- [38] L. Zhang, H. Wu, and Y. Shen, “Unlocking the digital dividend: How does digitalization promote corporate carbon emission reduction?,” Sustainability, Vol.17, No.16, Article No.7222, 2025. https://doi.org/10.3390/su17167222
- [39] S. Lu et al., “Absorptive capacity and the low-carbon impact of external digital and green technologies,” Technol. Soc., Vol.84, Article No.103123, 2026. https://doi.org/10.1016/j.techsoc.2025.103123
- [40] C. Huang and B. Lin, “Digital economy solutions towards carbon neutrality: The critical role of energy efficiency and energy structure transformation,” Energy, Vol.306, Article No.132524, 2024. https://doi.org/10.1016/j.energy.2024.132524
This article is published under a Creative Commons Attribution-NoDerivatives 4.0 Internationa License.