
Research Paper:
Risk Transmission and Cascade Failures in Digital Economy Industrial Networks Under Emergency Impacts
Ming Cai*
 , Yanwu Chen*,†
, Huan Luo*, Ying Lu*, Guiyuan Fu**, and Jun Pan***
, Yanwu Chen*,†
, Huan Luo*, Ying Lu*, Guiyuan Fu**, and Jun Pan***
*Institute of Quantitative Economy and Statistics, Huaqiao University
No.668 Jimei Avenue, Jimei District, Xiamen, Fujian 361021, China
†Corresponding author
**Institute of Financial Technology, Shanghai University of Finance and Economics
No.777 Guoding Road, Yangpu District, Shanghai 200433, China
***School of Business and Economics, University Purtra Malaysia
Serdang, Selangor Darul Ehsan 43400, Malaysia

With the background of emergencies and the digital economy industry as the core, this study collected data from China’s 2020 input-output table, used network analysis technology to establish digital economy industrial networks, analyzed the structural characteristics of industrial networks and their risk transmission characteristics under the impact of various emergencies by establishing cascade failure simulation models. The results indicate that (1) the digital trading industry is an intermediary industry of the overall economy, which can control the flow of more resources than other digital economic industries; (2) different emergencies, shutdown thresholds, and impact degrees have different impacts. In addition to the dual impact of supply and demand, sudden systemic financial risks cause the most significant damage at the highest risk transmission speed; (3) the transmission of industrial risks has a certain time lag, but the failure of a key industry in the industrial chain may cause all industries to cease production in a short time; and (4) the industry with a more important position in the industrial network is more destructive to the economy after being impacted. This study can provide some theoretical reference for establishing the mechanism of emergency risk prevention and resolution.
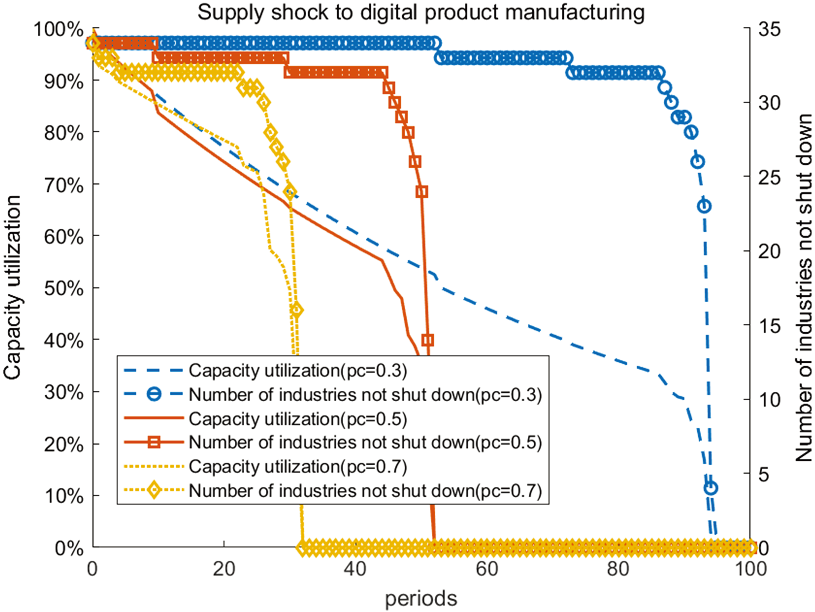
Changes of DPM after supply shocks
1. Introduction
Graph theory research applies the network paradigm to the study of industrial economics, thereby significantly enriching the contents of industrial economics. An industrial complex network refers to a network formed by regarding industries as nodes and converting the input-output (IO) relationships among them as edges. The intricate interrelationships among industries render all industries as a network system with industries as the vertices. Complex networks can not only visually depict relationships among industries but also reveal the mechanisms that lead to such complex relationships. An increasing number of scholars are studying economic systems from the perspective of complexity and networks. The depth and breadth of research on this topic are increasing.
China has established the world’s most comprehensive industrial system, characterized by deeply intertwined supply and demand linkages across sectors, forming a complex IO network. This structural configuration significantly increases the probability of risk propagation during an exogenous shock. The intricate industrial network enhances the economy’s absorptive capacity and resilience during crises and simultaneously facilitates the transition from risk sharing to risk contagion. When an individual industry experiences an uncertain shock, the negative impacts propagate through upstream and downstream dependencies, thereby transmitting disruptions to adjacent sectors. This cascading effect can progressively diffuse systemic risk throughout an industrial network, potentially threatening economic stability. Consequently, a systematic analysis of the potential economic impacts of diverse sudden events is essential for preventing and mitigating economic risks amid the complex and changing global order. This analysis provides a critical reference for the governmental formulation of targeted contingency plans tailored to different disruption scenarios. By understanding these transmission mechanisms, policymakers can develop evidence-based strategies for future economic risk governance, enhancing the economy’s capacity to withstand unforeseen challenges while maintaining stability across the interconnected industrial landscape. This forward-looking approach enables proactive, rather than reactive, crisis management.
This study focused on the digital economy industry based on several contemporary realities. First, the deepening of industrial interconnections through digital transformation means that dependencies between sectors now extend beyond physical logistics to the informational and data layers (e.g., through the industrial Internet and digital supply chains). This creates a more tightly coupled and complex network, which renders local shocks more prone to amplification. Second, core digital economy sectors, such as the digital product manufacturing (DPM) and digital trading (DT) industries, often function as critical hubs within the industrial network. Their high betweenness centrality in allocating resources, transmitting information, and integrating value makes them potential choke points. A shock to these industries can rapidly propagate through the supply, capital, and technology chains. Third, recent global events have revealed heightened risk transmission characteristics during emergencies. For instance, the COVID-19 pandemic and international trade friction have exposed the fragility of digital economy supply chains, with the global chip shortage serving as a powerful example of how a disruption in a digital core industry can propagate across seemingly unrelated sectors, such as automotive and electronics.
2. Literature Review
2.1. IO Model and Industrial Network
The IO model integrates economic theory with mathematical methodologies to elucidate the interconnections among industries and delineate relationships across sectors of the national economy. With the progressive emergence of complex networks, an increasing number of scholars have begun to apply complex network theory to IO tables, thereby characterizing the status and roles of different industries within the economic system by analyzing the industrial network topology 1. Xu and Liang employed the Weaver–Thomas index to establish thresholds, develop a strongly correlated industrial network model, and systematically classify industries while identifying key sectors and core industrial chains within this framework using metrics derived from the complex network theory 2. At the macro level, critical topological indicators such as network density, average path length, clustering coefficient, and reciprocity 3,4 can be computed and analyzed to reveal the comprehensive structural attributes and connection strengths in industrial networks. At the micro level, centrality measures, including degree centrality, intermediary centrality, proximity centrality, and PageRank centrality 5,6 are used to assess whether individual industries occupy pivotal positions within the broader industrial network.
2.2. Impact of Emergencies on the Economy
Major emergencies include natural disasters, catastrophic events, and public health incidents. Their abruptness and unpredictability can severely disrupt social stability and adversely affect the global economy. Existing research regarding impacts on economies concentrates on financial market repercussions 7, fluctuations in commodity prices 8, supply chain demand dynamics 9, alongside macroeconomic effects 10. In the analysis of these problems, methods such as the factor-augmenting VAR model and risk spillover network, phase-by-phase marginal reduction valuation regression model, TVP-VAR model, synthesis of financial conditions, and macroeconomic vulnerability index have been utilized to study the impact of emergencies on the economy.
2.3. Cascade Effect of Complex Network Risk Transmission
Existing research on risk transmission within complex economic networks during crises has predominantly focused on discrete exogenous events, often neglecting the chain reactions triggered by the endogenous structural characteristics of industrial networks. In the complex network theory, this risk transmission mechanism is primarily understood through cascading failures. Specifically, cascading failure in an industrial network refers to a phenomenon in which the initial disruption of a single node triggers a sequential breakdown of interconnected nodes. Common application of network cascade failure model in existing literature include the following: the Internet, communication network, transportation logistics network and other social and economic system networks 11, the systemic risk of financial network 12, and the risk transmission effect of regional industrial network under the impact of the epidemic 13,14.
In summary, the existing research on industrial risk transmission remains limited in terms of two key aspects. First, most studies rely on traditional IO data and linear analytical methods such as the Leontief inverse matrix, which fail to capture nonlinear and complex interactions within industrial systems. By contrast, complex network analysis offers richer topological indicators that can reveal deeper structural dynamics, including system resilience, adaptation, and recovery under shocks 15,16,17,18. Second, although the role of network centrality in risk propagation is acknowledged, the digital economy industry lacks systematic simulation research on the cascading failure mechanisms, particularly under the dual impact of supply and demand shocks stemming from major emergencies.
The digital economy underpins the real economy, and disruptions to its industrial network can have widespread economic consequences. Therefore, studying the transmission characteristics of industrial risks within the digital economy is of great practical significance for the development of national security defense in response to emerging challenges. This study addresses this gap by developing a cascading failure model tailored to digital economic industrial networks. It simulates the effects of various emergency scenarios, risk levels, and supply-side shocks, enabling enterprises and policymakers to evaluate the propagation speed of production stoppages, capacity utilization, key industries affected by production stoppage, and the time points at which the entire industrial network collapses under various risk levels, which helps to analyze the potential impact of various emergencies on the economy. These insights contribute to the prevention and mitigation of supply chain risks in an increasingly complex and volatile global order.
3. Research Design
3.1. Centrality Based on Strongest Path (SP) Matrix
3.1.1. SP Matrix
In the IO analysis, the concept of the SP is employed to identify the maximal propagation path of intermediate goods as they flow from the source to the destination industry. By tracing this optimal route through a production network, the SP metric quantifies the “maximum influence intensity” embedded within the most critical chain of industrial linkages. Derived from the IO direct consumption coefficient matrix, the SP coefficient is defined as \(q_{ij}\), which means that the department’s unit output is input through the SP into the department’s intermediate products.
The SP coefficient can be calculated to obtain the most effective path between two nodes in an industrial network. The formula for calculating the SP from sectors \(i\) to \(j\) is defined by the following equation:
3.1.2. Industry Intermediary Degree, Critical Path Intermediary Degree, and Upstream and Downstream Closeness
The industry intermediary degree (IID) is defined as the number of times the shortest path traverses the nodes between two industrial nodes in the network, capturing how indispensable an industry is in the industrial value network. The IID based on the SP matrix is calculated as follows:
The critical path intermediary degree (CPID) is defined as the sum of the value of all intermediate products through all the SPs of the critical path, reflecting the mediating role of this path in the industrial network. The CPID based on the SP matrix is calculated as follows:
Within the SP framework, the upstream closeness of a target industry is defined as its average proximity to upstream industries measured along the SPs of intermediate product transmission. This metric quantifies the target industry’s leverage over the upstream sectors. The upstream closeness based on the strongest pull matrix \(W\) is calculated as follows:
Similarly, the downstream closeness based on the strongest pull matrix \(W\) is calculated as follows:
3.1.3. Eigenvector Centrality
In network analysis, a node’s eigenvector centrality is computed as the weighted average of the centralities of its adjacent nodes based on the principal eigenvector of the adjacency matrix. In contrast to degree centrality, which only counts direct links, this metric accounts for both direct and indirect effects, thereby identifying nodes with structural influence through their connections to other influential nodes. The formula for calculating the eigenvector centrality is expressed as follows:
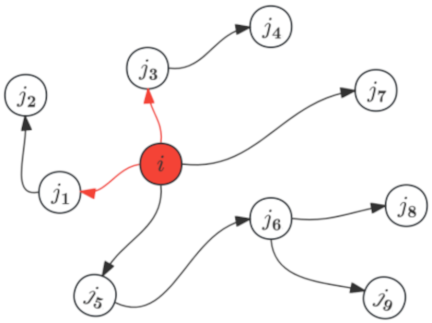
Fig. 1. Diagram the cascade failure process.
3.2. Cascading Failure Model
The risk transmission of an industrial network refers to the failure of an industry in the economic network, resulting in the failure of other adjacent nodes based on the coupling relationship. This results in a cascade failure phenomenon that triggers a large-scale industrial collapse in the economic network, reflecting the impact and diffusion of unexpected events within it. The cascade failure process is shown in Fig. 1.
An industrial cascade failure model of an economic network was developed to analyze the risk transmission process of industrial networks under various emergencies. It is divided into supply and demand sides, which are affected by unexpected events, resulting in a risk transmission effect. Detailed network simulation model settings can be found in Zhang et al. 13. In addition, to simulate the economic operation under the impact of emergencies, this study referred to Wu et al. 19 to develop a capacity utilization index (\(E\)) to quantify the degree of impact of each emergency period on the overall economy. In this study, the industrial shutdown threshold was set to 0.3.
3.2.1. Risk Transmission Path Under Supply Shock
When a key upstream industry is incapacitated by a supply shock, the supply to downstream industries is reduced or disrupted. Owing to the intimate interconnections among industries and elevated conversion costs, this shock promptly propagates to downstream industries. The risk transmission path from the critical industry node through coupled linkages with other industries can be characterized and analyzed using the network cascading failure model, which provides a robust framework for this analysis. Owing to the decline in raw material supply, the next-stage industry furnishes fewer products to other industries, and the formula is expressed as follows:
3.2.2. Risk Transmission Path under Demand Shock
When a demand shock at a key downstream industry node impedes its production, it induces a contraction or even an interruption in the demand for upstream industries. This phenomenon occurs concurrently with a reduction in the inflow of funds to upstream industries and in cost rigidity, thereby exerting a chain of effects on upstream economic activities. This risk transmission path from other industries through the coupling mechanism to the critical industry node, which can be delineated and analyzed using the network cascading failure model, is crucial for understanding and managing this risk. Owing to the decrease in raw material demand, the next-stage industry will demand fewer products from other industries, and the formula is expressed as follows:
Additionally, to simulate economic operation under the influence of unforeseen events, a capacity utilization index \(E\) is developed to quantify the degree of impact of each shock on the overall economy:
4. Empirical Results
4.1. IO Network Model
The data used in this study were derived from China’s 2020 Competitive Input-Output Table, which encompasses 153 industrial sectors. Data were processed using a systematic procedure. First, for industry classification and consolidation, we categorized the core digital economy sectors—DPM, digital product services (DPS), digital media (DM), and DT—based on the “statistical classification of digital economy and its core industries” and relevant studies. Other traditional industries were consolidated based on their economic linkages, forming a network of 34 distinct industrial nodes. Second, regarding the network construction method, we developed a direct consumption coefficient matrix. Dijkstra’s algorithm was employed to compute the SP matrix, which was then used to construct the industrial network. This network contained 1,122 edges, each representing the flow of intermediate products between industries along their strongest linkages. Finally, missing data points were supplemented using linear interpolation, and all value-based data were deflated using 2020 as the base period to eliminate the influence of price changes.
Referring to the statistical classification of digital economy and its core industries (2021), Xu and Zhang 20, and Chen et al. 21, the digital economy industry was classified, and other industries were split and merged. The collated IO table includes the following industrial sectors: (1) DPM, corresponding to 39 categories in the IO table, abbreviated as 39; (2) DPS, 63–65; (3) DM, 86, 87; (4) DT, 51, 52, 60, 66–68, 75; (5) AGR, 01–05; (6) FOS, 06, 07; (7) MET, 08–11; (8) FT,13–16; (9) TEX, 17–19; (10) WOD, 20, 21; (11) PE, 22–24; (12) PET, 25; (13) CHE, 26–28; (14) NMET, 29, 30; (15) MW, 31–33; (16) GE, 34; (17) SE, 35; (18) TE, 36, 37; (19) ELE, 38; (20) INS, 40; (21) OMG,41–43; (22) EHGW, 44–46; (23) ARC, 47–50; (24) TRA, 53–59; (25) AC, 61, 62; (26) RE, 70; (27) BSR, 71, 72; (28) ST, 73, 74; (29) WEU,76–78; (30) RRO, 80, 81; (31) EDU, 83; (32) HW, 84, 85; (33) CSR, 88–90; (34) PSO, 91 and 94. This study selected a competitive IO table for analysis for two reasons: data availability and the risk transmission among domestic industries. The impact of imports has not been discussed; therefore, reflection on the connection and risk transmission between various industries and imported goods is not required.
Based on the SP network analysis framework proposed by Xu and Liang 2, an SP network of the industry was developed, and the SP network, IID, CPID, and upstream and downstream closeness were calculated. The direct consumption coefficient was calculated and converted into an SP matrix coefficient using Dijkstra’s algorithm. This matrix describes the strongest output path of an industry with 1122 connected edges. Each connected edge represents the input and use relationships between intermediate products that can achieve the maximum value through this path. Fig. 2 shows a complex industrial network.
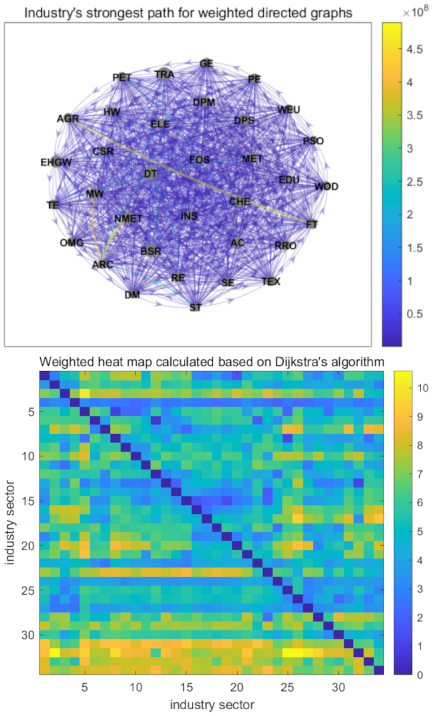
Fig. 2. SP network of digital economy industries.
Table 1 shows the IID, CPID, downstream and upstream closeness of China’s IO network, and their respective rankings. In terms of IID, DT includes the financial industry, which plays the role of resource allocation in the economy and has a high degree of industrial intermediary. Currently, DPM is not an important intermediary industry, and the products produced by DPM are rarely invested in other industries for production, reflecting that the results of investment and construction of new infrastructure have not been widely radiated to other industries, and the level of digital transformation of economic operations needs to be further improved.
| Industry abbreviation | IID | Upstream closeness | Downstream closeness | SP | CPID | |||||
| DPM | 354 | 18 | 1140 | 11 | 929 | 16 | RE \(\to\) DT | 28256 | 6 | |
| DPS | 0 | – | 1012 | 15 | 954 | 15 | DT \(\to\) ARC | 27489 | 7 | |
| DM | 0 | – | 91 | 34 | 31 | 76 | RBS \(\to\) DT | 27426 | 8 | |
| DT | 10351 | 3 | 2635 | 2 | 5550 | 1 | DT \(\to\) DPM | 8500 | 33 | |
| RBS \(\to\) DPS | 7948 | 35 | ||||||||
In the SP network, neither the DPS nor the DM acts as an intermediary industry. For the SP intermediary degree, DT’s path intermediary ranking is high, indicating that it is in a relatively core position. In contrast, the CPID of other digital economy industries is low, further indicating that DT currently plays a more important role in the digital economy industry. For upstream and downstream closeness, DT has the highest downstream closeness, whereas the upstream closeness of DT also ranks second, indicating that DT is the core industry of the macro economy, and once it is affected by unexpected events, it will have a significant impact on the upstream and downstream industries. The downstream closeness measure value of DT is higher than the upstream closeness measure value, indicating that DT has a stronger influence on the downstream industry than on the upstream industry. The upstream and downstream density measurements of DPM, DPS, and DM were all lower than the average. In terms of the degree of contribution to and status of the economy, DT is significantly higher than those of the other three industries.
From Fig. 3, we can observe that the in-degree of DPM, out-degree, and eigenvector centrality of DT are relatively high in the industrial system, ranking relatively high. A high degree of DPM indicates that it is highly dependent on the supply of raw materials or the input of intermediate products; the upstream closeness of the corresponding industry is higher, and it is more susceptible to the impact of changes in the upstream industry. A high degree of DT indicates that, as a provider of core resources, it has a strong influence on the industrial network, controlling the key path of resources flowing to other industries, and the intermediary degree and upstream and downstream closeness of the corresponding industries are high. DM and DPS are relatively weak in the digital economy and are not the central nodes of the network.
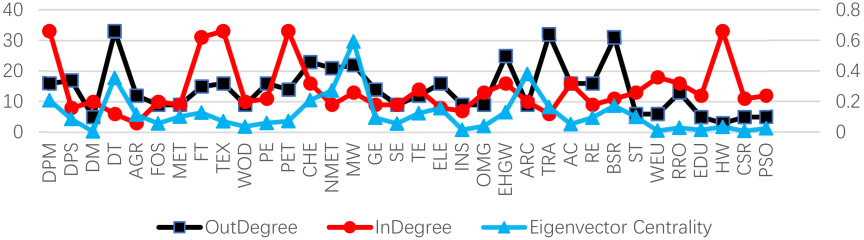
Fig. 3. Line plots of industry out-degree, in-degree, and eigenvector centrality.
Table 2 lists the eigenvector centrality of each industry. DT ranks the highest, with eigenvector centrality up to 0.355, indicating that DT gradually increased its penetration and influence on the economy with the rapid development of Internet technology, driving the growth of logistics, warehousing, information services, and other related industries and playing a significant role in promoting the transformation and upgrading of traditional industries. With the rise of DT, DPM also occupied an increasingly important position in the digital economy, with a centrality of 0.209. The industry mainly involves the manufacturing of computers, communication equipment, and electronic components, and is widely used in information technology, consumer electronics, information industrialization, and other fields. The DPM’s high-rank centrality reflects its role in supporting the modern economic structure, particularly in driving digital transformation in various industries. MW has the highest eigenvector centrality among all industries, indicating that it is closely related to other important industries and is widely used in many industries, such as construction, machine building, and transportation; therefore, these industries also have high centrality. As a basic manufacturing industry, it has significant direct and indirect impacts on production and efficiency throughout the supply chain.
| Industrial abbreviation | Eigenvector centrality |
| MW | 0.5929 |
| ARC | 0.3795 |
| DT | 0.3547 |
| NMET | 0.2724 |
| CHE | 0.2094 |
| DPM | 0.2086 |
| BSR | 0.1724 |
| TRA | 0.1645 |
| ELE | 0.1570 |
| EHGW | 0.1305 |
4.2. Industrial Network Risk Transmission Analysis
4.2.1. Simulation Scenario Setting
In line with the preceding analysis of the industrial network structure, the network characterization of the digital economy by Chen et al. 21, and considering macroeconomic realities, this study investigated the interindustry transmission of risk. The primary focus is on how economic shocks propagate following initial disruptions in the DPM, PET, DT (specifically, the financial industry), and RE sectors. The five critical incident impact scenarios were considered, as listed in Table 3.
| Major emergency | Simulated scenario | Impact industry | Impact type |
| Foreign trade protection and science and technology blockade | DPM supply impact coefficient is 50% | DPM | Supply impact |
| International political events | PET supply impact coefficient is 50% | PET | Supply impact |
| Systemic financial risk events | DT supply impact coefficient is 50% | DT | Supply impact |
| Natural disaster event | RE demand impact coefficient is 50% | RE | demand impact |
| Global public health event | DPM supply impact coefficient is 50% | DPM | Dual impact of supply and demand |
| AC demand impact coefficient is 50% | AC |
The key simulation parameters in this study were based on the following theoretical and practical justifications: The production shutdown thresholds (\(P_c\)) were set to 0.3, 0.5, and 0.7. This was informed by the “survival threshold” theory in business operations and supply chain management, which posits that when an industry’s capacity utilization falls below a critical point (typically 30%–50%), its cash flow and operational sustainability encounter severe challenges, often leading to production halts. Multiple thresholds also enable us to test how risk transmission varies under different assumptions of industrial resilience. The shock coefficient (\(\beta_0\)) was set at 0.5, 0.7, and 0.9, corresponding to a 50%, 30%, and 10% decline in supply or demand, respectively. These values were designed to simulate varying severity levels of emergencies: \(\beta_{0}=0.5\) represents a major shock such as a regional natural disaster or systemic financial risk; \(\beta_{0}=0.7\) represents a moderate shock such as local supply chain disruptions; and \(\beta_{0}=0.9\) represents a mild disturbance. Drawing on the economic research on the nonlinear relationship between shock intensity and transmission, this approach captures the dynamic characteristics of risk propagation. The simulation period (\({T=100}\)) corresponds to an economic adjustment period of approximately 2–3 years after the initial shock, based on economic cycle theory. This timeframe was sufficient for observing the full process from the initial shock trigger through its transmission to the stabilization (or collapse) of the system.
According to different types of emergencies, different emergencies were simulated to impact specific industries to study the risk transmission direction and time of the overall economic network paralysis, and to find the first industry that ceases production under different emergency scenarios. The following five emergency impact scenarios were considered, with the design of each scenario directly corresponding to different types of real-world emergencies:
Scenario 1: The supply shock to the DPM industry simulates the impact of technology blockades and trade protectionism, as observed in the recent Sino-US technological competition and supply chain decoupling efforts. The supply shock of DPM was analyzed. The supply shock of the first period was set to 50%, and the supply of the production means of the industry to other industries was reduced by half, and the impact of the decline in the supply of DPM on other industries was simulated.
Scenario 2: The supply shock to the PET industry simulates an international political event, such as a geopolitical conflict, leading to energy supply disruptions. We assumed that the product supply of PET to other industries was reduced by 50%; that is, the industry was affected by the supply shock, and the intermediate use value of the industry was reduced by half.
Scenario 3: The supply shock to the DT industry simulates the onset of systemic financial risk, modeling how financial market turmoil can be transmitted to the real economy. We set the supply shock coefficient of DT to 50%.
Scenario 4: A demand shock to the RE industry simulates a natural disaster and its impact on the real estate sector and related downstream industrial chains. The RE demand shock coefficient was set to 50%; that is, RE was affected by the demand, and the intermediate IO value of RE was reduced by half.
Scenario 5: The dual shock to DPM (supply) and AC (demand) simulates a major public health event such as the COVID-19 pandemic, which simultaneously disrupts production capacity and depresses consumer demand. We assumed that the DPM supply as a means of production to other industries was reduced by half, whereas the value of demand-affected intermediate inputs in the AC industry was also reduced by half; that is, the coefficient of the DPM supply shock was set to 50%, and the coefficient of the AC demand shock was also set at 50%. In this case, we analyzed the transmission of industrial risk under the supply shock of the DPM and the demand shock of the AC.
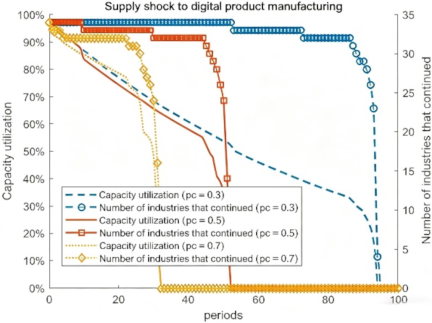
Fig. 4. Changes of DPM after supply shocks with different shutdown thresholds.
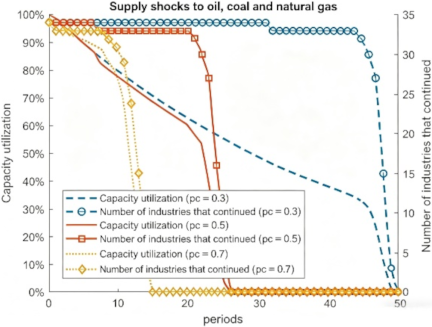
Fig. 5. Changes of PET after supply shocks with different shutdown thresholds.
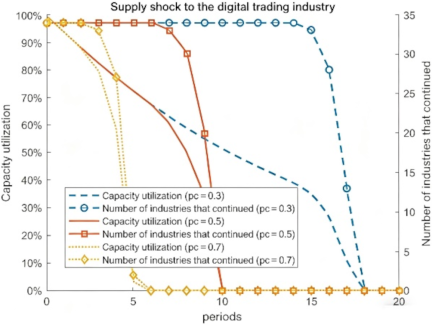
Fig. 6. Changes of DT after supply shocks with different shutdown thresholds.
4.2.2. Scenario Analysis
Based on the scenario setting and parameter design, the network cascade failure model was run to simulate the risk transmission of industries under the impact of emergencies. Figs. 4–8 show the changes in the economic production operation of various industries after the impact, where different thresholds for production shutdown are set, and impact coefficient parameters are used to simulate different levels of risk scenarios and the degree of supply impact, enabling enterprises and decision-makers to assess and compare the impacts that may be suffered under various levels of risk. The simulation periods \({{T_1}=100}\), \({{T_2}=50}\), \({{T_3}=20}\), \({{T_4}=70}\), and \({{T_5}=10}\) indicate the durations of the various shocks (the number of simulation steps). The following are the instructions for setting the step size parameter, stating how the simulation step size corresponds to real-world cycles.
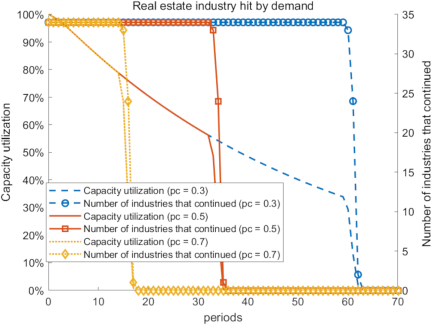
Fig. 7. Changes of RE after demand shocks with different shutdown thresholds.
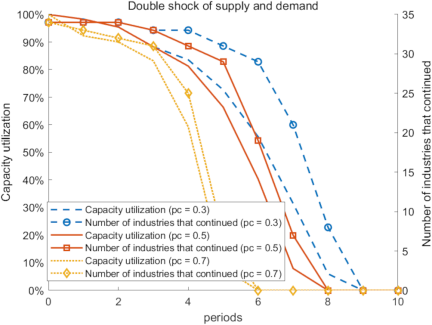
Fig. 8. Changes under dual supply-demand shocks with different shutdown thresholds.
Overall, no industry immediately suspends production after the economy is hit by an emergency, but the capacity utilization rate \(E\) gradually declines, and the \(E\) curve is always below the curve for the number of industries that have not ceased production. However, \(E\) drops significantly over time, and some industries begin to suspend production, indicating that the transmission of industrial risks has a certain time lag. Moreover, when a key industry in the industrial chain ceases production, the number of industries that have not ceased production begins to decrease sharply, suggesting that this industry holds a core position in the network and is an important channel for the supply and demand of production materials for other industries.
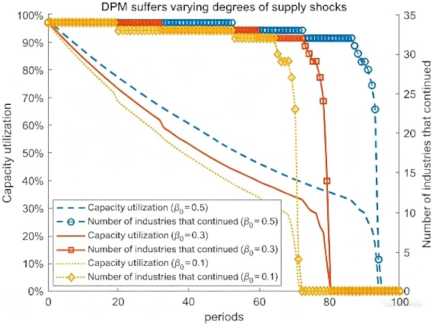
Fig. 9. Changes of DPM under varying degrees of supply shocks.
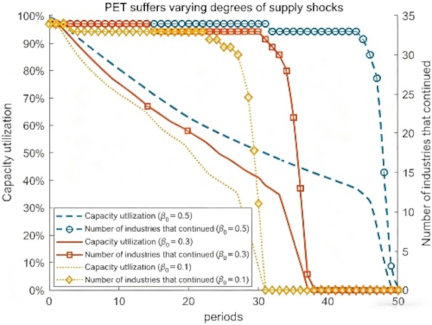
Fig. 10. Changes of PET under varying degrees of supply shocks.
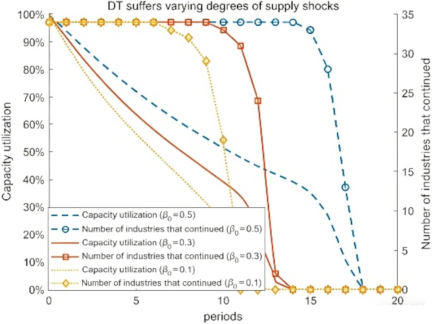
Fig. 11. Changes of DT under varying degrees of supply shocks.
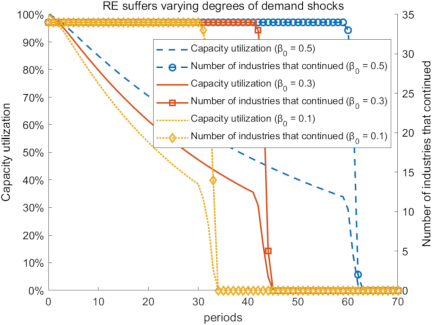
Fig. 12. Changes of RE under varying degrees of demand shocks.
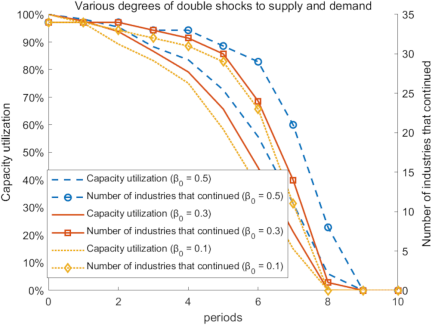
Fig. 13. Changes under varying degrees of dual supply-demand shocks.
By simulating the cascading failure impacts on the industrial network caused by different emergency scenarios, risk scenarios of various levels, and supply shocks of different magnitudes, enterprises and decision-makers can evaluate and compare the spread speed of production cessation risks, the capacity utilization rate \(E\), key industries that cease production, and the time nodes of instantaneous paralysis of the entire industrial network under various risk levels. Figs. 4–8 depict the changes in \(E\) and the number of industries that have not suspended production in the entire industrial network caused by five types of emergencies under different production shutdown thresholds (\(p_c=0.3, 0.5, 0.7\)), that is, they simulated the situations where industries start to cease production when the supply of production materials in a certain period is lower than 30%, 50%, and 70% of the initial situation. We can observe that as the production shutdown threshold increases, industries enter the production cessation state more quickly after being impacted; the \(E\) declines to zero earlier, the risk transmission speed is faster, and the impact on one industry rapidly transforms into the overall paralysis of the industrial network. Figs. 9–13 visualize the changes in \(E\) and the number of industries that have not ceased production in the entire industrial network caused by different degrees of supply shocks (\(\beta_{0}=0.5, 0.7, 0.9\)) to a certain associated industry from five types of emergencies. It simulates the situations in which the supply or demand levels of industries decline by 50%, 70%, and 90%, leading to different transmission speeds of industrial network risks. The results indicate that the greater the degree of impact, the faster the transmission speed of industrial network risks, and the easier it is for various industries to cease production in a short period.
Supplementary instructions for setting the impact parameters are provided as follows. The shock coefficient (\(\beta_0\)) was set to 0.5, 0.7, and 0.9, corresponding to a 50%, 30%, and 10% decline in supply or demand, respectively. These values were designed to simulate varying severity levels of emergencies: \(\beta_0=0.5\) represents a major shock such as a regional natural disaster or systemic financial risk; \(\beta_0=0.7\) represents a moderate shock such as local supply chain disruptions; and \(\beta_0=0.9\) represents a mild disturbance. This approach, which draws on economic research on the nonlinear relationship between shock intensity and transmission, aims to capture the dynamic characteristics of risk propagation.
We consider a threshold value of 0.3 and a shock coefficient of 0.5 as an example to simulate the previous five scenarios of the impact of emergencies. Concerning the shock in Scenario 1, the first industry ceased production in the 53rd period, followed by the second industry in the 73rd period, and then the industry ceased production continuously after the 87th period. Concerning the shock in Scenario 2, the first industry ceased production in the 32nd period, the second industry ceased production in the 45th period, and a large number of industries started to cease production until \(E\) decreases to 0. In Scenario 3, the economy ceased production completely in the 18th period. In Scenario 4, \(E\) decreased slowly during the demand shock in the real estate industry. Then, consecutive industry shutdowns occurred in the 60th period, and \(E\) showed a precipitous decline. In Scenario 5, \(E\) decreased below 30% in period 5. In period 3, the first industry was affected by a shock halt in production. After period 4, \(E\,\)declined significantly, and the number of industries halting production increased rapidly until period 6, \(E\) reduced to zero, and all industries ceased production.
4.2.3. Risk Transmission Path Analysis
According to the transmission of industrial risks in the chart, the degree of impact and risk transmission speed caused by different sudden events are not the same. The destruction and risk transmission speed caused by systemic financial risks are the fastest because the DT industry is an important intermediary industry in the economy, with a large number of businesses completed through this industry. This is followed by sudden international political events and major public health events. Although the industrial risk transmission speed caused by trade protection and technological blockades is relatively slow and no huge economic impact will occur in the short term, the risk will gradually accumulate with the continuous operation of the economy and accelerate exposure when the threshold of industrial shutdown is exceeded, leading to a rapid shutdown of a large number of industries. By observing that different industries shut down at different times, we can obtain the path of industrial risk transmission from the target industry to other industries under different scenarios by analyzing the shutdown order of each industry under a threshold of 0.3. The specific path is shown in the charts in Figs. 14–18.
As shown in Fig. 14, DPM is the first industry to cease production at the 53rd phase after the supply shock; After passing the risk to the INS, the industry ceases production at the 73rd phase because electronic information manufacturing products are important intermediate inputs for INS, and the production of the downstream INS will be subjected to the product supply of the upstream DPM; At the 87th and 88th phases, the risk is passed on to the ST and other more industries such as the DPS; At the 95th phase, the FT, TEX, PET, and MW cease production.
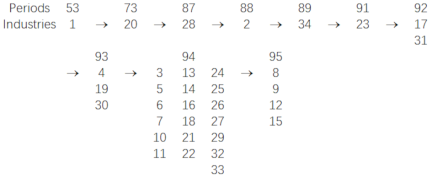
Fig. 14. Industrial risk transmission paths in PM.
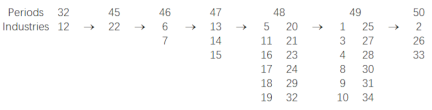
Fig. 15. Risk transmission paths in PET.
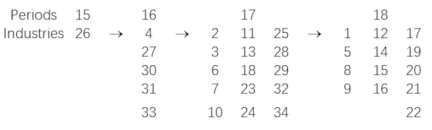
Fig. 16. Risk transmission paths in DT.
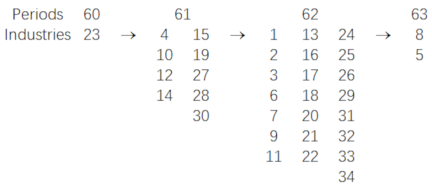
Fig. 17. Real estate risk transmission path (RE).
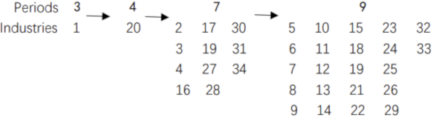
Fig. 18. Risk transmission paths under dual shocks (DPM and AC).
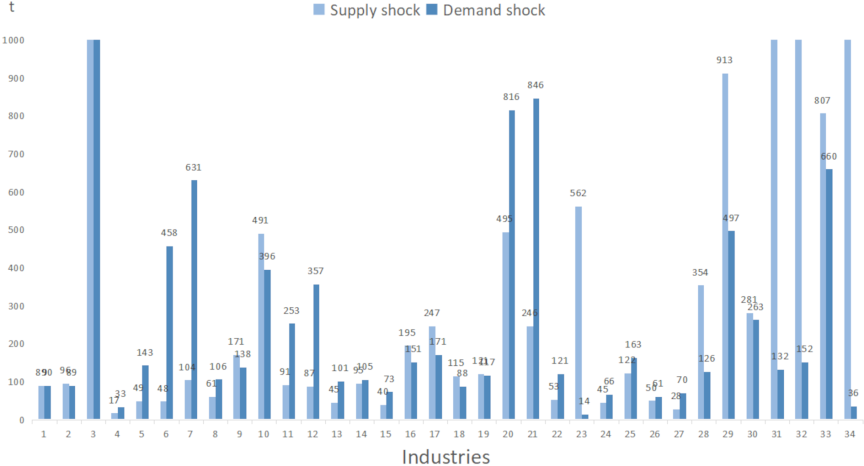
Fig. 19. Critical period of industrial supply and demand shock.
As shown in Fig. 15, PET ceases production shortly after the supply shock, followed by the spread of EHGW to other industries. EHGW is an upstream material linked to PET. China has a high demand for crude oil products, and when the external supply chain breaks, the production of downstream PET is seriously affected.
As shown in Fig. 16, the supply impact of DT causes a large number of industries to cease production in a short time, and RE is the first industry to be affected. RE development and construction require a large amount of loans from banks, and the RE cycle is long. Therefore, the capital chain of RE enterprises will go bankrupt because of the impact of the banking industry and will cease production quickly.
As shown in Fig. 17, the industrial risk transmission path during public health emergencies shows that the contraction of RE demand slows the development of RE enterprises and affects the demand of the upstream ARC.
Figure 18 shows the transmission path of the shutdown risk caused by the dual shocks of DPM supply and AC demand. We can observe that because the upstream and downstream supply and demand are affected at the same time, the output is reduced to half. Furthermore, the risk transmission speed of cascade failure industries is faster, and all industries will cease production after only six periods. After the dual impact, the DPM ceases production in the 3rd phase, and in a similar scenario, the risk is passed to the downstream industry INS. As the production of this industry is subject to the supply of production materials for the upstream DPM, it ceases production in the 4th phase. Other core digital industries cease production during the 5th phase. All types of equipment, electrical machinery, and equipment industries are affected by the cessation of the INS industry and are highly dependent on digital core industries. Global supply chain disruptions seriously affect the supply of upstream products and force industries to cease production. The demand shock from the AC intensifies in the subsequent periods. The first industries affected were related to the service sector. By period 6, the industrial risk is rapidly transmitted to more tertiary industries until all industries cease production.
We can observe that when the production capacities of various industries decline, the risk transmission within the industrial network experiences a period of mild transmission initially. During this period, only a few industries suspended their production. However, as transmission time increases, industrial risk continuously accumulates, and the number of industries halting production experiences a substantial increase at a certain juncture. The intensities of risk transmission to external industries vary by industry, which manifests as discrepant periods of malignant risk transmission under diverse scenarios. A meticulous observation of the alterations in industrial risk in each scenario reveals that when \(E\) gradually reduces to approximately 30%, industrial risk spreads rapidly throughout the entire network. Hence, with the same parameter configuration, this study adopted the critical period t, when \(E\) of a certain industry falls below 30%, as an index to contrast the systemic risks in various industries. This index reflects the degree of economic sluggishness in response to industrial risk. The smaller \(t\) is, the more expeditious the economy’s response to industrial risk and the greater the systemic risk of the industry. Fig. 19 presents the critical periods for each industry under the two shock scenarios.
4.2.4. Critical Period of Supply and Demand Shock
As shown in Fig. 19, the economy is extremely slow to respond to certain industrial risks. For instance, the risk of DM has a long-term impact on the economy from the perspectives of demand and supply. The supply and demand effects of DPM and DPS have a certain degree of impact on the economy. The supply shock of PET has a significantly faster impact on the economy than the demand shock because PET has a low demand for intermediate products from other industries and a high share of output value supplied to other industries.
Based on the analysis of industrial network structure, we can conclude that the more important industry in the industrial network is more destructive to the economy. Compared with the other three digital economy industries, DT ranks higher in the index of the major industrial network structure because the industrial risk of DT is more destructive to the economy. DM has a low mediating role in industrial networks, and its upstream and downstream closeness rank low. Therefore, the industrial risk transmission speed in this industry is considerably slower, which is consistent with the relatively modest economic output of the DMs.
5. Conclusions and Policy Suggestions
5.1. Conclusions
In summary, SP analysis was applied to study the structural characteristics of an industrial network. A cascade failure simulation model of industrial networks was further established to analyze the risk transmission situation of digital economy industries under different emergency scenarios. The conclusions are summarized as follows:
-
(1)
In the digital economy industry, DPM is not an important intermediary industry in China’s economy. DT plays a stronger role in path mediation in networks, whereas its measurement value of path mediation in other digital economy industries is low. The closeness of the upstream and downstream of DT is significantly higher than that of the other three digital economy industries, and the DM has an extremely low driving impact on the macro economy. Compared with other digital economy industries, DT has a higher position in the industrial network, playing an increasingly important role in controlling the flow of resources.
-
(2)
The degree of impact and risk transmission speed caused by different emergencies vary. Systemic financial risk is the most destructive and the fastest spread of risk, followed by sudden international political events and major public health events. The industrial risk transmission speed caused by trade protection and technological blockade is relatively slow.
-
(3)
In the process of industrial network failure, when the impact of an emergency reduces the production capacity of various industries, industrial risk transmission first experiences a moderate period during which only a few industries may cease production. However, with the extension of transmission time, industrial risks continue to accumulate, and production increases substantially over a certain period.
5.2. Policy Suggestions
Under the combined impact of multiple emergencies, strong risk confrontation and macro-control should be implemented. Our suggestions are as follows:
-
(1)
The development of DPM and DPS should be further promoted, supporting the macroeconomy in its digital transformation and balancing the output structure of digital economy industries. In addition, promoting the development of DPM and DPS will help accelerate the digital transformation of industries, avoid excessive concentration of single industrial risks, disperse potential industrial network risks, and improve the stability of industrial networks.
-
(2)
Emphasis should be placed on the ramifications of abrupt systemic financial risk events. The simulation results show that the economy is more likely to collapse under the impact of sudden systemic financial risk events and that systemic financial risks are more destructive than other emergent threats. The probability of systemic financial risks should be reduced, and financial deleveraging should continue to be promoted. A mechanism and plan should be prepared to address sudden systemic financial risks while improving prevention, early warning, and response plans for other possible emergencies. The national system should be strengthened to advance key core science and technology to mitigate potential economic risks.
-
(3)
To mitigate systemic economic disruption, a comprehensive emergency defense and resolution mechanism, with a strategic focus on the upstream and downstream industries connected to the primary sectors impacted by emergencies, must be established. Because industrial shocks are initially transmitted through these upstream and downstream industries, monitoring production activities across the supply chain is as critical as revitalizing the directly affected industries. Such measures can effectively slow the propagation of industrial risks, contain cascading effects, and resolve major economic risks.
Acknowledgments
This research is funded by the Research Center for Quantitative Economics, Huaqiao University, Xiamen, PR China.
- [1] C. Yin, “Industry complex network: Modeling and application,” Shandong University, 2012 (in Chinese).
- [2] M. Xu and S. Liang, “Input–output networks offer new insights of economic structure,” Phys. A: Stat. Mech. Appl., Vol.527, Article No.121178, 2019. https://doi.org/10.1016/j.physa.2019.121178
- [3] K. Barauskaite and A. D. M. Nguyen, “Global intersectoral production network and aggregate fluctuations,” Econ. Model., Vol.102, Article No.105577, 2021. https://doi.org/10.1016/j.econmod.2021.105577
- [4] J. Maluck and R. V. Donner, “A network of networks perspective on global trade,” PLOS One, Vol.10, No.7, Article No.e0133310, 2015. https://doi.org/10.1371/journal.pone.0133310
- [5] X. Wang et al., “Global embodied rare earths flows and the outflow paths of China’s embodied rare earths: Combining multi-regional input-output analysis with the complex network approach,” J. Clean. Prod., Vol.216, pp. 435-445, 2019. https://doi.org/10.1016/j.jclepro.2018.12.312
- [6] X. Sun, H. An, X. Guo, X. Jia, and X. Liu, “Indirect energy flow between industrial sectors in China: A complex network approach,” Energy, Vol.94, pp. 195-205, 2016. https://doi.org/10.1016/j.energy.2015.10.102
- [7] Z. Yang, Y. Chen, and P. Zhang, “Macroeconomic shock, financial risk transmission and governance response to major public emergencies,” Manag. World, Vol.36, No.5, pp. 13-35+7, 2020 (in Chinese). https://doi.org/10.19744/j.cnki.11-1235/f.2020.0067
- [8] D. Li, J. Li, and J. Ma, “An empirical study on the influence of random events at home and abroad on food price volatility in China,” Issues Agric. Econ., Vol.35, No.3, pp. 68-74+111, 2014 (in Chinese). https://doi.org/10.13246/j.cnki.iae.2014.03.012
- [9] X. Chen, X. Zhang, and C. Hu, “Timing-varying shock measurement of demand-side growth: Based on TVP-SV-VAR model,” J. Nanjing Univ. Finance Econ., Vol.2021, No.2, pp. 1-12, 2021 (in Chinese).
- [10] X. Zhang and L. Liu, “Financial risk and economic growth under the new paradigm of macro-analysis on the impact of the Covid-19 pandemic and growth at risk,” Econ. Res. J., Vol.55, No.6, pp. 4-21, 2020 (in Chinese).
- [11] J. Wu, Y. Tan, H. Deng, and Y. Chi, “Evaluating node importance considering cascading failure in complex load-networks,” J. Chin. Comput. Syst., Vol.2007, No.4, pp. 627-630, 2007 (in Chinese).
- [12] X. Huang, I. Vodenska, S. Havlin, and H. E. Stanley, “Cascading failures in bi-partite graphs: Model for systemic risk propagation,” Scientific Reports, Vol.3, Article No.1219, 2013. https://doi.org/10.1038/srep01219
- [13] X. Zhang, J. Yu, and I. Vodenska, “Modeling the impact of the COVID-19 outbreak on regional industry risk contagion,” J. Univ. Electron. Sci. Technol. China, Vol.49, No.3, pp. 415-424, 2020 (in Chinese).
- [14] X. Zhao, K. Wang, and P. He, “Major public emergencies, industrial networks, and macroeconomic risks,” Shanghai Finance, Vol.2021, No.10, pp. 12-23, 2021 (in Chinese). https://doi.org/10.13910/j.cnki.shjr.2021.10.0012
- [15] Q. Zhou, Z. Li, and Y. Zeng, “Industry risk contagion and bank credit allocation from the perspective of complex network,” J. Manag. Sci. China, Vol.25, No.2, pp. 24-46, 2022 (in Chinese). https://doi.org/10.19920/j.cnki.jmsc.2022.02.002
- [16] K. Fuji, A. Suppasri, P. Kwanchai, E. Lahcene, and F. Imamura, “Assessing future tsunami hazards from Japan trench coupling with sea level rise impact on economic risks using an input–output table,” Int. J. Disaster Risk Reduct., Vol.104, Article No.104286, 2024. https://doi.org/10.1016/j.ijdrr.2024.104286
- [17] G.-J. Wang, C. Xie, L. Zhao, and Z.-Q. Jiang, “Volatility connectedness in the Chinese banking system: Do state-owned commercial banks contribute more?,” J. Int. Financ. Mark. Inst. Money, Institutions and Money, Vol.57, pp. 205-230, 2018. https://doi.org/10.1016/j.intfin.2018.07.008
- [18] J. Khan, Y. Li, and Q. J. Mahsud, “Linkages and structural changes in the Chinese financial sector, 1996–2018: A network and input–output approach,” Struct. Change Econ. Dyn., Vol.70, pp. 33-44, 2024. https://doi.org/10.1016/j.strueco.2023.12.017
- [19] G. Wu et al., “The impact of the COVID-19 pandemic on input-output networks, risk transmission, and policy responses,” Shanghai Finance, Vol.2021, No.5, pp. 25-37, 2021 (in Chinese). https://doi.org/10.13910/j.cnki.shjr.2021.05.003
- [20] X. Xu and M. Zhang, “Research on the scale measurement of China’s digital economy—Based on the perspective of international comparison,” China Ind. Econ., Vol.2020, No.5, pp. 23-41, 2020 (in Chinese). https://doi.org/10.19581/j.cnki.ciejournal.2020.05.013
- [21] Y. Chen, H. Ding, and J. Ma, “Industrial chain map and linkage network characteristics of digital economy,” J. Adv. Comput. Intell. Intell. Inform., Vol.27, No.5, pp. 739-747, 2023. https://doi.org/10.20965/jaciii.2023.p0739
This article is published under a Creative Commons Attribution-NoDerivatives 4.0 Internationa License.