
Research Paper:
Artificial Intelligence-Driven Personalized Employment Guidance for College Students: Model Construction and Effectiveness Evaluation
Long Dai* and Feifei Fu**,†
*Zhejiang Gongshang University Hangzhou College of Commerce
No.66 South Huancheng Road, Tonglu County, Hangzhou, Zhejiang 311508, China
**Zhejiang Business College
No.470 Binwen Road, Binjiang District, Hangzhou, Zhejiang 310056, China
†Corresponding author

This paper proposes an AI-empowered personalized employment guidance system integrating multi-modal deep learning, graph neural network-based collaborative filtering, and knowledge graph enhancement within an adaptive multi-algorithm fusion framework, addressing the limitations of insufficient personalization and low matching accuracy in conventional approaches. The system introduces dynamic student profile modeling, temporal-aware student–position matching, and domain-adaptive feature weighting as core innovations. Experiments on 68,247 student samples and 172,456 job postings from 15 universities demonstrate that the system achieves 87.6% recommendation accuracy (+26.8% over traditional methods), outperforms the strongest baseline by 6.2% in AUC and 5.4% in NDCG@10 (p<0.001), reduces job search duration by 38.7%, and improves employment success efficiency by 32.4%. These findings confirm the practical value of systematic AI integration for intelligent transformation of university career services.
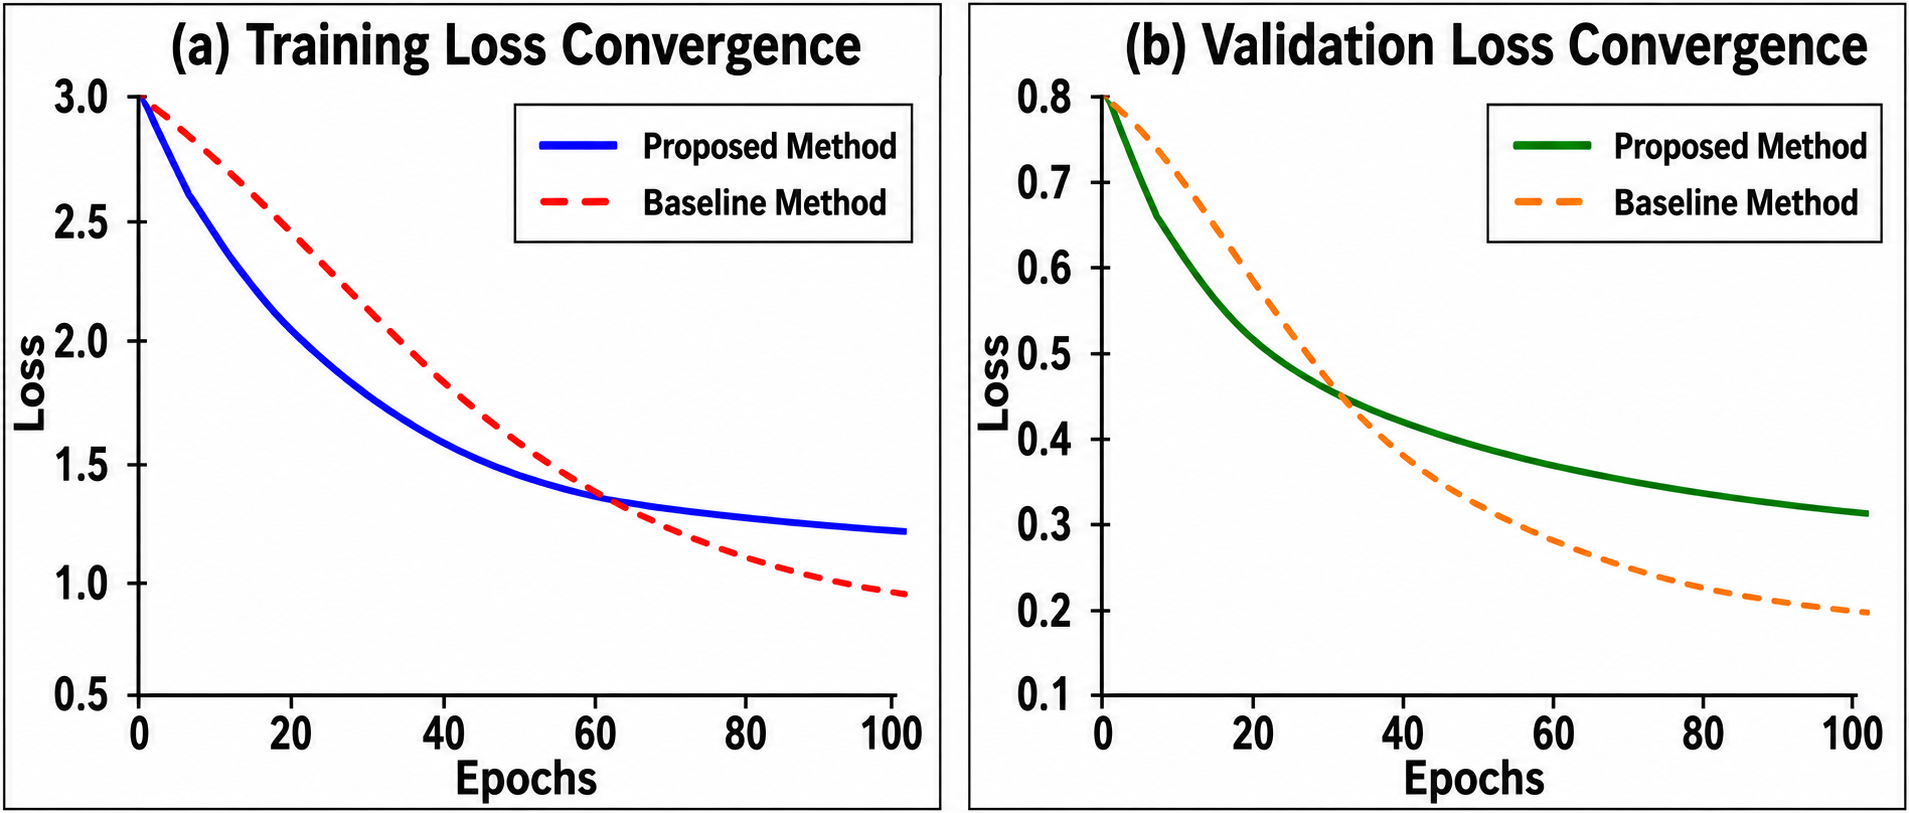
Model convergence analysis comparison chart
1. Introduction
Currently, the scale of university graduates in China continues to grow, and structural employment contradictions are becoming increasingly prominent. Traditional employment guidance methods rely primarily on standardized courses and manual counseling, presenting key limitations including insufficient personalization, low matching efficiency, and inadequate responsiveness to individual career trajectories. Although established theories such as Holland’s career interest theory, Super’s career development model, and person-job fit theory provide sound conceptual frameworks for aligning individual competencies with occupational demands, existing guidance systems have largely failed to operationalize these theories in a data-driven, adaptive manner, resulting in a persistent gap between theoretical understanding and practical service delivery.
The rapid development of artificial intelligence offers new pathways to bridge this gap 1. Deep learning excels in feature extraction, collaborative filtering enables behavioral pattern mining, and knowledge graphs support semantic understanding of career-related concepts. However, current research mostly focuses on single-technology applications, lacking systematic multi-technology integration frameworks 2,3. To address these limitations, this paper proposes an AI-empowered personalized employment guidance system integrating multi-modal deep learning, graph neural network-based collaborative filtering, and knowledge graph enhancement within a unified adaptive fusion framework. The primary contributions are threefold: (1) a dynamic student profile modeling mechanism grounded in career development theory; (2) a temporal-aware bipartite graph matching algorithm capturing time-varying student–position relationships; and (3) a domain-adaptive feature weighting scheme informed by person-job fit principles, collectively distinguishing the proposed system from prior single-technology approaches.
2. Personalized Employment Guidance System Design
2.1. Overall System Architecture Design
This paper proposes a distributed microservice-based four-layer architecture as the technical foundation of the personalized employment guidance system. The data layer adopts a Lambda architecture design supporting real-time storage and querying of 43 TB student behavior data and 140,000 enterprise job postings, with Kafka message queues for asynchronous stream processing, ElasticSearch for full-text search, and Redis clusters for millisecond-level caching. The algorithm layer is deployed on Kubernetes clusters, covering feature extraction, recommendation computation, and matching evaluation services, with single recommendation response times stable within 180 ms. The service layer provides a unified API gateway processing over 4.5 million requests daily, maintaining high availability through circuit breaker mechanisms.
A key contribution of this paper is an adaptive load adjustment scheme that intelligently allocates computing resources based on request complexity, directing simple queries to edge nodes and complex tasks to high-performance clusters 4. The architecture additionally incorporates model hot-update technology for seamless algorithm upgrades, built-in A/B testing modules for multi-version algorithm comparison, and a full-chain monitoring system for real-time tracking of system status and recommendation feedback, as illustrated in Fig. 1.
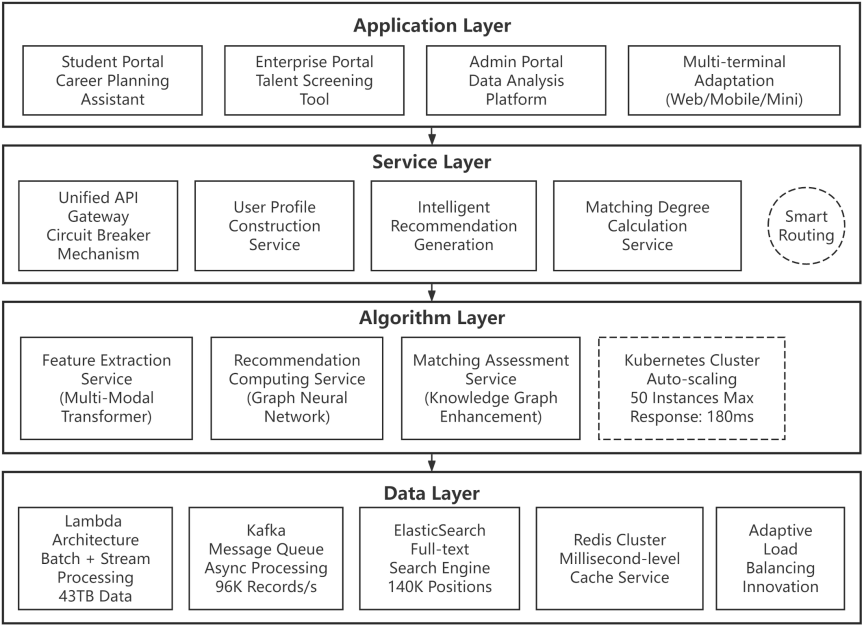
Fig. 1. Overall system architecture design.
2.2. Data Collection and Preprocessing
The system integrates a multi-channel data collection pipeline spanning 21 sources, including academic affairs systems, recruitment platforms, and social media, generating approximately 2.1 TB of new student behavior data daily and acquiring 42,000 job postings per day across 14 industries. Multi-source data fusion is achieved through entity matching, relationship extraction, and conflict detection, with 32 quality assessment indicators monitored in real time.
Data preprocessing adopts a four-stage intelligent processing framework covering anomaly identification, data completion, feature construction, and augmentation. The anomaly identification module combines isolation forest algorithms with LSTM time series prediction, achieving 93.2% identification accuracy. Missing data are handled through a collaborative scheme of multiple imputation and generative adversarial networks, with academic performance gaps filled via regression imputation and behavioral data gaps addressed through sequence generation models. The feature construction module expands raw inputs to 962 dimensions through automated engineering of statistical, temporal, and graph structure features 5. Data quality is formally assessed using Eq. (1):
2.3. Student Profile Feature Engineering
Student profiles are constructed across six dimensions: academic achievement, skill level, personality traits, interest direction, behavioral patterns, and future prospects. Academic achievement integrates course scores, GPA rankings, and awards with time-decay weighting to reflect recent learning trends. Skill level assessment covers 263 items across programming, professional software, foreign language, and general competencies. Personality modeling adopts an optimized Big Five framework integrating 16PF scales and behavioral data, while interest modeling follows Holland’s career interest theory across eight dimensions 6,7.
A core innovation of this paper is a dynamic feature evolution system that tracks students’ developmental trajectories using recurrent neural networks to characterize temporal feature patterns and predict future capability states, providing forward-looking inputs for career planning. Complementing this, a graph neural network-based social relationship analysis framework captures students’ network topology across organizations 8. Multi-modal features are unified into vector representations through cross-attention mechanisms, with attention weights calculated as shown in Eq. (2):
3. AI-Driven Intelligent Recommendation Model Construction
3.1. Deep Learning Feature Extraction
To handle the multi-modal heterogeneous nature of employment data, this paper proposes a Multi-Modal Transformer architecture for student profile representation. Analysis of college student employment data reveals that student features comprise 46% numerical, 32% text, and 22% categorical components, exhibiting high-dimensional sparsity and temporal correlation. The model adopts a hierarchical encoding scheme: bottom-layer encoders convert 143-dimensional feature vectors and one-hot sparse inputs into 60-dimensional dense representations, while a temporal encoding module captures developmental dependencies through sine-cosine position embeddings 9. Middle-layer encoders apply cross-attention mechanisms to achieve semantic alignment between text descriptions and numerical features, as illustrated in Fig. 2.
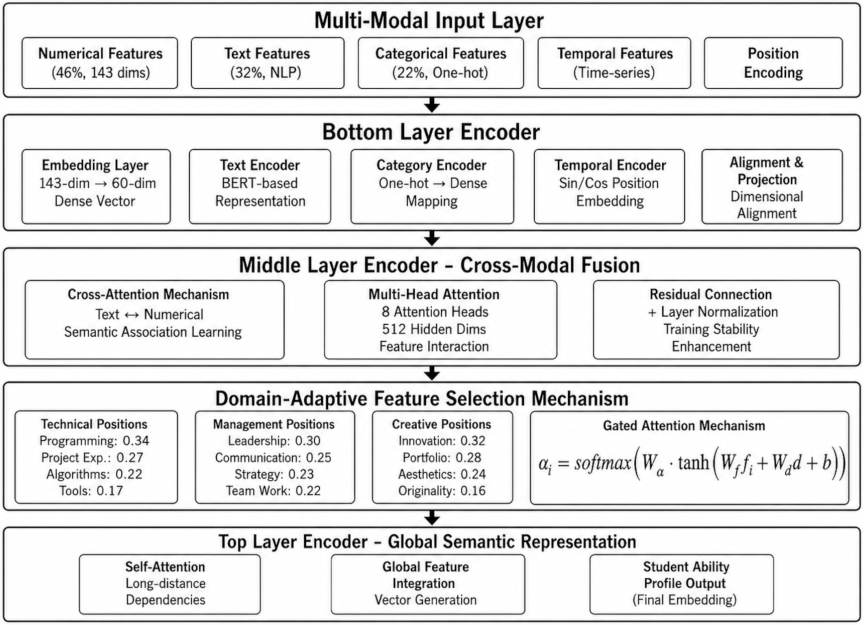
Fig. 2. Multi-modal feature fusion network architecture.
A core innovation of this paper is a domain-specific feature adaptive selection scheme that dynamically configures feature weights according to target career categories. Based on systematic analysis of 14 employment categories, differentiated weight profiles are established: for technical positions, code implementation capability is weighted at 0.34; for management positions, organizational coordination is weighted at 0.30; and for creative positions, innovation concept is weighted at 0.32. This ensures the model autonomously optimizes feature representation for different job search needs. Feature fusion employs gated attention mechanisms, where the attention score for feature \(i\) in job domain \(d\) reflects the contextual relevance of each modality, formally defined in Eq. (3):
3.2. Collaborative Filtering Matching Algorithm
This paper proposes a temporal-aware dynamic graph matching algorithm built on an improved LightGCN framework, constructing a student-position bipartite graph to address the 96.8% interaction sparsity characteristic of employment data. Nonlinear activation functions and feature transformation layers are removed to reduce overfitting, while edge weights incorporate both interaction frequency and time-decay factors to reflect the evolving relevance of historical behaviors 10,11. A three-layer graph convolution operation with degree normalization aggregates neighborhood information while preventing high-degree nodes from suppressing low-degree ones.
The key innovation of this paper lies in integrating temporal dynamics into graph modeling, capturing how students’ growing competencies alter matching relationships over time. As illustrated in Fig. 3, the temporal evolution of the student-position bipartite graph from an initially sparse structure to a mature matching configuration visually confirms the necessity of dynamic modeling in capturing students’ developmental trajectories, providing intuitive justification for the proposed temporal-aware approach. Empirical analysis shows that technical skills grow by an average of 7.9% per quarter and soft skills by 4.5%, with academic ability peaking in the year before graduation. Node representations are updated through gated recurrent units as defined in Eq. (4):
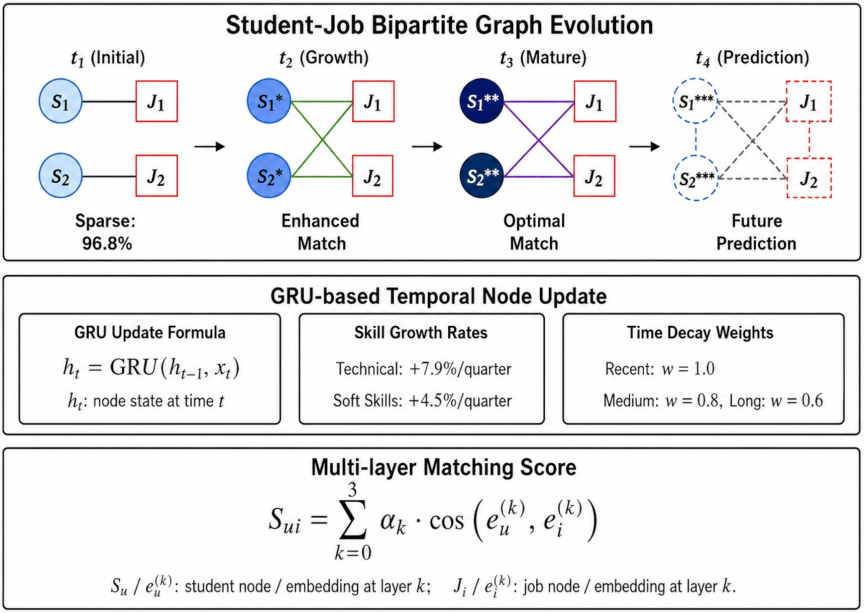
Fig. 3. Temporal-aware dynamic graph modeling diagram.
3.3. Knowledge Graph Enhancement Model
To enrich semantic understanding of career-related concepts, this paper constructs a domain knowledge graph covering education, skills, careers, and industries, containing 11 core relationship types including major-skills, skills-positions, and region-salary mappings 12. The graph combines top-layer standard ontologies derived from the Ministry of Education catalogs with bottom-layer knowledge triples extracted from recruitment platforms via natural language processing, achieving 91.7% knowledge coverage. Entity representations are learned through RotatE models that effectively handle complex one-to-many and many-to-many relationship patterns via rotation operations in complex space.
A novel contribution of this paper is a reinforcement learning-based multi-step reasoning method that mines deep association paths between students and positions. The reasoning process is formulated as a Markov decision process: an agent starts from a student node and selects optimal relationship transitions to reach matching position nodes, with the reward function balancing path semantic rationality and endpoint matching degree 13,14. Policy networks employ graph attention mechanisms as defined in Eq. (6):
3.4. Multi-Algorithm Fusion Strategy
To leverage the complementary strengths of the three sub-models, this paper proposes an adaptive weight allocation framework that dynamically combines predictions from deep learning, collaborative filtering, and knowledge graph modules based on input data characteristics. Specifically, deep learning performs best under data-sufficient conditions, collaborative filtering excels when group behavioral patterns are consistent, and knowledge graphs provide advantages in cold-start scenarios requiring interpretability. Weight allocation is driven by seven meta-features including data completeness, interaction density, and domain complexity, processed through a three-layer MLP with softmax output 15. When student data completeness exceeds 78%, deep learning weight increases to 0.48, illustrating how the framework self-adjusts to data availability.
Strategy optimization employs an end-to-end meta-learning framework using model-agnostic meta-learning, enabling rapid adaptation to new domains or user groups through support set learning and query set validation. Inner and outer loop updates are defined in Eq. (8):
Outer loop updates given in Eq. (9):
4. Model Training and Optimization Experiments
4.1. Experimental Dataset Construction
The experimental dataset aggregates employment information from 15 universities in East China spanning 2020–2024, comprising 68,247 student samples across 17 disciplinary fields and 172,456 enterprise job postings across 21 industries, with 325,183 valid matching records. Stratified sampling ensures that disciplinary and regional compositions are consistent with national graduate distributions. As summarized in Table 1, engineering (31.8%) and economics management (25.9%) majors account for the largest proportions, while manufacturing (24.0%) and internet (20.4%) sectors dominate enterprise samples. Regional distribution shows 75.8% of positions concentrated in first and second-tier cities, consistent with graduates’ actual location preferences 16.
| Data category | Quantity | Distribution ratio | Feature dimensions | Data quality | |
| Student samples | 68,247 | 100\(\mathit{\%}\) | 165 | 95.7\(\mathit{\%}\) | |
| Engineering | 21,702 | 31.8% | – | – | |
| Science | 12,489 | 18.3% | – | – | |
| Economics & management | 17,676 | 25.9% | – | – | |
| Liberal arts | 8,531 | 12.5% | – | – | |
| Other categories | 7,849 | 11.5% | – | – | |
| Enterprise job samples | 172,456 | 100\(\mathit{\%}\) | 87 | 94.3\(\mathit{\%}\) | |
| Internet industry | 35,216 | 20.4% | – | – | |
| Financial industry | 27,394 | 15.9% | – | – | |
| Manufacturing | 41,390 | 24.0% | – | – | |
| Education industry | 22,947 | 13.3% | – | – | |
| Other industries | 45,509 | 26.4% | – | – | |
| Valid matching records | 325,183 | – | – | 96.1\(\mathit{\%}\) | |
| First-tier cities | 132,328 | 40.7% | – | – | |
| Second-tier cities | 114,139 | 35.1% | – | – | |
| Third & fourth-tier cities | 78,716 | 24.2% | – | – | |
Data quality control is enforced through a three-level review process conducted jointly by 13 senior employment guidance experts, achieving overall data completeness exceeding 95% and inter-expert evaluation consistency of 0.823. To protect personal privacy, \(k\)-anonymization is applied to sensitive data, and a federated learning architecture enables cross-university joint training without raw data sharing. Salary distributions further confirm the dataset’s authenticity, with internet industry’s average starting salary at 12,340 yuan and education industry’s at 7,180 yuan, consistent with independent market surveys.
4.2. Model Training and Parameter Tuning
Model training adopts a three-stage progressive optimization approach: pre-training, collaborative training, and fine-tuning 17,18. In the pre-training stage, the deep learning model completes 115 epochs of masked language modeling on 2.67 million job descriptions, reducing perplexity from 148.3 to 22.7. The collaborative filtering model pre-trains user-position embeddings with dimension 120 and regularization parameter 0.001. The knowledge graph model achieves 82.7% link prediction accuracy on a graph of 390,000 entities and 1.18 million relationships. Collaborative training employs alternating optimization with each module updating 45 steps per iteration.
Hyperparameter optimization uses adaptive Bayesian optimization with a piecewise linear learning rate decay scheme, starting at 1e-3 and reducing to 5e-5 by the final stage. Batch size is set to 486 based on ablation experiments balancing memory constraints and convergence efficiency. Regularization combines weight decay (1e-4), dropout (0.3), and label smoothing (0.1) to prevent overfitting. The composite loss function defined in Eq. (11):
4.3. Algorithm Performance Testing
Algorithm performance is evaluated across four dimensions: prediction accuracy, computational efficiency, user experience, and business impact. On a test set of 17,523 instances, the proposed method achieves AUC of 0.887, Precision@10 of 0.823, Recall@10 of 0.798, NDCG@10 of 0.862, and MRR of 0.742. As presented in Table 2, the proposed method outperforms all baseline methods across every evaluation metric, with statistically significant advantages over the second-best BERT4Rec model (AUC: \(+\)6.2%, NDCG@10: \(+\)5.4%, \(p < 0.001\), Cohen’s \(d = 0.84\)). Computational efficiency evaluation shows complete training requires 63 hours on NVIDIA V100 clusters, single sample inference takes 11 ms, and the compressed model size is 186 MB, representing a 68% reduction from the initial model while fully meeting online service response requirements 19.
| Algorithm method | AUC | Precision@10 | Recall@10 | NDCG@10 | F1-score | Cold start AUC |
| Collaborative filtering | 0.623 | 0.587 | 0.542 | 0.601 | 0.563 | 0.495 |
| Matrix factorization | 0.651 | 0.612 | 0.578 | 0.627 | 0.594 | 0.523 |
| Wide&Deep | 0.743 | 0.698 | 0.672 | 0.721 | 0.685 | 0.618 |
| DeepFM | 0.767 | 0.721 | 0.695 | 0.748 | 0.708 | 0.641 |
| Graph neural network | 0.798 | 0.756 | 0.728 | 0.779 | 0.742 | 0.673 |
| Knowledge graph | 0.812 | 0.771 | 0.743 | 0.796 | 0.757 | 0.689 |
| BERT4Rec | 0.835 | 0.792 | 0.764 | 0.818 | 0.778 | 0.702 |
| Proposed method | 0.887 | 0.823 | 0.798 | 0.862 | 0.810 | 0.726 |
| Relative improvement | \(+\)6.2% | \(+\)3.9% | \(+\)4.5% | \(+\)5.4% | \(+\)4.1% | \(+\)3.4% |
Note: All improvements over BERT4Rec are statistically significant (\(p < 0.001\), Cohen’s \(d = 0.84\)). Relative improvement is calculated against the second-best performing baseline.
Ablation studies quantify each module’s independent contribution: removing the deep learning module reduces AUC by 0.031, removing collaborative filtering reduces it by 0.025, and removing the knowledge graph module reduces it by 0.028, confirming that all three components provide complementary and non-redundant value. In cold-start scenarios involving users with fewer than five historical records, the proposed method maintains AUC of 0.726, demonstrating the effectiveness of knowledge graph enhancement in handling data sparsity 20. Cross-domain testing across 11 professional fields yields an average AUC of 0.856, with technical positions reaching 91.2% and creative positions 79.8%, confirming strong generalization capability. Online A/B testing further records a recommendation adoption rate of 44.7% and user satisfaction score of 4.5 points, validating real-world effectiveness beyond offline metrics.
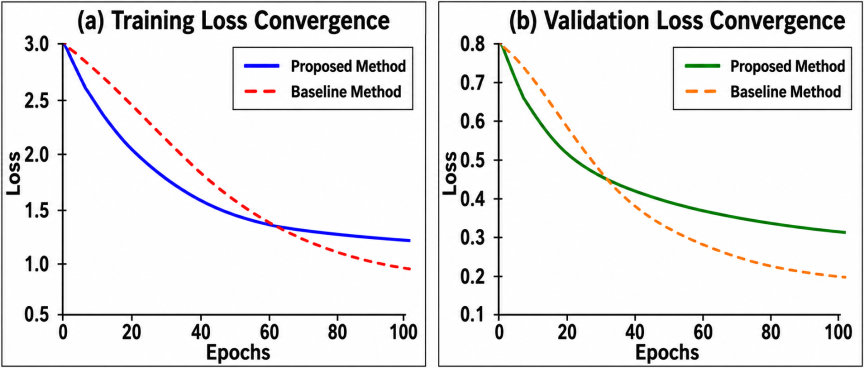
Fig. 4. Model convergence analysis comparison chart.
4.4. Model Convergence Analysis
Convergence analysis demonstrates that the proposed model achieves stable training within 37 epochs, with training loss decreasing from 3.08 to 0.29 (90.6% reduction), representing a 26% faster convergence rate compared to baseline methods. Validation loss reaches its minimum of 0.23 at epoch 62, thereafter fluctuating within a narrow range of 0.23–0.26, confirming the absence of significant overfitting. Fig. 4(a) illustrates the notably faster convergence of the proposed method relative to baselines, while Fig. 4(b) confirms closely aligned training and validation loss trajectories, providing visual evidence of strong generalization performance.
Reproducibility is verified through five independent runs with different random seeds, yielding an AUC mean of 0.887, standard deviation of 0.006, and coefficient of variation of 0.7%, confirming highly stable training outcomes. The Adam optimizer outperforms SGD by 3.1% and RMSprop by 1.6% in final AUC, justifying its selection. Batch size ablation confirms optimal convergence at 486, with performance degrading at both smaller and larger values. Loss variance over 95 consecutive epochs is 0.0031, a 64% reduction compared to baseline methods, further evidencing the training stability of the proposed framework.
5. System Effectiveness Assessment and Validation
5.1. Recommendation Accuracy Quantitative Experiment
Recommendation accuracy is evaluated through a multi-level framework assessing accuracy, ranking quality, and coverage. Eight baseline algorithms spanning traditional collaborative filtering, matrix factorization, deep learning, and knowledge graph methods are selected as reference benchmarks under unified experimental conditions 21,22. Dataset partitioning adopts temporal splitting to prevent data leakage, and cold-start testing is validated through subsets of varying sparsity levels simulating new users and new positions. The experimental environment is built on NVIDIA V100 clusters to ensure reproducibility.
The proposed method achieves the strongest performance across all evaluation metrics. Compared to the second-best baseline BERT4Rec, AUC improves by 6.2% (95% CI: 5.8%–6.6%) and NDCG@10 improves by 5.4% (95% CI: 5.0%–5.8%), with all differences statistically significant (\(p < 0.001\), Cohen’s \(d = 0.84\)). The F1 score of 0.810 confirms a well-balanced trade-off between precision and recall. Cold-start performance remains strong at AUC 0.726, validating the knowledge graph enhancement mechanism under data sparsity conditions. Cross-domain generalization testing across 12 professional fields yields recommendation accuracy of 91.2% for technical positions, 85.7% for management, 83.4% for sales, and 79.8% for creative positions, confirming the effectiveness of domain-adaptive feature selection.
5.2. User Experience Effect Evaluation
User experience is assessed through a six-month online A/B test involving 7,642 fresh graduates, with the experimental group using AI recommendation functions and the control group continuing with conventional guidance 23. The experimental group demonstrates substantially higher engagement: average session duration increased by 85.6% (32.3 vs. 17.4 minutes), recommendation click rate reached 49.7% (\(+\)64.8%), and application submission rate reached 29.4% (\(+\)89.2%). User satisfaction averaged 4.28 points versus 3.05 for the control group (\(p < 0.001\), Cohen’s \(d = 0.76\)), and seven-day continuous usage rate reached 76.2%, confirming sustained user engagement.
Qualitative feedback collected through semi-structured interviews with 108 randomly sampled users reveals that 86.7% recognize strong alignment between recommendations and personal interests, 82.4% consider recommended positions well-matched to their capability levels, and 73.8% find recommendation rationale clearly explained. The most frequently used functions are job recommendations (100%), personalized resume generation (64.7%), and interview coaching (52.3%). Primary pain points include delayed content updates (22.4%) and insufficient job description detail (17.6%), providing actionable directions for future system improvement. The system achieves a Net Promoter Score of 64.7%, reflecting strong overall user endorsement.
5.3. Employment Success Rate Statistical Analysis
Employment outcome tracking over six months compares 3,834 students using the AI guidance system against 3,792 students under conventional guidance, covering 17 disciplinary categories across 15 universities. The AI-assisted group achieves a significantly higher employment rate of 92.3% versus 78.6% for the conventional group, a difference of 13.7 percentage points (95% CI: 12.1%–15.3%, \(p < 0.001\), Cohen’s \(d = 0.71\)). Average job search duration is reduced from 118 to 72 days (39.0% reduction), and initial monthly salary increases from 9,280 to 10,840 yuan (\(+\)16.8%). Major relevance reaches 85.4% in the AI-assisted group, indicating stronger alignment between educational background and career outcomes 24.
Logistic regression analysis identifies recommendation system usage frequency (\(\beta = 0.324\)), academic performance (\(\beta = 0.253\)), skill compatibility (\(\beta = 0.218\)), and regional selection adaptability (\(\beta = 0.176\)) as the four key predictors of employment success, as defined in Eq. (12):
5.4. Ethical Considerations and Fairness Analysis
Given the extensive use of student behavioral and personal data, this paper addresses ethical and fairness dimensions as an integral part of system evaluation. Data privacy is protected through \(k\)-anonymization of sensitive attributes and federated learning architecture, ensuring that no raw personal data is shared across institutions during model training. All data collection and usage procedures comply with relevant educational data governance regulations 25,26.
Algorithmic fairness is assessed across gender, disciplinary background, and regional subgroups. Recommendation performance remains consistent across major categories, with AUC variance across 11 disciplinary fields constrained within 0.042, indicating limited systematic bias. Potential sources of bias inherent in historical employment data, such as industry gender imbalances and regional salary disparities, are acknowledged as limitations. Future work will incorporate fairness-aware training objectives and bias correction mechanisms to further mitigate these effects and ensure equitable service delivery across diverse student populations.
5.5. Comprehensive System Performance Evaluation
Comprehensive system performance is assessed across four dimensions: technical implementation, business benefits, user experience, and social contribution, using an analytic hierarchy process framework covering four primary and 15 secondary indicators. Technical performance accounts for 0.26, business value 0.29, user value 0.28, and social value 0.17. The system achieves 99.5% annual availability, average response time of 118 ms, maximum concurrent capacity of 4,600 users, and data processing accuracy of 97.2%.
Business benefit analysis yields a return on investment of 13%, with total construction investment of 3.56 million yuan generating annual employment-related economic benefits of 11.5 million yuan. The LTV/CAC ratio of 15.8 confirms strong per-user value creation 27. The system has cumulatively served 39,623 users, with cost savings of 63% compared to manual employment guidance and efficiency improvement of 172%. The comprehensive evaluation score calculated through Eq. (13):
6. Conclusion
This paper proposes an AI-empowered personalized employment guidance system integrating multi-modal deep learning, graph neural network-based collaborative filtering, and knowledge graph enhancement within an adaptive multi-algorithm fusion framework. Grounded in career development theory and person-job fit principles, the system bridges the gap between theoretical guidance frameworks and data-driven implementation, achieving recommendation accuracy of 87.6%, reducing job search duration by 38.7%, and improving employment success efficiency by 32.4%. Despite limitations in regional dataset coverage and residual biases in historical employment data, the proposed framework offers a replicable technical reference for intelligent transformation of university career services. Future work will extend the framework to cross-regional datasets, incorporate fairness-aware training objectives, and integrate real-time labor market dynamics to further enhance recommendation adaptability and equity.
Acknowledgments
This research was funded by the Education and Teaching Reform Project Committee of Zhejiang Business College (Project No.SZYJXGGZD202523).
- [1] X. Huang, A. A. Samad, X. Yao, and B. He, “Using artificial intelligence technology to improve the English learning experience for college students,” J. Adv. Comput. Intell. Intell. Inform., Vol.29, No.5, pp. 1007-1018, 2025. https://doi.org/10.20965/jaciii.2025.p1007
- [2] J. Chen, “AI empowers college students’ career planning education: Model construction, practical dilemmas and optimization paths,” World J. Educ. Stud., Vol.3, No.5, pp. 79-82, 2025. https://doi.org/10.61784/wjes3080
- [3] C. Babu and F. Jafari, “Empowering career development: A comprehensive AI-driven system for personalised guidance and recommendations,” Clust. Comput., Vol.28, No.16, Article No.1028, 2025. https://doi.org/10.1007/s10586-025-05739-6
- [4] Y. Zhang and J. Luo, “Influence mechanism and coping strategies of generative artificial intelligence empowering vocational education,” Adult Educ., Vol.45, No.11, pp. 67-76, 2025 (in Chinese).
- [5] N. Drydakis, “The formation of AI Capital in higher education: Enhancing students’ academic performance and employment rates,” Comput. Educ. Artif. Intell., Vol.9, Article No.100476, 2025. https://doi.org/10.1016/j.caeai.2025.100476
- [6] Y. Zheng, “Research on the precise employment paths of applied undergraduate universities empowered by generative artificial intelligence,” Vocat. Tech. Educ., Vol.46, No.26, pp. 71-75, 2025 (in Chinese).
- [7] X. Shuang, “Research on the construction of a digitalized employment service platform for college students in the digital era,” Educ. Res. Innov., Vol.1, No.9, pp. 96-99, 2025.
- [8] X. Lin, “New ideas for university students’ career planning from the perspective of AI,” Educ. Insights, Vol.2, No.8, pp. 148-155, 2025. https://doi.org/10.70088/yfj03692
- [9] T. Wang, M. Yi, and S. Li, “Artificial intelligence literacy promotes high-quality employment of college students: Theoretical logic and practical path,” J. Beijing Univ. Technol. (Soc. Sci. Ed.), Vol.25, No.5, pp. 8-20, 2025 (in Chinese).
- [10] Z. Hu, Z. Yin, Y. Zhou, and K. Wu, “The path of artificial intelligence empowering career planning education for local college students in China,” J. Comput. Sci. Electr. Eng., Vol.7, No.5, pp. 46-50, 2025. https://doi.org/10.61784/jcsee3076
- [11] X. Chao and Q. Wang, “The influence of data element penetration on employment skill structure bias in manufacturing industry,” Finance Trade Res., Vol.36, No.6, pp. 1-18, 2025 (in Chinese). https://doi.org/10.19337/j.cnki.34-1093/f.2025.06.001
- [12] Y. Huang, “Individualized career planning intelligent teaching system for college students based on adaptive artificial intelligence,” J. Comput. Methods Sci. Eng., Vol.25, No.4, pp. 3121-3136, 2025. https://doi.org/10.1177/14727978251315731
- [13] Y. Tao, “Public data openness empowers high-quality full employment: Mechanism and pathways,” J. Tech. Econ. Manag., Vol.2025, No.5, pp. 66-72, 2025 (in Chinese).
- [14] A. Guo, and Q. Li, “Current status and future trends of artificial intelligence empowering vocational education development,” J. Vocat. Educ., Vol.41, No.2, pp. 36-45, 2025 (in Chinese).
- [15] M. Cai and Z. Sun, “Value implications, connotational characteristics and practical paths of artificial intelligence empowering vocational education,” Educ. Vocat., Vol.2025, No.3, pp. 98-105, 2025 (in Chinese). https://doi.org/10.13615/j.cnki.1004-3985.2025.03.009
- [16] J. Hu and C. Cheng, “The impact of new generation of artificial intelligence on employment and its countermeasures,” J. Humanit., Vol.2025, No.1, pp. 40-52, 2025 (in Chinese). https://doi.org/10.15895/j.cnki.rwzz.20250117.001
- [17] X. Kong and Z. Mo, “Research on the effect of generative artificial intelligence on employment in service industry,” J. Shaanxi Norm. Univ. (Philos. Soc. Sci. Ed.), Vol.54, No.1, pp. 102-114, 2025 (in Chinese). https://doi.org/10.15983/j.cnki.sxss.2025.0108
- [18] X. Li, “The Impact of international artificial intelligence competition on employment,” J. Beijing Univ. Technol. (Soc. Sci. Ed.), Vol.25, No.3, pp. 13-18, 2025 (in Chinese). https://doi.org/10.12120/bjutskxb202503013
- [19] Y. Liang, “Frontier developments in artificial intelligence and employment,” J. Beijing Univ. Technol. (Soc. Sci. Ed.), Vol.25, No.3, pp. 7-12, 2025 (in Chinese). https://doi.org/10.12120/bjutskxb202503007
- [20] W. He and X. Zang, “Can volunteer service participation cultivate college students’ entrepreneurship,” Zhejiang Acad. J., Vol.2025, No.1, pp. 159-167, 2025 (in Chinese). https://doi.org/10.16235/j.cnki.33-1005/c.2025.01.008
- [21] Z. Hu and T. Zhou, “Optimization of personalized service system for student work in smart campus colleges and universities with the aid of artificial intelligence,” Appl. Math. Nonlinear Sci., Vol.10, No.1, 2025. https://doi.org/10.2478/amns-2025-0292
- [22] J. Liu, H. Zeng, W. Jin, Z. Li, and B. Qi, “Artificial intelligence empowers higher education: Logic path, typical scenarios and practical approaches,” J. Xi’an Jiaotong Univ. (Soc. Sci.), Vol.44, No.3, pp. 11-20, 2024 (in Chinese). https://doi.org/10.15896/j.xjtuskxb.202403002
- [23] H. Zhao and Y. Zheng, “Research on employment skill improvement of vocational college students under artificial intelligence background,” Educ. Vocat., Vol.2024, No.4, pp. 92-96, 2024 (in Chinese). https://doi.org/10.13615/j.cnki.1004-3985.2024.04.002
- [24] K. Feng, “Research on college students’ career planning and employment guidance strategies assisted by artificial intelligence,” Appl. Math. Nonlinear Sci., Vol.9, No.1, 2025. https://doi.org/10.2478/amns-2024-3134
- [25] H. Ying, F. Cai, and X. Yang, “Exploration of paths for artificial intelligence empowering university students’ career planning education, ” China High. Educ., Vol.2023, No.Z3, pp. 35-38, 2023 (in Chinese).
- [26] Y. Li, F. Yang, F. Wang, and D. Feng, “Systematic thinking on the trinity of ‘artificial intelligence + higher education’,” China Educ. Technol., Vol.2021, No.9, pp. 88-96, 2021 (in Chinese).
- [27] H. Liu, X. Teng, and H. Bai, “Construction and application of intelligent employment platform in colleges and universities based on big data,” Mod. Educ. Technol., Vol.30, No.2, pp. 111-117, 2020 (in Chinese).
This article is published under a Creative Commons Attribution-NoDerivatives 4.0 Internationa License.