
Research Paper:
Enterprise Digital Maturity Assessment Driven by Multi-Source Data: Based on the Entropy Weight Method and Skyline Algorithm
Hongqin Tang*,**
 , Yang Shen*,**,†
, and Jianping Zhu*,**
, Yang Shen*,**,†
, and Jianping Zhu*,**
*School of Management, Xiamen University
No.422 Siming South Road, Siming District, Xiamen, Fujian 361005, China
**Data Mining Research Center, Xiamen University
No.422 Siming South Road, Siming District, Xiamen, Fujian 361005, China
†Corresponding author

The rapid advancement of digitalization is reshaping multiple aspects of firms and transforming the nature of innovation and entrepreneurship. However, a mature solution to accurately measure the digitalization maturity of enterprises is lacking. To help firms better understand their digitalization competitiveness, this study examined Chinese listed companies and, drawing on publicly available multi-dimensional heterogeneous data, employed the skyline algorithm and entropy weight method to construct a scientific measure and evaluation of digitalization maturity. To assess the reliability and practical feasibility of the measurement, this study further conducted heterogeneity analyses across industries and regions in China based on the evaluation results. The findings indicated that firms with superior digitalization maturity were predominantly concentrated in industries that were highly sensitive to digital technologies, as well as in regions characterized by stronger resource endowments and more frequent knowledge exchanges. In contrast, the digital transformation of traditional industries, such as the real estate sector, and of the regions where these industries are concentrated remained relatively weak and required further strengthening. These findings provide significant implications for both policymakers and industry stakeholders.
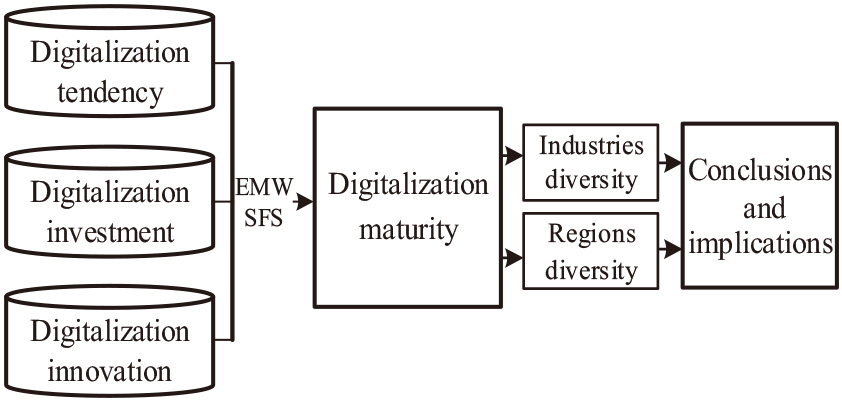
Technical framework
1. Introduction
The rapid diffusion of emerging digital technologies, including cloud computing, the Internet of Things, 5th generation mobile communication technology (5G), big data, and social media, has fundamentally reshaped virtually every aspect of enterprise operations 1. This disruptive shift has important implications for strategic and marketing management, influencing organizational collaboration, resource allocation and utilization, product design, and the ability of firms to meet increasingly complex customer requirements 2. As digitalization maturity improves, firms can reduce costs, enhance performance, strengthen independent innovation, and ultimately build competitive advantages 3,4. Greater digitalization maturity can also create additional opportunities to capture benefits from digital technologies, such as lower communication and coordination costs, that in turn support stronger innovation capabilities 5. In this context, firms have compelling incentives to undertake digital transformation and enhance their digitalization maturity.
In the digital economy, firms seeking to assess digital competitiveness must first develop a clear and reliable understanding of their digitalization maturity. However, research on digitalization maturity measurement remains limited, constraining meaningful comparisons of the digital capabilities of firms. Where measurement approaches exist, many studies rely primarily on questionnaire surveys, complicating the verification of data authenticity and reliability. Other studies use publicly available data from listed firms. However, they often capture only fragmented dimensions and therefore fail to provide a comprehensive firm-level assessment. In practice, real-world phenomena are typically characterized by multiple variables 6,7, and the same applies to the evaluation of firm digitalization. A comprehensive evaluation perspective is necessary for the results to be credible for firms and sufficiently rigorous for subsequent scholarship to build a sound quantitative foundation. When measuring the digital transformation of enterprises, many studies have employed the word frequency related to digitalization in annual reports 8,9. However, it is ineffective for measuring the actual state of digitalization.
In light of these limitations, an important question emerges regarding the manner in which enterprise digitalization maturity can be systematically and objectively measured while adequately capturing its inherently multi-dimensional nature. In particular, the manner in which strategic orientation, resource commitment, and innovation outcomes can be jointly incorporated into a coherent evaluation framework that ensures cross-firm comparability and avoids excessive reliance on single proxies or subjective weighting schemes is unclear. Clarifying this issue is essential not only for strengthening the methodological rigor of digital transformation research but also for providing firms and policymakers with reliable benchmarks for assessing digital competitiveness.
Building on the aforementioned research question, this study utilized the relevant literature and practical materials to identify appropriate attributes for measuring the digitalization maturity of firms and developed an integrated evaluation framework based on the skyline algorithm. Given the significant role played by China in the global economy 10, Chinese listed companies were selected as the empirical context to examine the practical relevance of digitalization maturity assessment. This framework enabled a more comprehensive incorporation of digitalization-related information and enhanced the scientific rigor, validity, and practical applicability of the evaluation results. Furthermore, heterogeneity analyses across industries and regions were conducted to assess the robustness of the findings and provide additional insights into the structural patterns of digital development in China.
The remainder of this paper is organized as follows: Section 2 reviews the literature on digitalization maturity and its evaluation dimensions. Section 3 presents the research design, including the methodology, technical framework, and data. Section 4 reports the empirical results and additional analyses to assess the effectiveness of the evaluation system. Section 5 concludes the paper with a discussion of the main findings and contributions of the study.
2. Literature Review
2.1. Understanding Digitalization and its implications for Measurement
Academic discussions on digitalization reflect a pluralistic understanding rather than a single universally accepted definition 11. Certain scholars conceptualize digitalization as the adoption of digital technologies to reshape interactions among firms, markets, and customers 12. Other scholars frame it more broadly as socio-technical phenomena and processes in which digital technologies are embedded across individuals, organizations, and wider social environments 13. A further strand emphasizes connectivity, describing digitalization as the increasing use of digital technologies to link people, systems, firms, products, and services, with implications that extend to the asset structures of firms 14. From this perspective, digitalization can be understood as being closely tied to digitalization-related assets owned and accumulated by firms because digital technologies constitute an important component of digital assets 15. In parallel, digital innovation has attracted sustained attention in the literature 16. Prior studies suggest that digitalization is consequential not only for invention and creation but also for transforming the manner in which firms create and capture value 17,18. Accordingly, assessing the degree of digitalization of a firm should also incorporate its outputs and innovation outcomes.
However, the foregoing discussions remain conceptually broad and do not sufficiently distinguish between digitalization, digital transformation, and digitalization maturity, although these distinctions are essential for a rigorous evaluation of digitalization maturity. Digitalization generally refers to the adoption and application of digital technologies in organizational processes and business activities 13. By contrast, digital transformation denotes a broader and more fundamental organizational change process through which firms reconfigure business models, organizational structures, and value creation mechanisms around digital technologies 19. Digitalization maturity, as examined in this study, captures the extent to which digital technology has been systematically embedded within a firm and translated into sustained capabilities and measurable outcomes 20. Whereas digitalization emphasizes technological adoption and digital transformation highlights dynamic change processes, digitalization maturity reflects the degree, depth, and effectiveness of this evolution at a given stage of development.
Synthesizing these perspectives, a common thread is that digital technology constitutes the foundational lens for evaluating the digitalization maturity of a firm. Building on this foundation, scholars typically extend the discussion toward the manner in which firms invest in and accumulate technology-related resources and assets and the manner in which these inputs translate into outputs and innovation. Following this logic, we argue that the digitalization maturity of a firm should be evaluated along three interconnected dimensions. The first dimension captures the orientation and stance of the firm toward digitalization, particularly its strategic attention to digital technologies. The second dimension focuses on the accumulation and investment of the firm in digital assets. The third dimension concerns the digitalization outputs of the firm, with a particular emphasis on digital innovation outcomes. Taken together, these three dimensions provide an integrated evaluative logic that links digitalization attitude, digital investment, and digital output into a coherent framework to measure firm-level digitalization maturity.
2.2. Attributes for Measurement Digitalization Maturity
2.2.1. Digitalization Tendency
Based on the existing research, the digitalization tendency refers to the orientation and stance of a firm toward digitalization and related initiatives. Corporate annual reports provide a systematic record of past performance and forward-looking expectations and thus offer a credible window into managerial priorities and strategic attention, including attitudes toward digitalization 21. In addition, machine learning-based text mining is well-suited for extracting and quantifying latent tendencies from unstructured textual data and has been applied to measure the digital-related orientations of firms using annual reports 22. Accordingly, we operationalize the digitalization tendency by constructing a digitalization keyword dictionary and applying text-mining procedures to annual reports to quantify the intensity of digital-related discourse.
2.2.2. Digitalization Investment
As aforementioned, digitalization investment represents an important input-side attribute for the digitalization maturity of a firm. We use digital intangible assets as a proxy for digitalization investment because they capture the sustained accumulation and resource commitment to digitalization of firms and are suitable for evaluating digitalization maturity from an investment perspective 23. We do not rely on digital-related fixed assets because they typically feature limited categories, large book values, and long depreciation cycles that may generate extreme observations and distort cross-firm comparisons. By contrast, intangible assets more closely correspond to the virtual and knowledge-based nature of digital technologies and therefore better reflect the substantive investment of firms in digitalization.
Consistent with the measurement of digitalization tendency, digitalization investment is identified through a text-mining approach based on digitalization-related keywords. Specifically, we screen itemized intangible asset entries and extract those containing digitalization-related keywords. After screening, the identified digital intangible assets are aggregated at the firm level. To enhance comparability and mitigate size-related bias, we scale the aggregated digital intangible assets by total assets to obtain a standardized measure of digitalization investment.
2.2.3. Digitalization Innovation
Digitalization innovation plays a pivotal role in evaluating the digitalization outcomes of firms because it reflects the manner in which firms transform digital-related resources into innovative outcomes, including new products, services, and business processes 24. Therefore, digitalization innovation can be included as an output-side attribute when assessing the digitalization maturity of firms.
To quantify digitalization innovation, we follow the practice of Fang et al. 25 with suitable adaptations and use digitalization-related patents as proxies. Patent outcomes reflect the realized results of sustained investment and are widely regarded as suitable indicators of innovation output 24. The patent data are collected from a database using Python-based automated crawlers. During data collection, we predefine a set of digitalization-related keywords to support the identification of relevant patents. We use the application date rather than the grant date because patent examinations and authorizations often involve substantial lags. Application-year patents can more promptly reflect the innovation activity and strategic orientation of firms within the corresponding year.
In China, patents generally fall into several categories including inventions, utility models, and industrial design. Because these patent types differ substantially in innovative value, we assign differentiated weights when constructing a composite measure. Specifically, we set the innovation value weights for invention, utility model, and industrial design patents to 0.4, 0.3, and 0.2, respectively.
Additionally, we consider a special status, invention disclosure, that refers to disclosed inventions that are publicly available and legally protected during the disclosure period but have not yet been formally granted. If subsequently granted, their innovative value corresponds to the respective granted patent types; if not granted, they typically indicate a lower innovative value and may become freely usable after the disclosure period. To reflect this uncertainty and generally lower expected value, we assign invention disclosure a weight of 0.1.
Based on the aforementioned analysis, the digitalization innovation output of a firm is computed using Eq. 1.
In Eq. 1, \(\mathit{Inno}\) refers to digitalization innovation of a company. \(w_{i}\) (\(w_{i} \in [0.1, 0.2, 0.3, 0.4]\)) denotes the weight of different patents. \(p_{i}\) denotes the number of different patent types in turn, namely invention disclosure, industrial design, patent for the utility model, and patent for invention.
3. Research Design
As aforementioned, digitalization maturity is inherently a multi-dimensional construct. Traditional linear weighted composite indices aggregate attributes into a single fully compensatory score, allowing weaknesses in one dimension to be offset by strengths in another dimension that may obscure structural heterogeneity and introduce weighting bias.
By contrast, the research design adopted in this study integrates text-based measurements with objective investment and innovation indicators within a structured multi-criteria framework. Term frequency–inverse document frequency (TF–IDF) is used to extract firm-specific digitalization signals from annual reports. This text-based measure captures only the strategic orientation dimension and does not function as a standalone proxy for overall digitalization maturity. Accordingly, digital intangible assets and digital-related patents are incorporated to reflect resource commitment and innovation outcomes, ensuring that strategic signals align with observable economic and technological activities. The entropy weight method (EWM) assigns data-driven weights based on cross-firm informational contributions, and the skyline algorithm (SKA) evaluates firms under a non-dominance principle that preserves the multi-dimensional structure and limits excessive compensability. Compared with traditional linear aggregation models, this framework enhances objectivity, reduces reliance on any single indicator, and provides a more robust evaluation of enterprise digitalization maturity.
3.1. Methodology
3.1.1. TF–IDF
TF–IDF is a widely used technique in text mining and information retrieval because it not only captures the frequency of specific terms within a document but also adjusts for their prevalence across the entire corpus, thereby reducing bias from commonly used words 26,27. In this study, TF–IDF is particularly suitable because annual reports constitute large-scale heterogeneous textual disclosures across firms, enabling us to measure the relative salience of digitalization-related keywords while ensuring comparability across companies within the same period.
TF–IDF is constructed from two components: term frequency (TF) and inverse document frequency (IDF). The TF captures the frequency of a given digitalization-related term in the annual report of a firm. The IDF reflects the relative rarity of that term across the entire corpus of annual reports. It is typically computed as the logarithm of the total number of reports divided by the number of reports containing the term. After the TF and IDF are computed, the TF–IDF weight of a specific digitalization term in a given report is obtained by multiplying the two quantities.
In Eq. 2, \(\textit{TF--IDF}_{i}\) denotes the weight of the digitalization keyword in a company report.
3.1.2. EWM
Because evaluation attributes differ substantially in scale, dispersion, and overall data structure, treating all attributes as equally informative may lead to biased or less reliable composite assessments. In the context of digitalization maturity, the three dimensions (tendency, investment, and innovation) exhibit heterogeneous variability across firms, and their discriminative power is unlikely to be uniform. To ensure a more scientific and comparable evaluation, a data-driven weighting scheme is required rather than equal or subjective weights. Therefore, the EWM is adopted to determine the attribute weights according to the amount of information that each attribute contributes to differentiating firms. Compared with subjective weighting approaches (for example, expert scoring) or dimension-reduction techniques (for example, principal component analysis), the EWM directly reflects cross-firm dispersion without imposing strong distributional assumptions or requiring a prior theoretical ranking of importance. This characteristic makes the EWM particularly suitable for the multi-source heterogeneous dataset used in this study and enhances the objectivity and robustness of the integrated digitalization maturity evaluation.
Let \(x_{ij}\) (\(i = 1, 2, \dots,n\); \(j = 1, 2, \dots, m\)) denote the observed value of the \(j\)-th digitalization attribute for the \(i\)-th firm. The EWM procedure is implemented as follows:
-
Step 1:
Assume \(x_{ij} > 0\) and \(\sum_{i=1}^{n} x_{ij} > 0\). The normalized proportion of firm \(i\) under attribute \(j\), denoted by \(p_{ij}\), is computed as follows:
\begin{equation} p_{ij} = \dfrac{x_{ij}}{\displaystyle \sum_{i=1}^{n} x_{ij}}. \label{eq:eq3} \end{equation} -
Step 2:
The entropy value of attribute \(j\), denoted by \(e_{j}\), is calculated as follows:
\begin{equation} e_{j} = -\dfrac{1}{\ln n} \sum_{i=1}^{n} p_{ij} \ln p_{ij}. \label{eq:eq4} \end{equation}Following standard practice, when \(p_{ij}=0\), we define \(p_{ij} \ln (p_{ij}) = 0\) to ensure that the entropy measure is well defined.
-
Step 3:
The entropy weight of attribute \(j\), denoted by \(w_j\), is then obtained by
\begin{equation} w_{j} = \dfrac{1 - e_{j}}{\displaystyle \sum_{j=1}^{m} \bigl(1 - e_{j}\bigr)}. \label{eq:eq5} \end{equation}
The intuition of the entropy method is that a smaller entropy value \(e_j\) indicates a greater dispersion of attribute \(j\) across firms, implying that this attribute provides more discriminative information. Consequently, it receives a larger weight \(w_j\) in composite evaluation. Using entropy-based weights \(w_j\) together with an appropriate evaluation algorithm enables a more objective assessment of the digitalization maturity of firms.
3.1.3. SKA
After determining the attribute weights using the EWM, an appropriate multi-attribute evaluation method is required to identify firms with superior digitalization maturity. The SKA, originally proposed by Chomicki et al. 28, is adopted as the evaluation tool. The skyline approach is well-suited to multi-criteria assessment because it identifies firms that are not dominated by others across the considered attributes, while remaining relatively intuitive and robust in practice 29. Unlike traditional composite scoring methods that aggregate all attributes into a single fully compensatory index, the skyline approach preserves the multi-dimensional structure of data by identifying firms that are not dominated across attributes. A firm belongs to the skyline set if no other firm performs at least as well on all attributes and is strictly better in at least one dimension. This non-dominance principle is particularly suitable for digitalization maturity assessment in which excellence in one dimension (for example, innovation output) may compensate for moderate performance in other dimensions without requiring strict linear trade-offs. By avoiding excessive compensability and retaining attribute heterogeneity, the SKA provides a more structurally consistent and robust framework for multi-criteria evaluations.
Let \(T\) denote a dataset containing \(n\) firms and \(m\) (weighted) digitalization attributes. Each firm corresponds to a point in an \(m\)-dimensional space.
-
Step 1:
Construct an evaluation dataset \(T\) by collecting the attribute values of all firms (after standardization and EWM-based weighting). Ensure that all attributes are oriented in the same direction, meaning that larger values consistently indicate a higher level of digitalization maturity.
-
Step 2:
For any two firms, \(a\) and \(b\), we say that \(a\) dominates \(b\) if \(a\) performs no worse than \(b\) on every attribute and is strictly better on at least one attribute. Formally, \(a\) dominates \(b\) if \(x_{aj} \ge x_{bj}\) for all \(j = 1, \dots, m\) and \(x_{aj} > x_{bj}\) for at least one \(j\).
-
Step 3:
Initialize a skyline set \(S_1\) as empty. For each firm \(t \in T\), compare \(t\) with the firms already included in \(S_{1}\):
-
If \(t\) is dominated by any firm in \(S_{1}\), then \(t\) is excluded.
-
If \(t\) is not dominated by any firm in \(S_{1}\), then \(t\) is added to \(S_{1}\). Any existing firm in \(S_{1}\) that is dominated by \(t\) is removed from \(S_{1}\).
Repeat this procedure until all the firms in \(T\) have been examined. Resulting set \(S_{1}\) constitutes the first-tier “excellent digitalization” skyline, containing firms that are non-dominated in the multi-attribute space.
-
-
Step 4:
To obtain multiple maturity tiers rather than only the top set, remove the first skyline, \(S_{1}\) from \(T\) and re-apply Step 3 to the remaining firms to derive the second-tier skyline, \(S_{2}\). Iterating this peeling process yields an ordered sequence of skyline layers, \(\{S_{1}, S_{2}, \dots\}\), that naturally forms a graded classification of digitalization maturity.
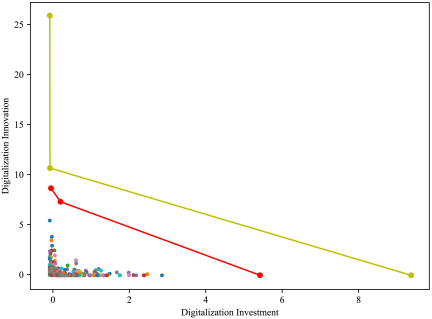
Fig. 1. Two attributes skyline of digitalization maturity.
For ease of visualization, the skyline concept is often illustrated using two attributes. Fig. 1 presents a two-dimensional example in which firms are evaluated jointly using two digitalization attributes (digitalization tendency and digitalization innovation). Firms in the first skyline layer constitute the top tier because no other firm outperforms them simultaneously on both attributes; these firms form the outer frontier in the two-dimensional space. After removing this top tier, the second skyline layer is obtained from the remaining firms and represents the next-best group whose attribute values are dominated only by firms in the first layer. Although Fig. 1 is presented in two dimensions for clarity, the same dominance rule and skyline construction extend directly to three or more attributes; this is consistent with our multi-attribute evaluation setting.
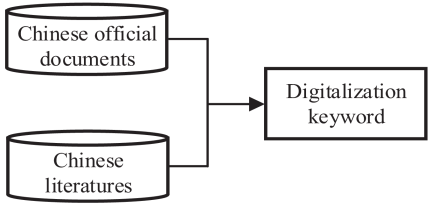
Fig. 2. Process of acquiring digitalization keywords.
3.2. Technical Framework
To evaluate the digitalization maturity of a firm, this study follows the workflow illustrated in Figs. 2–4. The framework comprises three sequential stages: (i) constructing a digitalization keyword set, (ii) quantifying firm-level digitalization attributes, and (iii) integrating these attributes to evaluate digitalization maturity and conduct subsequent heterogeneity analyses across industries and regions.
As shown in Fig. 2, constructing digitalization-related keywords is the first stage and provides the foundation for measuring the subsequent attributes. Because the empirical setting focuses on Chinese listed firms, we compile keywords by reviewing Chinese official documents and relevant academic literature 21,22,30. Following this procedure, we identify 166 digitalization-related keywords, covering terms such as “digitalization,” “Internet of Things,” and “big data,” along with other Chinese expressions that capture digital technologies and broader digitalization-related activities.
As shown in Fig. 3, the second stage quantifies the three attributes of the digitalization maturity of the firm. For clarity, Fig. 3 presents three subplots corresponding to each attribute.
First, the digitalization tendency captures the orientation of the firm toward digitalization and reflects managerial attention to digital-related initiatives. As illustrated in Fig. 3(a), we apply the TF–IDF method using the annual reports of all firms in a given year as the corpus to compute the TF–IDF weight for each digitalization keyword. The firm-level digitalization tendency measure is obtained by aggregating the TF–IDF weights of all digitalization-related terms within the annual report of the firm.
Second, digitalization investment reflects the tangible commitment of the firm to digitalization through resource accumulation. As shown in Fig. 3(b), we identify digital-related intangible asset items by screening the disclosed intangible asset entries using the established keyword set and then aggregate the selected items to form the firm-level digitalization investment measure.
Third, digitalization innovation captures the digitalization-related innovation output of the firm. As shown in Fig. 3(c), we measure this attribute using digitalization-related patents. Notably, many keywords derived in the first stage are semantically overlapping. Using the full keyword list in automated patent crawling may substantially increase the computational burden and reduce the crawling efficiency. Therefore, to balance coverage and feasibility, we refine the keyword list into a smaller set of representative subject terms, including “digitalization,” “ICT,” “intelligence,” and “Internet of Things,” together with 14 additional core terms, to retrieve digitalization-related patents from the database. Then, the firm-level digitalization innovation score is calculated according to Eq. 1 that integrates different patent types, as specified earlier.
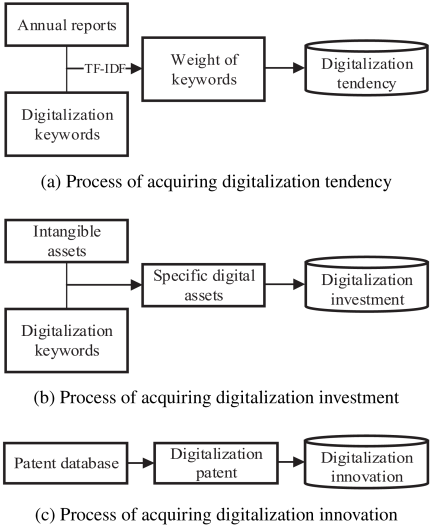
Fig. 3. Process of acquiring three digitalization attributes.
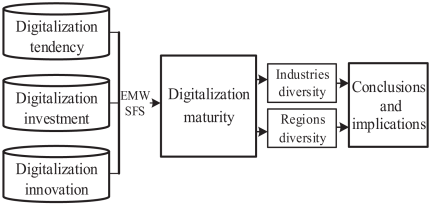
Fig. 4. Technical framework.
As shown in Fig. 4, after the three attributes are quantified, they are integrated to evaluate the digitalization maturity of the firm using the EWM and SKA. Specifically, the EWM is used to assign data-driven weights to the attributes, and the SKA is employed to identify the firms with superior multi-attribute digitalization profiles and construct maturity levels. By combining the text-based indicator of strategic orientation with the objective measures of digital investment and innovation output, the evaluation framework aligns the disclosed intentions with observable economic and technological activities, thereby enhancing the overall validity and credibility of the maturity assessment. Based on the resulting maturity classification, heterogeneity analyses are conducted by industry and region to examine the differences in digitalization maturity across groups and derive managerial and policy implications. Industry classification follows the Guidelines for the Industry Classification of Listed Companies issued by the China Securities Regulatory Commission in 2012 31. The regional classification adopts the Division Method of East, West, Central, and Northeast Regions published by the National Bureau of Statistics of China 31.
3.3. Data Sources and Preprocessing
The data used to quantify the digitalization tendency of firms are extracted from corporate annual reports collected from CNINFO (Juchao Information Network), the information disclosure platform designated by the China Securities Regulatory Commission for listed firms. The data on intangible assets used to measure digitalization investment are obtained from the CSMAR database, a widely used Chinese financial and economic database known for its broad coverage and data accuracy. The patent data used to measure digitalization innovation are collected from the China National Knowledge Infrastructure (CNKI), one of the most frequently used databases for Chinese academic and technological information.
To ensure comparability across attributes, we align the measurement windows of annual reports, intangible assets, and patents within the same accounting period. Accordingly, all three digitalization attributes are measured for year 2024. Additionally, to maintain consistency in the disclosure rules and market environments, we restrict the sample to firms listed in the A-share market of China. Applying these criteria yields a final sample of 3,454 Chinese listed firms, that forms the basis for the subsequent analyses.
4. Analysis and Results
4.1. Quantification of Digitalization Attributes and EWM Results
Following the quantification procedures described earlier, we obtained firm-level measures for the three digitalization attributes. Panel (a) of Table 1 presents the distribution of the quantified attributes. The three attributes exhibited noticeably different scales and dispersion patterns, indicating a heterogeneous data structure. Consequently, directly applying the SKA to the raw quantified attributes might lead to an unbalanced comparison because attributes with larger dispersion could disproportionately influence the evaluation.
To address this issue, we applied the EWM to derive data-driven weights and place the attributes on a comparable basis for an integrated evaluation. Notably, the EWM procedure used in this study included a standardization step; therefore, an additional separate normalization (such as a standalone Z-score transformation) was not required.
Table 1. Summary statistics of digitalization attributes before and after applying the entropy weight method.
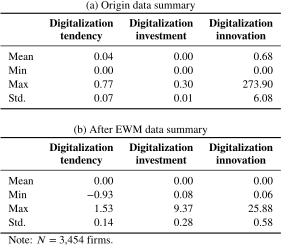
As presented in Panel (b) of Table 1, the entropy-based weights were 0.14 for digitalization tendency, 0.28 for digitalization investment, and 0.58 for digitalization innovation. The relatively large weight assigned to digitalization innovation indicated that this attribute displayed greater cross-firm variation and thus carried more discriminative information in the entropy framework. From an information-theoretic perspective, attributes with higher variability contribute more information to differentiating firms and therefore receive larger entropy weights.
4.2. Evaluation Results of Digitalization Maturity
After applying the EWM, we used the SKA to evaluate firm digitalization maturity. Based on the three weighted attributes and the full sample of 3,454 A-share listed firms, the SKA procedure partitioned the firms into 211 skyline layers. For ease of presentation and interpretation, we relabeled the top three layers as Grades A, B, and C, with subsequent layers labeled in descending order.
To present the top-performing firms, Table 2 presents the firm names and stock codes for the first three grades (A–C). Fig. 5 visualizes the skyline frontiers corresponding to these three grades in the three-attribute space. Specifically, the surface representing Grade A denotes the first (best) skyline layer, followed by the surfaces representing Grades B and C that correspond to the second and third skyline layers, respectively. Because plotting all 211 layers would severely reduce readability, we displayed only the first three skyline surfaces and represented the remaining lower layers using scatter points.
Table 2. Companies owned severally by Grades A to C.
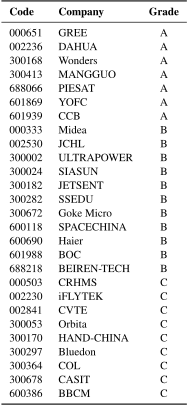
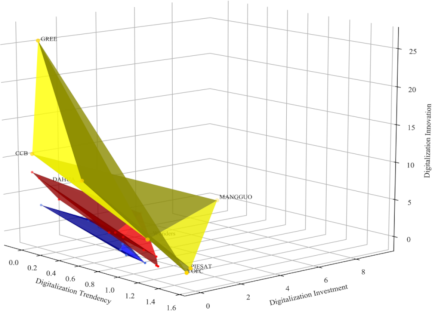
Fig. 5. Evaluation results of the digitalization maturity of companies.
Firms in Grade A represented those with the strongest overall multi-attribute digitalization profiles. Examples included Gree Electric Appliances Inc. of Zhuhai (000651) and Zhejiang Dahua Technology Co., Ltd. (002236). Firms in Grade B formed the next-best skyline layer, indicating that they were dominated only by firms in Grade A under the skyline dominance rule. Representative firms included Midea Group Co., Ltd. (000333) and JC Finance and Tax Interconnect Holdings Ltd. (002530). Similarly, Grade C constituted the third skyline layer and includes firms such as China Reform Health Management and Services Group Co., Ltd. (000503) and iFLYTEK (002230). In short, Grades A–C captured the highest tiers of digitalization maturity under the skyline framework, with each lower grade reflecting a weaker multi-attribute profile relative to higher grades.
Further examination of the top layers revealed several patterns. First, firms in Grade A tended to exhibit strong performance in digitalization tendency and digitalization innovation, whereas their digitalization investment was not necessarily the highest in the sample. Second, for firms in Grades B and C, their position in the upper layers appeared to be driven more frequently by digitalization tendency and digitalization investment rather than consistently exceptional innovation output. Third, the skyline surfaces of the upper grades were not perfectly “flat,” implying that even top-tier firms might have imbalances across attributes; that is, a firm could remain non-dominated overall while being relatively weaker on one attribute, provided it compensated with sufficiently strong performance on others. Fourth, as the grade decreased, the attribute values tended to converge toward the overall mean, and skyline frontiers became less extreme. Finally, in the lower grades, the distributions often exhibited the opposite pattern of the top tiers, in which firms might perform particularly poorly on at least one attribute, pushing them into dominated positions.
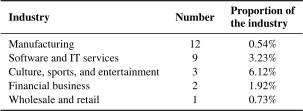
Table 3. Industry distribution of the first three grades.
To illustrate the third pattern, we considered two examples from the top layers. Gree (000651) showed relatively moderate levels of digitalization tendency and digitalization investment; however, its digitalization innovation was among the strongest in the sample that might reflect its technological leadership within its industry. By contrast, YOFC demonstrated an exceptionally strong digitalization tendency, whereas its investment and innovation measures were comparatively moderate, suggesting that strategic attention to digitalization could also contribute materially to the skyline position of a firm, even when other attributes were not at the extreme upper tail.
As reported in Table 3, firms in the top three digitalization maturity grades (A–C) were distributed across the five industries. In terms of counts, Manufacturing included the largest number of firms (12); this was likely related to the fact that manufacturing also accounted for the largest share of listed firms overall. The second largest group was Software and IT services (nine firms); this was consistent with the technology-intensive nature of the industry and its stronger capability to adopt and leverage digital technologies. Notably, when considering the within-industry proportion, Culture, sports, and entertainment exhibited the highest representation (6.12%). This pattern was plausible because business activities in this industry were closely tied to digital content, media technologies, and platform-based delivery that tended to be associated with higher digitalization maturity.
Table 4. Region distribution of the first three grades.
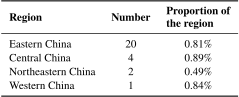
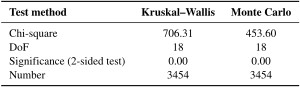
Table 5. Testing results for diversities in 21 industries.
As presented in Table 4, the eastern region accounted for the largest number of firms in the top three grades (20 firms). This might partly reflect the larger population of the listed firms and stronger economic agglomeration in the eastern region. The central region ranked the second (four firms). A reasonable explanation was that the central region benefited from improved transportation connectivity and industrial linkages that could facilitate factor mobility and knowledge diffusion relative to the western and northeastern regions, thereby supporting the digitalization advancement of firms.
A review of the data and evaluation results suggested that the digitalization maturity of firms exhibited additional patterns that merit further investigation. Accordingly, we conducted a heterogeneity (diversity) analysis to examine digitalization maturity from multiple perspectives.
Table 6. Assessment results of different industries.
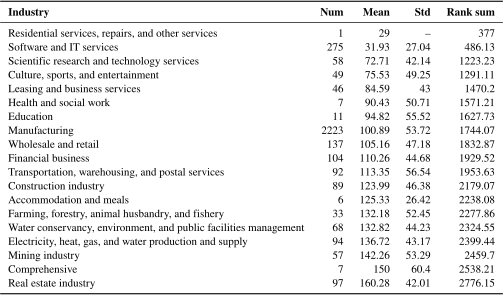
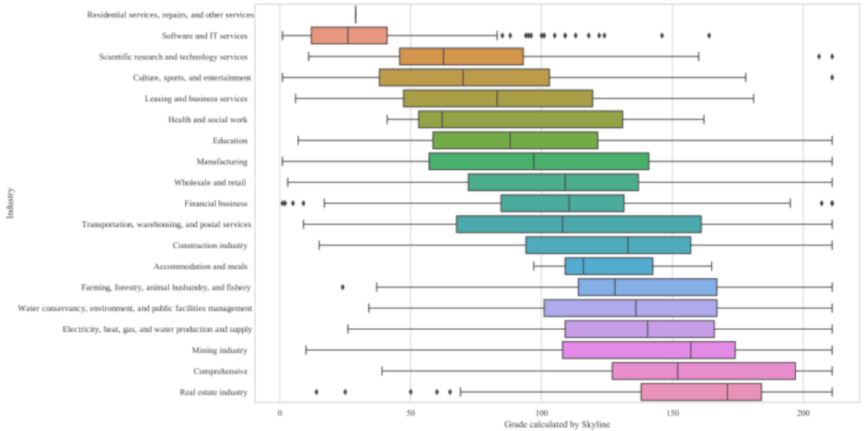
Fig. 6. Distribution of grades in different industries.
4.3. Industry Diversity Analysis of Digitalization Maturity Grade
In Tables 3 and 4, we provided an initial descriptive discussion of the industries represented among firms with excellent digitalization maturity. To more comprehensively examine industry differences, we further conducted formal statistical tests and summarized the distribution of digitalization maturity across all industries. For subsequent analyses and clearer presentation, we transformed the maturity grades into numeric ranks, assigning Grades A, B, C, and so forth to Ranks 1, 2, 3, and so forth, respectively, where smaller values indicated higher digitalization maturity.
We tested whether digitalization maturity differed systematically across industries. Table 5 reports the results of the Kruskal–Wallis test and Monte Carlo significance test, both of which indicate statistically significant differences in digitalization maturity across industries. Table 6 summarizes the number of firms, mean maturity rank, standard deviation, and rank sum used in the Kruskal–Wallis framework for each industry. Fig. 6 shows the distribution of the maturity ranks by industry.
One industry, “residential services, repairs, and other services,” contained only one listed firm, Beijing Baihua Yuebang Technology Co., Ltd., with a maturity rank of 29. Given the absence of the within-industry variation, this industry was not informative for a comparative heterogeneity analysis and was excluded from the discussion.
Based on Tables 5 and 6 and Fig. 6, several findings emerged.
First, digitalization maturity significantly differed across industries. This conclusion was supported by the significant Kruskal–Wallis and Monte Carlo test results and by the substantial cross-industry variation in mean ranks, dispersion, and rank sums. Conceptually, industries grouped firms with similar production structures, resource requirements, and market environments. These differences implied heterogeneous sensitivity and responsiveness to digital technologies, which in turn, led to uneven digitalization maturity across industries.
Second, software and IT services exhibited the highest digitalization maturity among the industries with meaningful sample sizes. This industry showed the most favorable mean maturity rank and rank sum and also displayed a relatively low dispersion. Together, these patterns suggested that firms in software and IT services were not only highly ranked on average but also comparatively homogeneous, with many firms clustering at higher maturity levels. This result was consistent with the technology-intensive nature of the industry and its role in producing and supplying digital products, services, and infrastructure.
Third, the real estate industry appeared to be the sector in which digitalization maturity was most in need of improvement. It showed the least favorable mean maturity rank and rank sum, along with relatively limited dispersion, indicating that most firms in this sector were consistently evaluated at lower maturity levels rather than being driven by a few outliers. In China, real estate firms largely engage in land- and building-based economic activities that are capital- and labor-intensive. For many of these firms, large-scale digital transformation may not be perceived as the most immediate source of returns; this can weaken incentives for digital investment and innovation and ultimately result in a lower measured digitalization maturity.
Fourth, manufacturing, as a foundational sector of Chinese economy, presented a more mixed picture. Although it included the largest number of listed firms, its overall digitalization maturity rank was relatively moderate, and within-industry dispersion was comparatively high. A plausible explanation was that manufacturing encompassed highly diverse subsectors and business models that could generate substantial variations in digitalization incentives, capabilities, and outcomes.
In summary, the digitalization maturity of Chinese listed firms was uneven across industries. Industries that were more technologically intensive and more directly connected to digital technologies, such as software and IT services, tended to achieve higher digitalization maturity, whereas traditional industries, such as real estate, generally lagged and might require stronger transformation efforts.
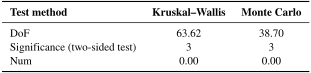
Table 7. Testing results for diversities in four regions.
4.4. Region Diversity Analysis of Digitalization Maturity Grade
To further examine firm digitalization maturity in China, we conducted a regional heterogeneity analysis based on the SKA evaluation results. Table 7 reports the Kruskal–Wallis test and Monte Carlo significance test results that are used to assess whether digitalization maturity differs across regions. Table 8 summarizes the number of firms, mean maturity rank, standard deviation, and rank sum underlying the Kruskal–Wallis test for each region. Fig. 7 shows the distribution of digitalization maturity ranks across the regions.
Based on Tables 7 and 8 and Fig. 7, the following results were obtained.
First, digitalization maturity significantly differed across regions. The mean ranks, dispersion, and rank sums varied across regions, and both the Kruskal–Wallis and Monte Carlo tests indicated statistically significant differences. These results suggested that regional environments were associated with systematic heterogeneity in the digitalization maturity of firms.
Table 8. Assessment results of different regions.
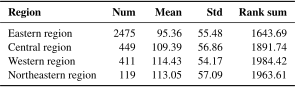
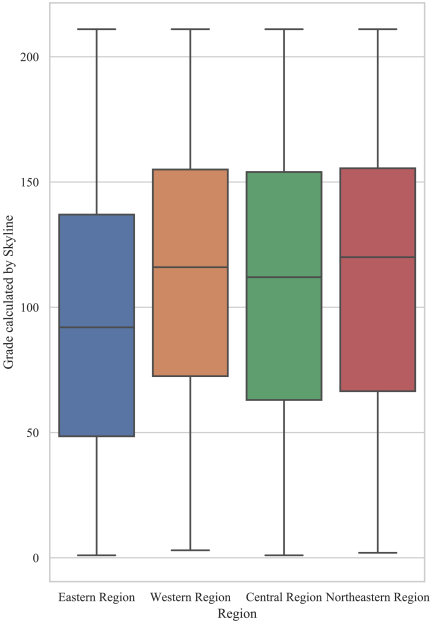
Fig. 7. Distribution of grades in different regions.
Second, the eastern region exhibited the highest digitalization maturity, with a clear advantage over other regions. Although the eastern region contained the largest number of listed firms, it also showed the most favorable mean maturity rank and rank sum. This pattern was consistent with the concentration of economically developed provinces and major cities, such as Beijing, Shanghai, and Guangdong, in the eastern region. These areas typically benefited from stronger infrastructure, denser innovation networks, and more abundant resources that could facilitate the adoption and effective use of digital technologies, thereby supporting higher firm-level digitalization maturity.
Third, the differences among the central, northeastern, and western regions were comparatively modest, and their overall performance was less favorable than that of the eastern region. The western region appeared to be relatively stable in a statistical sense, showing a smaller dispersion of maturity ranks; however, its average maturity level remained lower. The central and northeastern regions exhibited broadly similar midrange distributions. A plausible explanation was that, on average, these regions had weaker access to high-quality digital resources, thinner knowledge-exchange networks, and a lower intensity of technology spillovers than the eastern region; this might reduce the responsiveness of firms to digitalization and slow digital upgrading.
This regional pattern was also consistent with the differences in the industrial composition and development trajectories. Historically, the northeastern region has been associated with agriculture and heavy industry, and many firms in the region remain concentrated in traditional sectors that tend to digitalize more slowly. The western region, despite containing several important cities, includes many provinces with relatively limited economic development and weaker financial and institutional support that may constrain the investment of firms in digitalization and the diffusion of digital capabilities. These factors jointly help explain the reasons for the firms in the northeastern and western regions to generally exhibit lower digitalization maturity.
In summary, the digitalization maturity of firms was uneven across regions in China. The regions characterized by stronger resource endowments and more active knowledge exchanges tended to exhibit significantly higher digitalization maturity, whereas those with a heavier concentration of traditional industries and weaker innovation ecosystems generally lagged 32.
5. Discussions
In the digital economy, firms increasingly need to understand whether their level of digitalization maturity is sufficient to sustain competitiveness. Given the importance of China in the global economy, assessing the digitalization maturity of Chinese listed firms is also of interest to academic research and policy practice. Using publicly available multi-source data, including annual reports, intangible asset disclosures, and patent records, three firm-level attributes were constructed to capture digitalization orientation (tendency), resource commitment (investment), and outcomes (innovation output). These attributes were integrated using the EWM and evaluated through the SKA that was suitable for heterogeneous multi-dimensional assessment.
The evaluation results suggested that the firms with higher digitalization maturity tended to cluster in industries that were more sensitive to digital technologies and in regions characterized by stronger resource endowments and more active knowledge exchange. Heterogeneity analyses further confirmed that digitalization maturity differed significantly across industries and regions, indicating that it was shaped not only by firm-level characteristics but also by broader industrial and regional environments.
This study methodologically contributed by proposing an integrated EWM–SKA framework for digitalization maturity assessment. Unlike traditional linear composite indices that rely on fully compensatory aggregation, the proposed framework combined entropy-based objective weighting with a skyline-based non-dominance evaluation mechanism. This design reduced subjectivity in weighting, preserved multi-dimensional structures, and limited excessive compensability across attributes. In terms of measurement, this study developed a multi-source evaluation system that integrated text-based digital signals with objective indicators of digital investment and innovation output. By aligning the disclosed strategic orientation with observable economic and technological activities, the framework enhanced the validity, credibility, and robustness of firm-level digitalization maturity measurements.
Empirically, this study provided systematic evidence on the distribution of digitalization maturity among Chinese listed firms and revealed significant cross-industry and cross-regional disparities, highlighting the importance of structural, industrial, and regional environments in shaping digital transformation. (1) For firms, digitalization maturity should be understood as a multi-dimensional capability requiring alignment between strategic orientation, sustained digital investment, and continuous innovation, particularly for firms operating in lagging industries or regions; digitally mature firms may further facilitate ecosystem upgrading through supply chain digitalization and collaborative innovation. (2) For governments, more targeted rather than uniform policy interventions are necessary, with greater support directed toward digitally lagging sectors and regions through resource reallocation, technology diffusion, and improvements to digital infrastructure and institutional environments.
Acknowledgments
This study was funded by the China Postdoctoral Science Foundation (Grant No.2025M783699) and Key Project of the National Social Science Foundation of China (Grant No.20ATJ005). The authors declare no conflicts of interest.
- [1] A. Meier, R. Eller, and M. Peters, “Creating competitiveness in incumbent small- and medium-sized enterprises: A revised perspective on digital transformation,” J. of Business Research, Vol.186, Article No.115028, 2025. https://doi.org/10.1016/j.jbusres.2024.115028
- [2] S. A. Taylor, G. L. Hunter, A. H. Zadeh, D. Delpechitre, and J. H. Lim, “Value propositions in a digitally transformed world,” Industrial Marketing Management, Vol.87, pp. 256-263, 2020. https://doi.org/10.1016/j.indmarman.2019.10.004
- [3] J. J. M. Ferreira, C. I. Fernandes, and F. A. F. Ferreira, “To be or not to be digital, that is the question: Firm innovation and performance,” J. of Business Research, Vol.101, pp. 583-590, 2019. https://doi.org/10.1016/j.jbusres.2018.11.013
- [4] Y. Qi, K. Hou, M. Zhang, T. Pu, and H. Guo, “Digitalization and financial performance: A supply chain perspective,” Information & Management, Vol.62, No.7, Article No.104199, 2025. https://doi.org/10.1016/j.im.2025.104199
- [5] N. Coviello, L. Kano, and P. W. Liesch, “Adapting the Uppsala model to a modern world: Macro-context and microfoundations,” J. of Int. Business Studies, Vol.48, No.9, pp. 1151-1164, 2017. https://doi.org/10.1057/s41267-017-0120-x
- [6] H. Tang, J. Zhu, N. Li, and W. Wu, “Impact of enterprise supply chain digitalization on cost of debt: A four-flows perspective analysis using explainable machine learning methodology,” Sustainability, Vol.16, No.19, Article No.8702, 2024. https://doi.org/10.3390/su16198702
- [7] H. Tang, Y. Zhao, N. Li, and J. Zhu, “Enhancing crowdfunding financing speed through image-text integration strategies: Insights from information processing theory and explainable machine learning methodology,” Technology in Society, Vol.84, Article No.103136, 2026. https://doi.org/10.1016/j.techsoc.2025.103136
- [8] D. Tang and J. Wei, “Prediction and characteristic analysis of enterprise digital transformation integrating XGBoost and SHAP,” J. Adv. Comput. Intell. Intell. Inform., Vol.27, No.5, pp. 780-789, 2023. https://doi.org/10.20965/jaciii.2023.p0780
- [9] J. Wei and Y. Shen, “Impact and mechanism of digital transformation on performance in manufacturing firms,” Innovation and Green Development, Vol.4, No.1, Article No.100205, 2025. https://doi.org/10.1016/j.igd.2025.100205
- [10] T. Hout and P. Ghemawat, “China vs the world: Whose technology is it?,” Harvard Business Review, Vol.88, No.12, 2010. https://hbr.org/2010/12/china-vs-the-world-whose-technology-is-it [Accessed December 20, 2025]
- [11] M. Gradillas and L. D. W. Thomas, “Distinguishing digitization and digitalization: A systematic review and conceptual framework,” J. of Product Innovation Management, Vol.42, No.1, pp. 112-143, 2025. https://doi.org/10.1111/jpim.12690
- [12] T. Ritter and C. L. Pedersen, “Digitization capability and the digitalization of business models in business-to-business firms: Past, present, and future,” Industrial Marketing Management, Vol.86, pp. 180-190, 2020. https://doi.org/10.1016/j.indmarman.2019.11.019
- [13] C. Legner et al., “Digitalization: Opportunity and challenge for the business and information systems engineering community,” Business & Information Systems Engineering, Vol.59, No.4, pp. 301-308, 2017. https://doi.org/10.1007/s12599-017-0484-2
- [14] C. Hsu, “Scaling with digital connection: Services innovation,” 2007 IEEE Int. Conf. on Systems, Man and Cybernetics, pp. 4057-4061, 2007. https://doi.org/10.1109/ICSMC.2007.4414260
- [15] W. Coreynen, P. Matthyssens, and W. Van Bockhaven, “Boosting servitization through digitization: Pathways and dynamic resource configurations for manufacturers,” Industrial Marketing Management, Vol.60, pp. 42-53, 2017. https://doi.org/10.1016/j.indmarman.2016.04.012
- [16] R. G. Fichman, B. L. Dos Santos, and Z. E. Zheng, “Digital innovation as a fundamental and powerful concept in the information systems curriculum,” MIS Quarterly, Vol.38, No.2, pp. 329-354, 2014. https://doi.org/10.25300/MISQ/2014/38.2.01
- [17] E. Autio, S. Nambisan, L. D. W. Thomas, and M. Wright, “Digital affordances, spatial affordances, and the genesis of entrepreneurial ecosystems,” Strategic Entrepreneurship J., Vol.12, No.1, pp. 72-95, 2018. https://doi.org/10.1002/sej.1266
- [18] S. G. Gavrila and A. de Lucas Ancillo, “Spanish SMEs’ digitalization enablers: E-receipt applications to the offline retail market,” Technological Forecasting and Social Change, Vol.162, Article No.120381, 2021. https://doi.org/10.1016/j.techfore.2020.120381
- [19] K. S. R. Warner and M. Wäger, “Building dynamic capabilities for digital transformation: An ongoing process of strategic renewal,” Long Range Planning, Vol.52, No.3, pp. 326-349, 2019. https://doi.org/10.1016/j.lrp.2018.12.001
- [20] A. Fleury, M. T. L. Fleury, L. Oliveira, and P. Leao, “Going digital EMNEs: The role of digital maturity capability,” Int. Business Review, Vol.33, No.4, Article No.102271, 2024. https://doi.org/10.1016/j.ibusrev.2024.102271
- [21] G. Garechana, R. Río-Belver, I. Bildosola, and M. R. Salvador, “Effects of innovation management system standardization on firms: Evidence from text mining annual reports,” Scientometrics, Vol.111, No.3, pp. 1987-1999, 2017. https://doi.org/10.1007/s11192-017-2345-7
- [22] H. Wen, Q. Zhong, and C.-C. Lee, “Digitalization, competition strategy and corporate innovation: Evidence from Chinese manufacturing listed companies,” Int. Review of Financial Analysis, Vol.82, Article No.102166, 2022. https://doi.org/10.1016/j.irfa.2022.102166
- [23] F. Wagner, “Determinants of conventional and digital investment advisory decisions: A systematic literature review,” Financial Innovation, Vol.10, Article No.18, 2024. https://doi.org/10.1186/s40854-023-00538-7
- [24] A. Chen, C. Xu, and H. Zhang, “The influence of digitalisation on the three-stage innovation efficiency of high-tech industry,” Technology Analysis & Strategic Management, 2025. https://doi.org/10.1080/09537325.2025.2543442
- [25] V. W. Fang, X. Tian, and S. Tice, “Does stock liquidity enhance or impede firm innovation?,” The J. of Finance, Vol.69, No.5, pp. 2085-2125, 2014. https://doi.org/10.1111/jofi.12187
- [26] A. Aizawa, “An information-theoretic perspective of TF–IDF measures,” Information Processing & Management, Vol.39, No.1, pp. 45-65, 2003. https://doi.org/10.1016/S0306-4573(02)00021-3
- [27] I. Paik and H. Mizugai, “Recommendation system using weighted TF–IDF and Naive Bayes classifiers on RSS contents,” J. Adv. Comput. Intell. Intell. Inform., Vol.14, No.6, pp. 631-637, 2010. https://doi.org/10.20965/jaciii.2010.p0631
- [28] J. Chomicki, P. Godfrey, J. Gryz, and D. Liang, “Skyline with presorting: Theory and optimizations,” Intelligent Information Processing and Web Mining (Proc. of the Int. IIS:IIPWM’05 Conf.), pp. 595-604, 2005. https://doi.org/10.1007/3-540-32392-9_72
- [29] A. Sidiropoulos, A. Gogoglou, D. Katsaros, and Y. Manolopoulos, “Gazing at the skyline for star scientists,” J. of Informetrics, Vol.10, No.3, pp. 789-813, 2016. https://doi.org/10.1016/j.joi.2016.04.009
- [30] China Securities Regulatory Commission, “Guidelines for the industry classification of listed companies (2012 revision),” 2012. http://www.csrc.gov.cn/pub/newsite/flb/flfg/bmgf/zh/gfxwjtj/201310/t20131016_236281.html [Accessed December 20, 2025]
- [31] National Bureau of Statistics of China, “Eastern, Central, Western and Northeastern region division method,” 2011. http://www.stats.gov.cn/ztjc/zthd/sjtjr/dejtjkfr/tjkp/201106/t20110613_71947.htm [Accessed December 20, 2025]
- [32] Y. Shen, X. Zhang, and X. Wang, “Innovation-driven sustainable development: Analysing the impact of digital technology on synergistic governance of pollution and carbon reduction,” Vol.14, Article No.100978, 2026. https://doi.org/10.1016/j.jik.2026.100978
This article is published under a Creative Commons Attribution-NoDerivatives 4.0 Internationa License.