
Research Paper:
Degradation Trend Analysis Based on Data-Driven Health Modeling for an Electro-Hydraulic Drive System in Tunnel Drilling Rigs
Naiwen Zhang*1, Haitao Song*2,*3, Aoxue Yang*2,*4,*5, Chengda Lu*2,*4,*5, Haipeng Fan*2,*4,*5, Hongbo Dong*3, and Min Wu*2,*4,*5,†
*1School of Future Technology, China University of Geosciences
No.388 Lumo Road, Hongshan District, Wuhan, Hubei 430074, China
*2School of Artificial Intelligence and Automation, China University of Geosciences
No.388 Lumo Road, Hongshan District, Wuhan, Hubei 430074, China
*3CCTEG Xi’an Research Institute (Group) Co., Ltd.
No.82 Jinye 1st Road, Gaoxin District, Xi’an, Shaanxi 710077, China
*4Hubei Key Laboratory of Advanced Control and Intelligent Automation for Complex Systems
No.388 Lumo Road, Hongshan District, Wuhan, Hubei 430074, China
*5Engineering Research Center of Intelligent Technology for Geo-Exploration, Ministry of Education
No.388 Lumo Road, Hongshan District, Wuhan, Hubei 430074, China
†Corresponding author

An electro-hydraulic drive system is essential for the stable operation of tunnel drilling rigs in underground coal mines. However, components such as pumps, valves, and controllers inevitably experience gradual degradation under long-term and high-load conditions. Conventional monitoring approaches often rely on labeled fault data or suffer from limited interpretability, restricting their applicability in real engineering environments. To overcome these limitations, this study proposes an unsupervised degradation trend analysis method that does not use labeled samples. A sliding-window strategy was adopted to extract key statistical features. Principal component analysis was then employed to construct a unified health index, and Z-score normalization enabled the interpretable detection of abnormal tendencies in individual features. Validation on real drilling data revealed clear degradation behaviors, such as main pump leakage and control current drift, demonstrating that the proposed method offered a lightweight and interpretable solution for trend-based condition monitoring and provided practical support for the intelligent maintenance of electro-hydraulic drive systems.
1. Introduction
With the growing demand for intelligent and efficient underground excavation, mechanized coal mine drilling has become increasingly reliant on the stable performance of complex electromechanical systems. Among these, electro-hydraulic drive circuits play a critical role in enabling coordinated control of feeding, rotation, and clamping units. However, prolonged high-load operation and harsh subterranean environment expose this system to gradual degradation, such as pump leakage, pressure decay, and control signal drift. These degradations typically occur without abrupt symptoms, making them difficult to detect using conventional threshold-based alarm strategies or manual inspections. To address this challenge, this study aims to develop a data-driven, label-free, and interpretable framework for degradation trend analysis, enabling the early detection of performance decline and supporting predictive maintenance in real-world drilling operations.
A wide range of research has been devoted to the intelligent monitoring of electro-hydraulic drive systems. For example, Tang et al. 1 proposed a convolutional neural network-based supervised learning framework for hydraulic fault classification, achieving high accuracy under labeled conditions. Nevertheless, supervised learning methods generally rely on large-scale, high-quality fault datasets that are often unavailable in underground drilling scenarios. Liang et al. 2 introduced a detection method combining support vector machines (SVMs) with an improved whale optimization algorithm that enhanced the detection performance but remained dependent on predefined labels and prior knowledge of fault types.
Unsupervised methods have garnered increasing attention for circumventing the reliance on labeled data. Shi et al. 3 employed a principal component analysis (PCA)-based anomaly detection approach to uncover fault states in hydraulic valve systems, although their method lacked the capability to interpret the physical sources of degradation. Yang et al. 4 developed a dynamic Bayesian network model to capture multivariate anomalies with temporal dependencies; however, its high model complexity and limited interpretability hindered its practical deployment. Huang et al. 5 applied deep autoencoders for unsupervised detection; however, their approach required substantial computational resources and failed to establish clear associations between anomalies and underlying physical mechanisms.
In summary, existing approaches, whether supervised or unsupervised, are often constrained by the need for labeled data, excessive model complexity, or insufficient interpretability. These limitations pose significant barriers to their adoption in real-world coal mine drilling systems where online adaptability, lightweight implementation, and physical interpretability are of paramount importance 6.
In response to these challenges, this paper presents a fully unsupervised degradation trend analysis framework for electro-hydraulic drive circuits in coal mine drilling equipment. The proposed method employed a sliding-window strategy to extract time-domain statistical features from multi-sensor signals, constructed a health index (HI) using PCA, and used Z-score-based deviation analysis to identify and interpret abnormal behaviors in key physical variables 7. The framework did not require labeled fault samples or complex model architectures and enabled lightweight degradation trend monitoring with feature-level interpretation. Experimental validation based on actual coal mine drilling data demonstrated that the proposed method could effectively detect performance degradation trends, such as the main pump pressure loss and control signal fluctuation, thereby offering a practical and robust solution for intelligent condition monitoring in underground drilling operations. The main contributions of this study can be summarized as follows:
-
We established a label-free degradation trend analysis pipeline that integrated drilling segment selection, sliding-window time-domain features, PCA-based HI construction, and Z-score interpretation.
-
The framework was lightweight and deployment oriented, relying only on simple statistics and PCA projections to support online monitoring without training heavy models.
-
Feature-level Z-score interpretation linked abnormal deviations to physically meaningful variables, enabling degradation localization for maintenance decision-making.
2. Process Description and Analysis Scheme
The reliable operation of electro-hydraulic drive systems in coal mine drilling rigs is critical for maintaining excavation efficiency and operational safety 8. However, prolonged exposure to high loads and variable underground conditions often results in gradual performance degradation such as pressure decay, control current drift, and unstable actuator dynamics. These degradation processes typically develop slowly and without clear fault labels, making them difficult to identify using conventional threshold-based alarms or manual inspections 9. A typical underground coal mine drilling process and equipment layout, including the pump truck, control console, tunnel drilling rig, and drill rod interacting with the coal seam, are shown in Fig. 1. To enable early detection and improve the interpretability of these degradations, a data-driven, unsupervised framework is developed.
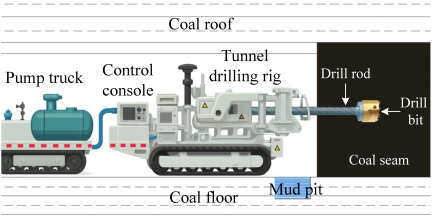
Fig. 1. Illustration of the drilling process in an underground coal mine.
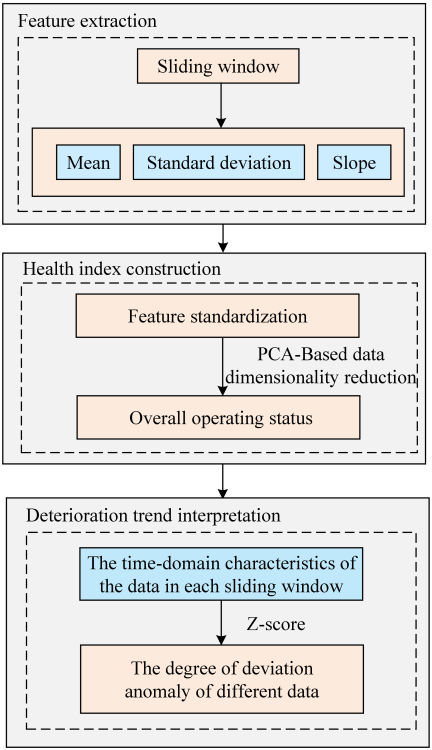
Fig. 2. Scheme of degradation trend analysis.
The overall framework of the proposed method is illustrated in Fig. 2. It begins with the extraction of statistical features from multivariate sensor signals, including the hydraulic pressure, control current, and actuator speed. These time-series signals are segmented using a sliding window approach, and each segment is characterized by key indicators such as mean, standard deviation, and slope 10. The resulting feature matrix is then standardized and reduced in dimensionality using PCA, from which a unified HI is derived to represent the system’s global performance trend of the system over time. To provide feature-level interpretability, Z-score normalization is subsequently applied to quantify the deviation of each feature from its global baseline, allowing degradation phenomena such as main pump leakage or electronic control drift to be localized and explained.
By integrating statistical feature modeling, dimensionality reduction, and standardized deviation analysis, this framework supports the unsupervised, interpretable monitoring of electro-hydraulic drive systems, enabling timely insights into evolving deterioration for predictive maintenance and operational decision-making.
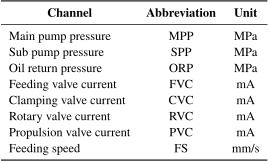
The sensor channels used in this study include hydraulic pressure, valve control current, and feeding speed. The corresponding abbreviations and physical units are summarized in Table 1 for clarity and consistency throughout the analysis.
3. Data-Driven Degradation Analysis for an Electro-Hydraulic Drive System
A fully unsupervised degradation analysis framework is developed for an electro-hydraulic drive circuit in coal mine tunnel drilling rigs. First, sliding window-based time-domain feature extraction is performed to characterize the dynamic behavior of multivariate sensor signals. Then, PCA is applied to construct a one-dimensional HI that reflects the global performance trend. Finally, a Z-score-based approach is used to quantify the deviation of each feature from its normal state, enabling interpretable identification of the degradation modes. The detailed methodology is described in the following sections.
Table 1. Sensor data type abbreviations and units.
3.1. Preprocessing
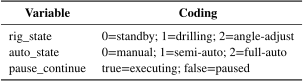
Before applying the sliding window strategy, the experiments use multi-channel field data recorded from tunnel drilling rigs that are preprocessed to ensure consistency and reliability for feature extraction. The raw signals are first time-aligned and screened to remove duplicated or invalid records, and missing values are handled by filling short gaps while discarding intervals with long gaps to avoid introducing artificial trends. When necessary, light noise suppression and mild outlier treatment are applied to reduce the influence of measurement fluctuations and sporadic spikes. To ensure that only stable drilling behaviors are analyzed, we extract the drilling timestamps from the recorded rig-state table and perform working-condition filtering in a rule-based manner: we retain the intervals where rig_state indicates drilling and auto_state is valid under drilling, remove pause periods using pause_continue, and retain only continuous segments with lengths no less than \(N_{\min}\). After this state-table-driven filtering, the remaining samples are partitioned into sliding windows for time-domain feature computation, and the extracted feature matrix is standardized to zero mean and unit variance prior to the PCA-based HI modeling (Eq. 9). The key state variables and their encodings used for the aforementioned rule-based filtering are summarized in Table 2.
Table 2. Key state variables for working-condition filtering.
3.2. Time-Domain Feature Extraction with Sliding Window
To capture the temporal evolution of the system behavior, a sliding window strategy is applied to partition the time-series data into overlapping segments 11, thereby preserving the local dynamics while ensuring continuity. Within each window, the key time-domain statistical features are extracted for each sensor channel. Specifically, the mean value reflects the overall signal level; the standard deviation characterizes short-term fluctuations; and the linear slope, computed via least-squares regression, captures the local trend in the signal change. This process transforms the original multivariate time-series data into a structured feature matrix that serves as the basis for subsequent dimensionality reduction and degradation trend analysis 12.
Let \(x(t)\) be a sensor signal (for example, pressure) sampled at fixed intervals. The time series is divided into windows of fixed length \(L\) with a step size \(S\). For the \(i\)-th window, the signal segment is
Each window becomes a unit for feature extraction. For each window \(x_i\), the following time-domain features are extracted: mean, standard deviation, and slope.
Assuming a time index \(t_{i} = j\), slope \(s_i\) is computed using linear regression as follows:
These computations are repeated for each selected signal channel (such as pressure and current), forming a multi-dimensional feature vector for each window 13. The extracted features reflect the localized trends and fluctuations of system variables that are sensitive to degradation phenomena such as pressure drops, control instability, or irregular flow patterns 14. These compact representations enable subsequent dimensionality reduction and unsupervised analysis.
3.3. Degradation Curves and Health Indicators
The health condition of electro-hydraulic equipment continuously evolves over its life cycle 15. Accurately describing the degradation trend is thus essential for health assessment and early warning. Following common practice, we normalize the time such that \(t \in [0, t_{n}]\). Here, \(t_n\) denotes the failure time and defines a normalized health trend \(f(t) \in [0, 1]\) with \(f(0) = 1\) and \(f(t_{n}) = 0\).
Commonly used degradation functions include linear, piecewise, and quadratic functions.
(1) Linear degradation
A linear trend assumes a constant degradation rate:
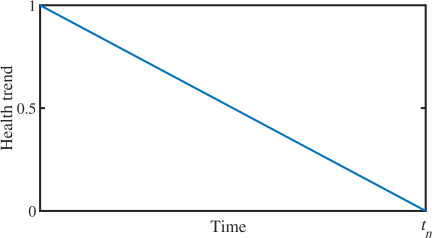
Fig. 3. Degradation trends described by the linear function.
(2) Piecewise degradation
To represent a healthy plateau followed by a linear decline, we adopt a piecewise model with an (unknown) onset time \(t_j\):
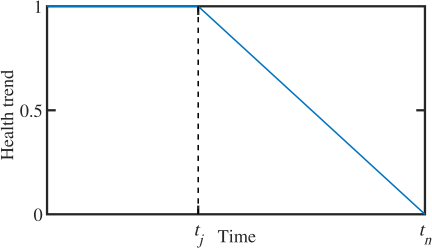
Fig. 4. Degradation trends described by the piecewise function.
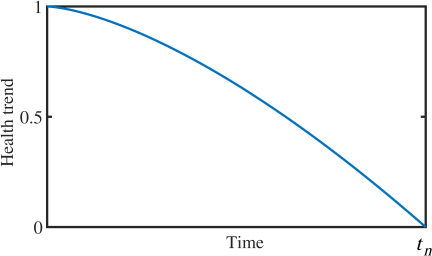
Fig. 5. Degradation trends described by the quadratic function.
(3) Quadratic degradation
Guided by the wear accumulation and damage propagation principles of the rotating/hydraulic components, we use a convex quadratic function to approximate the accelerating decline:
As illustrated in Fig. 5, Eq. 8 better reflects the empirical behavior we observe in the coal mine drilling rigs: indicators related to pump leakage and pressure loss degrade slowly at first and then enter a rapid acceleration phase near failure. Compared with Eqs. 6 and 7, the quadratic curve provides a more accurate description while avoiding explicit inflection point detection.
3.4. PCA-Based Health Index Construction
To provide a compact representation of the overall degradation state of the electro-hydraulic drive circuit, PCA is employed to reduce the dimensionality of multivariate time-domain features 17. Let \(\mathbf{X} \in \mathbb{R}^{N \times M}\) denote the feature matrix derived from \(N\) sliding windows, each containing \(M\) extracted statistical features 18. Prior to PCA, all features are standardized to zero mean and unit variance to eliminate the effects of differing physical units and scales.
PCA is then performed on standardized matrix \(\mathbf{Z}\).
The first principal component (PC1), which captures the dominant variance in the data, is selected as the HI.
The resulting \(HI(t)\) sequence reflects the temporal evolution of system performance and provides a quantitative basis for subsequent degradation interpretation and early anomaly detection 19.
3.5. Z-Score-Based Degradation Trend Interpretation
Although the HI captures the global degradation trend, feature-level interpretation is essential for linking system deterioration to specific physical components. To achieve this, Z-score normalization is used to quantify the statistical deviation of each time-domain feature from its global distribution. For the \(i\)-th window and feature \(j\), the Z-score is computed as follows:
The Z-score expresses deviations in units of standard deviation, enabling consistent comparisons across features with heterogeneous scales and physical units 21. Large positive or negative Z-scores highlight abnormal shifts in individual features, which can be traced to degradation mechanisms such as main pump leakage, control signal drift, or valve blockage. Monitoring the temporal profiles of Z-scores thus provides interpretable feature-level diagnostics and supports early warning and predictive maintenance, even in the absence of labeled fault data or clustering assumptions 22.
Table 3. Key parameter settings used in this study.
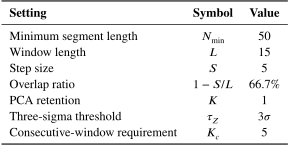
Table 4. Computational cost on the platform used.
4. Experiment Results Analysis
To evaluate the practical effectiveness of the proposed unsupervised deterioration trend analysis framework, a series of experiments were conducted using real data. These experiments aimed to demonstrate the ability of the system to extract relevant time-domain features, construct health indicators, and identify degradation behaviors without the need for labeled fault samples. The key implementation parameters used in this study are listed in Table 3. \(L\) and \(S\) were selected to balance temporal resolution and noise suppression, and a 66.7% overlap ensured continuity for trend tracking.
Based on the aforementioned settings, a simple and reproducible early-warning decision rule was adopted for evaluation. For each sliding window, feature-wise Z-scores were computed using Eq. 12. An early warning was triggered when \(|Z| \ge \tau_{Z}\) persisted for \(K_{c}\) consecutive windows, where \(\tau_{Z} = 3\sigma\) and \(K_{c} = 5\) were adopted to suppress sporadic noise-induced excursions.
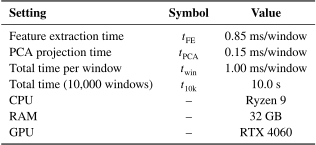
To further support practical deployment, the computational cost of the proposed pipeline on the platform used is listed in Table 4.
4.1. Feature Distribution and Global Operating Status
To analyze the degradation trend of the electro-hydraulic drive circuit, statistical features were first extracted from multi-channel sensor data using a sliding window approach. For each valid drilling segment, we computed three types of time-domain features, mean, standard deviation, and slope 23, for each selected variable, including the pressure, speed, and control current signals. Consequently, a high-dimensional feature matrix was formed, where each row represented one windowed segment and each column corresponded to a specific signal feature 24.
PCA was applied to synthesize the high-dimensional features into a unified degradation indicator 25. The PC1 that captured the maximum variance direction of the data was selected as the HI. This index reflected the overall health state of the system over time. In our experiments, the PC1 explained \(r_{1} = 92.7\)% of the total variance, indicating that the dominant degradation-related variation was well captured by the HI.
The HI curve is plotted with respect to the window index, as illustrated in Fig. 6. A clear downward or fluctuating trend in the HI implied a possible degradation process, whereas a stable HI suggested normal operating conditions. The HI curve enabled trend tracking and provided a compact representation of the underlying system behavior. These observations demonstrated that the extracted features effectively captured relevant operational patterns and that the HI curve provided a meaningful basis for subsequent trend tracking and rule-based condition interpretation.
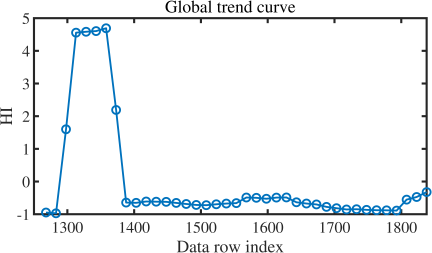
Fig. 6. Global operating status.
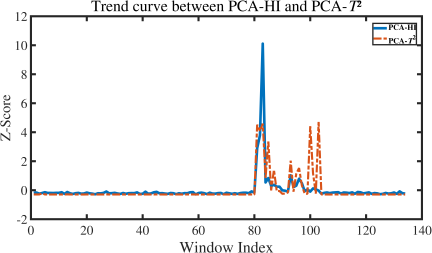
Fig. 7. Trend curve between PCA-HI and PCA-\(T^{2}\).
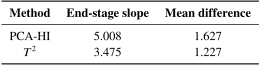
To further validate the effectiveness of the proposed PCA-HI, we computed Hotelling’s \(T^{2}\) statistic using the same PCA decomposition as a baseline indicator. Both indicators were standardized over the entire sequence to ensure comparability within the same coordinate system. Fig. 7 illustrates a comparison between the proposed PCA-HI and Hotelling’s \(T^{2}\), both standardized over the entire sequence. In the stable stage, the two curves remained close to zero without significant deviations. Once the degradation process began, both indicators started to increase; however, their behaviors differed considerably. The PCA-HI curve (blue) shows a clear and sharp increase, maintaining a relatively smooth trend throughout the degradation interval. In contrast, the \(T^{2}\) curve (orange) also increases but exhibits pronounced fluctuations and multiple transient spikes, making the underlying degradation trend less stable and more difficult to interpret. This observation confirmed that PCA-HI provided a more monotonic and interpretable trajectory, whereas \(T^{2}\) was more susceptible to noise. As confirmed from Table 5, PCA-HI outperformed \(T^{2}\) in terms of the end-stage slope and mean difference, indicating that PCA-HI was more suitable for degradation trend analysis and early fault warning.
Table 5. Quantitative comparison between PCA-HI and Hotelling’s \(T^{2}\).
4.2. Z-Score-Based Trend Explanation
A multivariate feature matrix was constructed to represent the evolving behavior of the electro-hydraulic system. However, owing to differences in feature magnitude and physical units (for example, MPa for pressure vs. mA for current), a direct comparison across features was not straightforward.
The validity of the proposed framework is exemplified in Tables 6 and 7 that present the statistical characteristics extracted from a typical sliding window in a degradation scenario. Several key indicators exhibited pronounced deviations, including a lower mean value of the main pump pressure, a positive slope in the oil return pressure, and an increasing trend in the propulsion valve current. These variations collectively reflected the atypical system behavior associated with the underlying deterioration. Tables 6 and 7 further characterize the temporal progression of degradation by comparing the feature statistics from the 16th and 18th sliding windows.
Table 6. Data features from the 16th sliding window.
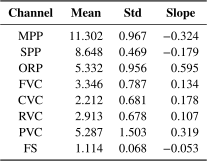
Table 7. Data features from the 18th sliding window.
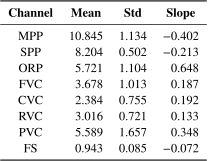
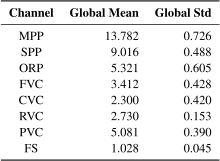
Table 8. Z-score analysis of all sliding windows.
The comparison revealed progressive shifts across multiple signal channels, particularly in the hydraulic pressure, control current, and feeding speed. These gradual changes provided quantitative insights into the evolving health condition of the system and reinforced the effectiveness of the proposed feature-based degradation assessment strategy.
The global mean and standard deviation of each feature dimension, computed across all the sliding windows, are listed in Table 8. These statistical parameters were subsequently used to calculate the Z-scores, allowing the degree of deviation in each feature to be quantitatively assessed. A representative window was selected. The raw feature values obtained from this window are listed in Table 7. Considering the main pump pressure as an example, the current window mean was 10.845 MPa, whereas the global mean and standard deviation were 13.782 and 0.726 MPa, respectively. Applying the Z-score formula yields
In other words, these indicators suggested a systemic loss of pressure in the hydraulic supply line, consistent with the main pump leakage condition. This degradation was likely caused by internal wear or seal failure that gradually reduced the pressure output and affected the overall drilling performance.
By contrast, a different pattern was observed for the control current signals. The propulsion valve current in the window increased to 5.589 mA compared with its global mean of 5.081 mA (global std \(=\) 0.390), yielding
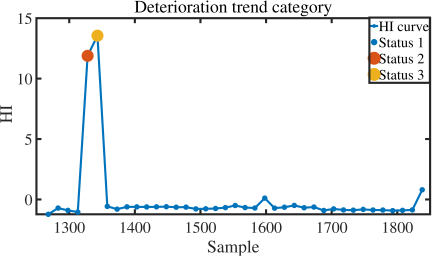
Fig. 8. Deterioration trend category.
Additionally, the feeding valve current showed a positive Z-score of \(+\)0.62, whereas the corresponding standard deviation values were higher than the average, suggesting signal fluctuation or instability. This trend indicated an electronic control drift phenomenon in which the actuator current gradually deviated from normal owing to driver aging, sensor bias, or feedback loop degradation. The drift was slow and accumulative; hence, capturing it through traditional threshold alarms was difficult.
In summary, by combining global statistical baselines with local feature analysis using the Z-score transformation, two clear degradation patterns were identified, as shown in Fig. 8.
-
Status 2: Main pump leakage. Significant negative deviations in both the main and sub-pump pressures, accompanied by negative slope trends.
-
Status 3: Electronic control current drift, reflected by multiple control currents showing positive deviations in the mean and fluctuation levels.
This approach provided a fully unsupervised and feature-level interpretable solution for early-stage fault trend detection in electro-hydraulic drilling systems.
5. Conclusion
Based on the conducted analysis, the proposed unsupervised deterioration trend identification framework for electro-hydraulic drive systems effectively captured the degradation patterns in real drilling operations without relying on labeled data, enabling a complete pipeline from raw data ingestion and working-condition filtering to feature extraction, PCA-based HI modeling, and interpretable trend identification via feature-wise Z-score deviations. Compared with traditional supervised diagnostic methods, the framework accommodated multivariable sensor inputs and provided physically meaningful diagnostic insights that reflected common degradation behaviors such as pump leakage, control-signal drift, and valve jamming. The proposed approach was particularly suitable for monitoring gradual deterioration under relatively consistent operating conditions, whereas significant condition shifts might alter feature distributions and affect the warning sensitivity. Future work will focus on improving cross-machine generalization and robustness to operating condition variations and extending the framework with richer temporal features to better support industrial-scale health management.
Acknowledgments
This work was supported by the National Natural Science Foundation of China under Grant 62503441, 111 Project under Grant B17040, Shaanxi Provincial Key Research and Development Program under Grant 2024GX-YBXM-293, and Fundamental Research Funds for the Central Universities, China University of Geosciences.
- [1] S. Tang, Y. Zhu, and S. Yuan, “An improved convolutional neural network with an adaptable learning rate towards multi-signal fault diagnosis of hydraulic piston pump,” Adv. Eng. Inform., Vol.50, Article No.101406, 2021. https://doi.org/10.1016/j.aei.2021.101406
- [2] N. Liang et al., “A multi-output fault diagnosis framework for hydraulic system using a CNN-SVM hierarchical learning strategy,” Meas. Sci. Technol., Vol.35, No.7, Article No.076212, 2024. https://doi.org/10.1088/1361-6501/ad3f3b
- [3] J. Shi et al., “Fault diagnosis in a hydraulic directional valve using a two-stage multi-sensor information fusion,” Measurement, Vol.179, Article No.109460, 2021. https://doi.org/10.1016/j.measurement.2021.109460
- [4] W.-T. Yang, M. S. Reis, V. Borodin, M. Juge, and A. Roussy, “An interpretable unsupervised Bayesian network model for fault detection and diagnosis,” Control Eng. Pract., Vol.127, Article No.105304, 2022. https://doi.org/10.1016/j.conengprac.2022.105304
- [5] K. Huang, S. Wu, F. Li, C. Yang, and W. Gui, “Fault diagnosis of hydraulic systems based on deep learning model with multirate data samples,” IEEE Trans. Neural Netw. Learn. Syst., Vol.33, No.11, pp. 6789-6801, 2022. https://doi.org/10.1109/TNNLS.2021.3083401
- [6] C. Lu, S. Tian, M. Wu, N. Yao, and H. Song, “Generalized incremental dissipative control of drill-string system based on equivalent input-disturbance approach with stubborn state observer,” Automatica, Vol.181, Article No.112501, 2025. https://doi.org/10.1016/j.automatica.2025.112501
- [7] A. Melo, M. M. Câmara, N. Clavijo, and J. C. Pinto, “Open benchmarks for assessment of process monitoring and fault diagnosis techniques: A review and critical analysis,” Comput. Chem. Eng., Vol.165, Article No.107964, 2022. https://doi.org/10.1016/j.compchemeng.2022.107964
- [8] C. Zhao, H. Sun, and F. Tian, “Total variable decomposition based on sparse cointegration analysis for distributed monitoring of nonstationary industrial processes,” IEEE Trans. Control Syst. Technol., Vol.28, No.4, pp. 1542-1549, 2020. https://doi.org/10.1109/TCST.2019.2908339
- [9] W. Yu, C. Zhao, and B. Huang, “MoniNet with concurrent analytics of temporal and spatial information for fault detection in industrial processes,” IEEE Trans. Cybern., Vol.52, No.8, pp. 8340-8351, 2022. https://doi.org/10.1109/TCYB.2021.3050398
- [10] H. Fan et al., “Adaptive monitoring for geological drilling process using neighborhood preserving embedding and Jensen–Shannon divergence,” Control Eng. Pract., Vol.134, Article No.105476, 2023. https://doi.org/10.1016/j.conengprac.2023.105476
- [11] A. Mallak and M. Fathi, “Sensor and component fault detection and diagnosis for hydraulic machinery integrating LSTM autoencoder detector and diagnostic classifiers,” Sensors, Vol.21, No.2, Article No.433, 2021. https://doi.org/10.3390/s21020433
- [12] C. Ji, F. Ma, J. Wang, and W. Sun, “Orthogonal projection based statistical feature extraction for continuous process monitoring,” Comput. Chem. Eng., Vol.183, Article No.108600, 2024. https://doi.org/10.1016/j.compchemeng.2024.108600
- [13] S. Yin, S. X. Ding, X. Xie, and H. Luo, “A review on basic data-driven approaches for industrial process monitoring,” IEEE Trans. Ind. Electron., Vol.61, No.11, pp. 6418-6428, 2014. https://doi.org/10.1109/TIE.2014.2301773
- [14] A. Yang, M. Wu, C. Lu, J. Hu, and Y. Nakanishi, “Full condition monitoring of geological drilling process based on just-in-time learning-aided slow feature analysis,” J. Process Control, Vol.142, Article No.103284, 2024. https://doi.org/10.1016/j.jprocont.2024.103284
- [15] Q. Chao, Y. Shao, C. Liu, and X. Yang, “Health evaluation of axial piston pumps based on density weighted support vector data description,” Reliab. Eng. Syst. Saf., Vol.237, Article No.109354, 2023. https://doi.org/10.1016/j.ress.2023.109354
- [16] Y. Wen, M. F. Rahman, H. Xu, and T.-L. B. Tseng, “Recent advances and trends of predictive maintenance from data-driven machine prognostics perspective,” Measurement, Vol.187, Article No.110276, 2022. https://doi.org/10.1016/j.measurement.2021.110276
- [17] F. L. Gewers et al., “Principal component analysis: A natural approach to data exploration,” ACM Comput. Surv., Vol.54, No.4, Article No.70, 2021. https://doi.org/10.1145/3447755
- [18] A. Yang et al., “Data augmentation considering distribution discrepancy for fault diagnosis of drilling process with limited samples,” IEEE Trans. Ind. Electron., Vol.70, No.11, pp. 11774-11783, 2023. https://doi.org/10.1109/TIE.2022.3229274
- [19] H. Fan et al., “An operating performance assessment strategy with multiple modes based on least squares support vector machines for drilling process,” Comput. Ind. Eng., Vol.159, Article No.107492, 2021. https://doi.org/10.1016/j.cie.2021.107492
- [20] C. Zhang, Z.-H. Xu, Y.-Y. Lao, and Y. Li, “Dynamic process fault detection and diagnosis method based on factor analysis: Application on the three-tank system process,” J. Chemom., Vol.38, No.12, Article No.e3627, 2024. https://doi.org/10.1002/cem.3627
- [21] H. Fan et al., “A decentralized operating performance assessment for geological drilling process via multi-block total projection to latent structures and Bayesian inference,” J. of Process Control, Vol.117, pp. 26-39, 2022. https://doi.org/10.1016/j.jprocont.2022.07.005
- [22] S. Du, C. Huang, X. Ma, and H. Fan, “A review of data-driven intelligent monitoring for geological drilling processes,” Processes, Vol.12, No.11, Article No.2478, 2024. https://doi.org/10.3390/pr12112478
- [23] A. Yang et al., “Discrimination and correction of abnormal data for condition monitoring of drilling process,” Neurocomputing, Vol.433, pp. 275-286, 2021. https://doi.org/10.1016/j.neucom.2020.11.064
- [24] J. Liu, H. Xu, X. Peng, J. Wang, and C. He, “Reliable composite fault diagnosis of hydraulic systems based on linear discriminant analysis and multi-output hybrid kernel extreme learning machine,” Reliab. Eng. Syst. Saf., Vol.234, Article No.109178, 2023. https://doi.org/10.1016/j.ress.2023.109178
- [25] H. Fan et al., “Distributed monitoring with integrated probability PCA and mRMR for drilling processes,” IEEE Trans. Instrum. Meas., Vol.71, Article No.3516213, 2022. https://doi.org/10.1109/TIM.2022.3186081
This article is published under a Creative Commons Attribution-NoDerivatives 4.0 Internationa License.