Research Paper:
Design and Implementation of a YOLO-Based Visual Positioning System for Train Static Weighing
Zhenmin Chen*1,*2, Lingfeng Zuo*1,*3,*4, Yiheng Chen*1,*3,*4, Jun Chen*1,*3,*4, Jundong Wu*1,*3,*4,†
 , and Yawu Wang*1,*3,*4
*1School of Automation, China University of Geosciences (Wuhan)
No.388 Lumo Road, Hongshan, Wuhan, Hubei 430074, China
*2Hunan Valin Lianyuan Iron & Steel Co., Ltd.
Huangnitang, Loudi, Hunan 417009, China
*3Hubei Key Laboratory of Advanced Control and Intelligent Automation for Complex Systems
No.388 Lumo Road, Hongshan, Wuhan, Hubei 430074, China
*4Engineering Research Center of Intelligent Technology for Geo-Exploration, Ministry of Education
No.388 Lumo Road, Hongshan, Wuhan, Hubei 430074, China
†Corresponding author

Static weighting process is a critical component of industrial logistics, yet the prevailing approach to train positioning relies on manual visual guidance. This method is suboptimal, resulting in low efficiency and safety risks in harsh environments. To address these limitations, this study proposes a computer-vision-based positioning system for train static weighing. Industrial cameras are utilized to capture real-time images at both ends of the weighbridge, and a lightweight YOLO model is employed to detect couplers, wheels, and endpoints with an accuracy rate exceeding 98%. The process of camera calibration and the implementation of a pixel-world mapping model, founded on the principle of perspective transformation, is instrumental in the computation of the carriage’s actual positional deviation, in turn, serving as a critical guide for the execution of precise parking maneuvers. Empirical evidence from practical deployment indicates that the system enhances weighing efficiency by 75%, while concurrently facilitating fully unmanned, safer operations on site.
Vision-based train positioning
1. Introduction
In industrial enterprises, such as steel plants, the measurement of raw materials and products in and out of the facility is contingent upon the utilization of static rail-weighbridges. The operational efficiency of these bridges directly impacts the smoothness of the entire logistics chain 1,2. The conventional weighing process is predominantly reliant on visual assessment by human operators. These operators are tasked with the responsibility of evaluating the relative position of the train wheels in relation to the reference points of the scale. They must also communicate with the driver periodically via walkie-talkies to provide guidance throughout the parking process. This procedure often necessitates numerous adjustments, leading to substantial time consumption. In addition to inefficiency, personnel are exposed to risks such as mechanical collisions and slips. Furthermore, in harsh industrial environments characterized by precipitation, snow, dust, and noise, labor intensity and health risks are further exacerbated 3,4.
In an effort to circumvent the limitations of conventional methodologies, several studies have proposed the incorporation of sensors, such as lidar and grating rulers, to facilitate automated positioning processes 5. While this method demonstrates relatively high accuracy in an ideal environment, its performance is significantly diminished under conditions of strong light, rain, snow, and other external factors, thereby exhibiting poor environmental adaptability. Moreover, the utilization of these methodologies is often encumbered by a number of significant impediments. These include, but are not limited to, substantial hardware expenditures, intricate installation and debugging processes, and onerous maintenance requirements. Consequently, these factors impede their widespread promotion and application within business enterprises 6,7.
In recent years, computer vision technology has been widely applied in the field of industrial inspection and positioning due to its advantages such as low cost, rich information, and non-contact 8,9. Among them, the You Only Look Once (YOLO) series models have become the mainstream choice for object detection tasks due to their excellent balance between real-time performance and accuracy. In the field of intelligent transportation, YOLO is widely used in vehicle detection, pedestrian recognition, and traffic flow monitoring, capable of processing high-definition video streams in real time and accurately identifying target locations 10,11. In the field of industrial inspection, the YOLO algorithm performs exceptionally well in scenarios such as PCB board defect detection and product surface quality inspection, capable of quickly identifying minute defects and precisely locating them. In addition, in fields such as security monitoring, agricultural automation, and medical image analysis, the YOLO series of algorithms have demonstrated outstanding performance. These successful application cases fully demonstrate the ability of the YOLO algorithm to perform rapid and accurate target detection and location in complex environments 12.
In light of the aforementioned considerations, the present paper proposes a train static weighing and positioning system that utilizes computer image processing. This system aims to address the deficiencies of conventional manual methods with regard to efficiency, safety, and environmental adaptability. The objectives of this system are as follows:
-
A major contribution of this work is the development of a lightweight YOLO-based detection module capable of accurately identifying key train components—including wheels and couplers—under complex industrial conditions, thereby enabling reliable automated positioning.
-
The concept of real-time positioning computing is a recent development in the field of information technology. The designed system calculates the actual distance of the train from its front and rear endpoints in real time through the pixel coordinates of key components using a spatial mapping model.
-
The subject demonstrates a high degree of environmental adaptability. The designed system is capable of stable operation under common light changes and interference from rain and snow, ensuring reliability in different weather conditions and time periods.
-
The model can be deployed with minimal effort. The core algorithm model must be lightweight to facilitate deployment and maintenance in industrial sites with limited computing resources.
Section 2 delineates the train static weighing process and presents the design of the system based on computer image processing. Section 3 provides a comprehensive exposition on the model training configuration and spatial distance mapping methodologies. Section 4 is devoted to the evaluation of the model’s recognition and positioning outcomes. Additionally, a comparative analysis is conducted with traditional guidance methods. In conclusion, a synopsis of the work in this paper is provided.
2. Train Static Weighing Workflow and Vision-Based Positioning Scheme
This section delineates the static weighing and positioning scenario of trains, analyzes the existing problems of traditional guided positioning methods, and finally proposes a computer image processing-based positioning system that achieves efficient and precise real-time train positioning.
2.1. Static Weighing Workflow
In the logistics and metrology systems of steel enterprises, the static rail-weighbridges serve as a critical device for measuring the weight of molten iron, raw materials, or finished products. The fundamental prerequisite for the successful execution of the procedure is the assurance that the train carriage to be weighed must halt within the effective weighing zone of the scale platform (Fig. 1). This is to ensure that all load-bearing wheels are properly positioned on the platform, thereby facilitating the acquisition of precise weight data.
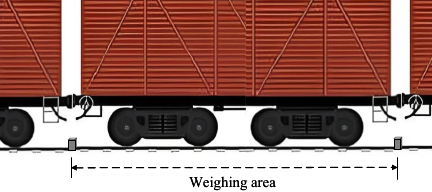
Fig. 1. Scene of train weighing.
The conventional procedure for determining the optimal train stop positioning is typically executed in the following sequence of steps. As the carriage approaches the static rail weighbridge at a gradual rate, the operator must meticulously observe the offset positions of the front and rear wheels of the carriage from the terminal points of the scale. Concurrently, the operator communicates with the train driver in real time via a walkie-talkie, providing continuous guidance to adjust the train’s position until the carriage comes to a halt within the designated weighing range. Subsequently, the operator notifies the control room to initiate the weighing process and record the resulting weight data. On average, the positioning process for each carriage requires between three and five minutes to complete.
The conventional guidance approach is predicated on visual inspection and expert judgment, a method that is suboptimal and frequently necessitates repetitive manipulation of the vehicle compartment. Concurrently, it engenders safety hazards for operators operating in inclement working conditions, including precipitation, extreme cold, elevated temperatures, and auditory distractions. Therefore, in order to achieve efficient and precise guidance of the train static weighing process, this paper proposes a computer image processing-based positioning system to guide the train drivers.
2.2. Vision-Based Positioning Scheme
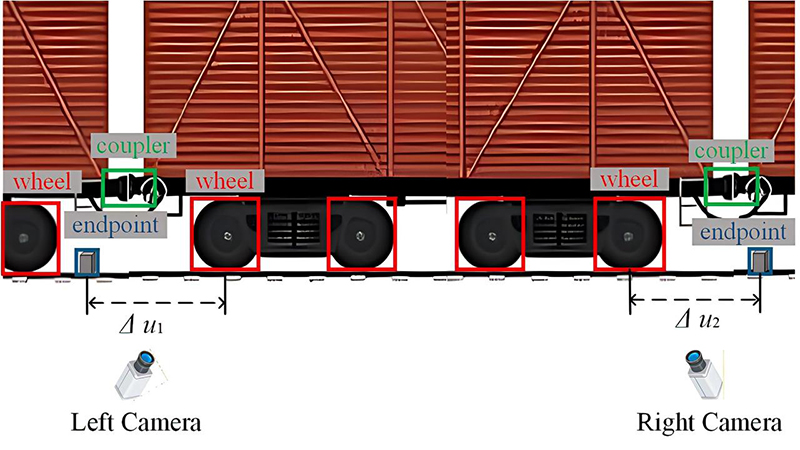
The architecture of the static weighing and positioning system is composed of three primary modules: image acquisition, the YOLO model, and pixel-space mapping, as illustrated in Fig. 2. The image acquisition process entails the installation of two industrial cameras at the front and rear endpoints of the static rail-weighbridges, as illustrated in Fig. 3. These cameras are employed to collect real-time image data during the train’s stop process.
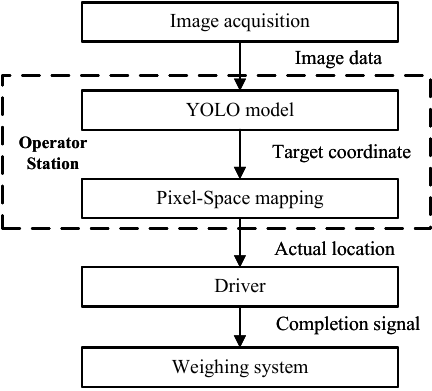
Fig. 2. Positioning scheme workflow.
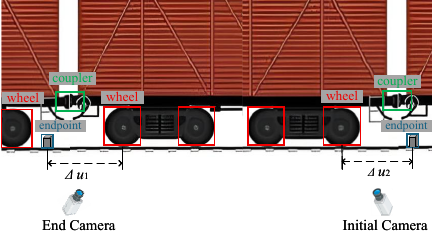
Fig. 3. Vision-based positioning scheme.
The YOLO model and the pixel space mapping model are deployed in the operator station. The operator station is responsible for receiving the image data collected by the camera and initially transmitting it to the trained YOLO model for processing. The YOLO model is responsible for detecting key components such as couplers, wheels, and the endpoint of rail-weighbridges in images, and outputting the bounding box, center coordinates, length and width, and confidence level of each target. Subsequent to passing the confidence threshold, the target coordinates that satisfy this criterion will be transmitted to the pixel-space mapping module as input.
After the pixel-space mapping model receives the coordinates of the key components, it calculates the horizontal pixel differences \(\Delta u_{1}\) and \(\Delta u_{2}\) between the centers of the nearest wheels on the left and right sides of the couplers and the corresponding endpoints, respectively. Then, through the pre-calibrated scale transformation, it converts the pixel differences into the actual distance difference \(\Delta X\), and uses this offset distance to guide the driver for positioning.
Upon determining that the carriage has reached the target position within the preset tolerance range, the operator station transmits a completion signal to the weighing system. Consequently, the weighing system subsequently records the weight data at that particular time.
3. Vision-Based Detection and Spatial Mapping Model
This section provides a detailed exposition on the methodology of positioning models through the utilization of computer vision and the fundamental technologies underlying spatial mapping. First, the construction and enhancement strategies of the dataset must be introduced to provide a high-quality sample foundation for model training. Subsequently, an exposition is required regarding the adopted lightweight detection model and its optimized training process. A coordinate mapping model has been developed that establishes a relationship between image pixels and the physical space. This model provides a theoretical basis and computational framework for the core positioning function.
3.1. Dataset Construction
The data presented in this article is derived from authentic surveillance footage of the static balance site of a specific steel enterprise. To ensure the usability and robustness of the model in an engineering environment, the image dataset encompasses a variety of carriages, as well as different lighting and weather conditions.
In order to enhance the robustness of the model in complex sites, non-local mean denoising is adopted for images with obvious noise points to suppress noise while retaining detailed features such as couplings and wheels as much as possible. The elimination of frames that are out of focus or have severely missing information is imperative to prevent poor-quality samples from affecting model training.
In order to enhance the model’s adaptability to changes in perspective, scale, and illumination, a series of data augmentation strategies have been adopted.
-
The random rotation angle has been set to \(15°\) to simulate the scenario in which the camera exhibits slight deflection in the actual scene.
-
The random translation range is set to 20% of the image size, covering the normal deviation range of the front and back positions of the carriages when they are parked. This improves the positioning accuracy of the model under the offset of the camera position.
-
The random scaling amplitude has been set to 50%, and the scale variation simulates imaging at varying distances between the carriage and the camera, thereby enhancing the model’s detection capability for carriages at different distances.
-
The horizontal flipping probability is set to 0.5 to simulate the actual working condition of bidirectional travel of the on-site carriages.
-
A perturbation of 30% is applied to the brightness channel. This parameter setting has been demonstrated to enhance the model’s capacity to simulate lighting changes at various times on site, thereby improving its stability in different lighting environments.
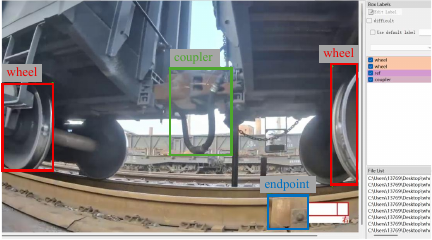
Fig. 4. Image annotation of key components of trains.
The dataset constructed in this paper covers a variety of common railway freight car models found in the field, including open wagons C70, C64, covered wagons P70, P64. The data samples are evenly distributed among different models to ensure that the model can learn the common features of different vehicle body structures rather than relying on the specific appearance of a single model.
As illustrated in Fig. 4, the annotations have been meticulously labeled using the LabelImg tool. Rectangular bounding boxes for couplers cover the visible main structure, while wheel and weighbridge-endpoint annotations follow the external contours to ensure positional-reference consistency and stability for the subsequent pixel-space mapping. Annotation files are stored in YOLO text format, with each image linked to a .txt annotation file of the same name.
3.2. Training Parameter Configuration
In light of the dual demands for real-time performance and accuracy in the train weighing scenario, the YOLO series of object detection algorithms, with their excellent reasoning speed and high-precision performance, have become the ideal choice for this study 13. The algorithm under consideration adopts a single-stage detection architecture, a design choice that has been demonstrated to significantly reduce computational complexity while maintaining a high detection accuracy rate. This architecture has been shown to effectively balance the requirements of detection speed and recognition accuracy.
As demonstrated in Table 1, this study examines the parameter scales and average inference delays of four models: YOLOv12n, YOLOv12s, YOLOv13n, and YOLOv13s. The parameter quantities of YOLOv12n and YOLOv13n are 2.6M and 2.5M, respectively, and the inference delays are 1.83 ms and 1.97 ms, respectively. The parameter numbers of YOLOv12s and YOLOv13s are 9.3M and 9.0M, respectively, and the delays are 2.82 ms and 2.98 ms, respectively. In the aforementioned model, this paper ultimately selects YOLOv13n as the detector. This model builds upon the high-speed advantages of the single-stage detection of the YOLO series, enhancing the balance between computational efficiency and accuracy through the introduction of a more efficient network structure and model optimization strategy 15. Its parameter count is 2.5M, which makes it the lightest version among the models that were compared. This approach has been shown to markedly reduce demand for hardware resources and is particularly well-suited for deployment and inference in the edge environment of train weighing.
Table 1. Model parameter quantity and latency 14.

3.3. Pixel-to-World Spatial Mapping
After the model calculates the pixel coordinates of the key components, it needs to convert the pixel coordinates to physical coordinates to obtain the actual distance. This paper adopts Zhang’s checkerboard calibration method 16 to capture multiple checkerboard images with known grid point spacings in different postures. By optimizing the camera model parameters, the focal lengths \(f_{x}\), \(f_{y}\), principal point offsets \((c_{x},c_{y})\), as well as the internal parameter matrix \(\textbf{K}\) and the external parameter matrix \([ \textbf{R}|t ]\) are calculated. Map the point \(p=(u,v)^{T}\) in the pixel coordinate system to the point \(P_{w}=(X_{w},Y_{w},Z_{w})^{T}\) in the world coordinate system.
In the train positioning scenario, the track, the endpoint of the rail-weighbridges, and the centers of the wheels can be approximately regarded as being in the same plane \(Z=0\). In this case, the world coordinate system takes this plane as the reference. In this particular instance, it is imperative that the pixel coordinates of the detected wheel be designated as \(p_{\mathrm{wheel}}\). Therefore, it can be concluded that the pixel coordinates of the endpoint are equal to \(p_{\mathrm{end}}\), and that \((u_1, v_1) = (u_2, v_2)\). The pixel coordinates of the endpoint be \(p_{\mathrm{end} }=(u_{2},v_{2})\). Subsequently, the pixel difference, denoted by the symbol \(\Delta u =u_{1}-u_{2}\), is examined. Due to the perspective relationship between the orbital plane and the image plane, it is necessary to introduce the homography matrix, denoted by H.
The solution to the inverse transformation of H enables the mapping of pixel coordinates to world coordinates. In the context of engineering implementation, the calculation of the pre-calibrated scale factor, denoted by \(s\), is simplified through direct measurement of this factor by the calibration plate at its actual position on the track.
The integration of the pixel space mapping model into the operator station positioning system is paramount. The processing of the wheel and endpoint pixel positions detected by YOLO in real time is essential for the output of the actual distance, which will guide the driver to stop.
In the actual deployment, we measured the end-to-end latency of the system. From the start of image acquisition by the industrial camera to the output of the final distance, data are calculated and sent every 0.2 s. The maximum delay measured is 291 ms, the minimum delay is 182 ms, and the average delay is 246 ms.
4. Experimental Results and Analysis
This section delineates the recognition and positioning effects of the trained YOLOv13n model through a comparative analysis with traditional manual methods. The analysis demonstrates the advantages of this system in terms of efficiency, accuracy, and safety.
4.1. Model Performance Evaluation
The trained YOLOv13n model is verified. With regard to the configuration of the training process, the dataset comprised 812 images from diverse environments, and a cosine annealing learning rate scheduler was employed. The batch size was set to 64, and the number of training epochs was 300. For the detection results, we conducted quantitative verification using the intersection over union (IoU) and mean average precision (mAP) metrics 17.
IoU represents the degree of overlap between the predicted bounding box and the ground truth bounding box, as shown in the following formula:
The mAP over IoU thresholds is defined as the mean of the average precision of each category when it exceeds the IoU threshold. For instance, mAP75 denotes the average precision when the IoU threshold is set to 0.75, thereby signifying the detection capability in scenarios where the conditions are relatively relaxed 19. Conversely, mAP50-95 represents the mean of the average accuracy of each category when the step size is fixed at 0.05 within the threshold range spanning from 0.5 to 0.95, thus reflecting the detection capability under stringent conditions.
Precision is defined as the proportion of true positive examples in predicting positive samples.
Recall is defined as the proportion of true positive samples that are correctly detected, reflecting the risk of missed detections:
The performance of the model on the test set is shown in Table 2. The YOLOv13n model demonstrates a high degree of accuracy and recall in detecting the three key targets, with accuracy rates exceeding 98%. When the mAP value is set to 0.75, the model exhibits a coverage rate of over 95% for all three targets.
Table 2. Recognition result of the YOLOv13n model.

Table 3. Confusion matrix of YOLOv13n predictions.

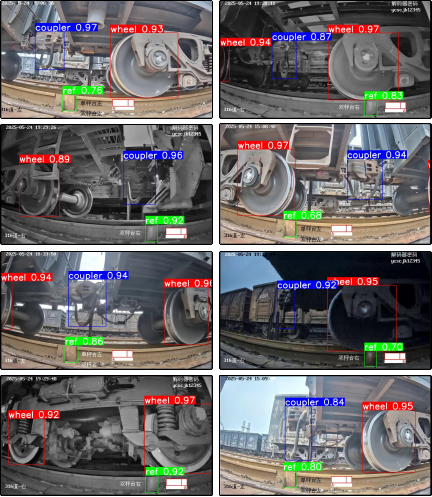
Fig. 5. Prediction results in different environments.
As illustrated in the confusion matrix in Table 3, the YOLOv13n model demonstrates a high degree of accuracy in its identification of vehicle components. Specifically, the model correctly identifies 99 out of 101 samples in the coupler category, 170 out of 173 samples in the wheel category, and 160 out of 161 samples in the endpoint class category. As illustrated in Fig. 5, the YOLOv13n model demonstrates a high degree of accuracy in recognizing train components across diverse environmental settings. These findings substantiate the model’s proficiency in detecting objects with remarkable precision, thereby validating its suitability for real-time situational awareness in railway operations.
4.2. Evaluation of Model Generalization Ability
To verify the robustness of the model under different lighting conditions, we newly collected 60 images for each of the three typical scenarios: daytime, weak light in the evening, and auxiliary lighting at night. As shown in Table 4, the mAP@0.75 in all three lighting conditions remained above 94%, indicating its good adaptability to lighting conditions. Although the recall rate in the nighttime scenario slightly decreased, it still exceeded 97%, meeting the reliability requirements for engineering applications.
Table 4. Model performance under different lighting conditions.

Table 5. The generalization ability on the new car.

To evaluate the generalization ability of the model for untrained vehicle models, this paper collected 50 images each for two new vehicle models, NX17 and GN70, to form a new test set. As shown in Table 5, the model achieved an overall recognition accuracy of 94% for key components on this test set, a recall rate of 95%, and an mAP@0.75 of 92%, indicating that the proposed method has good cross-model generalization ability.
4.3. Mapping Distance Error Measurement
To evaluate the positioning accuracy of the spatial mapping model, nine markers were set at 20 cm intervals on the track, with the center point as the coordinate origin. The actual distances of each point were known. The distances from each point to the origin were calculated using the spatial mapping model and compared with the actual values to obtain the positioning errors. Table 6 lists the model-calculated distances, actual distances, and absolute errors at each marker point for the left camera of a certain lane. The results show that the maximum error is no more than 7 cm.
Table 6. Comparison of calculated and actual distances for the left camera (unit: cm).

During the low-speed movement of the train, such as when the speed is below 3 kilometers per hour, since the motion blur can be ignored and the system sampling frequency is high, the above static calibration error is consistent with the positioning accuracy during slow dynamic operation.
4.4. Comparison with Traditional Manual Methods
A comparison was made between the visual positioning system and the traditional pure manpower guidance method in terms of efficiency, safety, and environmental adaptability. As demonstrated in Table 7, the mean duration for a solitary weighing executed by the conventional manual method is 3.5 min. In contrast, the mean duration for a single weighing executed by the visual positioning system is 2 min, thereby exhibiting an efficiency enhancement of approximately 75%. The system has achieved unmanned operation on site, thereby mitigating the safety risks associated with working in proximity to the railway and eliminating the need for personnel to work in inclement weather conditions, such as rain, snow, and dusty weather.
Table 7. Comparison with the traditional method.

5. Conclusions
Aiming at the low efficiency and safety risks inherent in traditional train static weighing, which depends heavily on manual visual positioning, this paper proposes and implements a computer-vision-based positioning system with several key contributions. First, industrial cameras are deployed at both ends of the weighbridge to continuously capture real-time images of critical train components. Second, a multi-environment dataset is constructed, and a lightweight YOLOv13n model is trained to achieve robust real-time detection of couplers, wheels, and weighbridge endpoints. Third, camera parameters are calibrated using the Zhang’s method, and a homography-based pixel-to-world spatial mapping model is established to compute accurate carriage-scale positional deviations, enabling automated and precise parking guidance. Experimental results demonstrate that the proposed system improves single-vehicle weighing efficiency by approximately 75% compared with manual operation. Moreover, it enables fully unmanned on-site positioning and significantly reduces safety hazards for industrial personnel, highlighting its practical value for intelligent logistics systems.
Acknowledgments
This work was supported in part by the Fundamental Research Funds for the Central Universities, China University of Geosciences (Wuhan) under Grant CUG240634, and in part by the 111 project under Grant B17040.
- [1] Z. Chen, Q. Wang, K. Yang, T. Yu, J. Yao, Y. Liu, P. Wang, and Q. He, “Deep learning for the detection and recognition of rail defects in ultrasound B-scan images,” Transportation Research Record, Vol.2675, No.11, pp. 888-901, 2021. https://doi.org/10.1177/03611981211021547
- [2] Y. Tang, and Y. Qian, “A boiler heating surface overtemperature high-speed railway track components inspection framework based on YOLOv8 with high-performance model deployment,” High-speed Railway, Vol.2, No.1, pp. 42-50, 2024. https://doi.org/10.1016/j.hspr.2024.02.001
- [3] V. Skrickij, D. Shi, S. Ricci, L. Rizzetto, and G. Bureika, “Visual measurement system for wheel-rail lateral position evaluation,” Sensors, Vol.21, No.4, Article No.1297, 2021. https://doi.org/10.3390/s21041297
- [4] J. Hu, P. Qiao, H. Lv, L. Yang, A. Ouyang, Y. He, and Y. Liu, “High speed railway fastener defect detection by Using improved YOLOx-nano model,” Sensors, Vol.22, No.21, Article No.8399, 2022. https://doi.org/10.3390/s22218399
- [5] J. Wu, “Traffic sign detection in autonomous driving: Optimization choices for YOLO models,” Proc. of the 5th Int. Conf. on Advances in Electrical Engineering and Computer Applications, 2024. https://doi.org/10.1109/AEECA62331.2024.00097
- [6] S. Li and H. Yoon, “Vehicle localization in 3D world coordinates using single camera at traffic intersection,” Sensors, Vol.23, No.7, Article No.3661, 2023. https://doi.org/10.3390/s23073661
- [7] X. Li, Q. Wang, X. Yang, K. Wang, and H. Zhang, “Track fastener defect detection model based on improved YOLOv5s,” Sensors, Vol.23, No.14, Article No.6457, 2023. https://doi.org/10.3390/s23146457
- [8] L. Kang, Z. Lu, L. Meng, and Z. Gao, “Multi-source information fusion deep self-attention reinforcement learning framework for multi-label compound fault recognition,” Expert Systems with Applications, Vol.237, Part B, 2024. https://doi.org/10.1016/j.mechmachtheory.2022.105090
- [9] Y. Huang, Q. Chai, and W. Wang, “Modified YOLO network for symptom detection in panoramic oral roentgenogram,” Proc. of the 43rd Chinese Control Conf., Kun Ming, 2024. https://doi.org/10.23919/CCC63176.2024.10661828
- [10] S. Dadjouy and H. Sajedi, “Gallbladder cancer detection in ultrasound images based on YOLO and faster R-CNN,” Proc. of the 10th Int. Conf. on Artificial Intelligence and Robotics, 2024. https://doi.org/10.1109/QICAR61538.2024.10496645
- [11] Z. Zhai, H. Sun, J. Zhao, Z. Dong, S. He, and H. Zhao, “Displacement generating module based end-to-end micro-expression recognition network,” 2021 IEEE Int. Conf. on Systems, Man, and Cybernetics, 2021. https://doi.org/10.1109/SMC52423.2021.9658691
- [12] D. Yang, M. Solihin, L. Ardiyanto, Y. Zhao, W. Li, B. Cai, and C. Chen, “A streamlined approach for intelligent ship object detection using EL-YOLO algorithm,” Scientific Reports, Vol.14, pp. 15254-15270, 2024. https://doi.org/10.1038/s41598-024-64225-y
- [13] Y. Luo, X. Wang, Y. Liao, Q. Fu, C. Shu, Y. Wu, and Y. He, “A review of homography estimation: Advances and Challenges,” Electronics, Vol.12, No.24, Article No.4977, 2023. https://doi.org/10.3390/electronics12244977
- [14] S. Ranjan, F. Marco, Q. Rizwan, B. Chetan, N. Upesh, and P. Alwin, “YOLO advances to its genesis: A decadal and comprehensive review of the You Only Look Once (YOLO) series,” Artificial Intelligence Review, Vol.58, Article No.274, 2025. https://doi.org/10.1007/s10462-025-11253-3
- [15] M. Lei, S. Li, Y. Wu, H. Hu, Y. Zhou, X. Zheng, G. Ding, S. Du, Z. Wu, and Y. Gao, “YOLOv13: Real-time object detection with hypergraph-enhanced adaptive visual perception,” arXiv:2506.17733, 2025. https://doi.org/10.48550/arXiv.2506.17733
- [16] Z. Zhang, “A flexible new technique for camera calibration,” IEEE Trans. on Pattern Analysis and Machine Intelligence, Vol.22, No.11, pp. 1330-1334, 2000. https://doi.org/10.1109/34.888718
- [17] Y. Feng, J. Huang, S. Du, S. Ying, J.-H. Yong, Y. Li, G. Ding, R. Ji, and Y. Gao, “Hyper-YOLO: When visual object detection meets hypergraph computation,” IEEE Trans. on Pattern Analysis and Machine Intelligence, Vol.47, No.4, pp. 2388-2401, 2025. https://doi.org/10.1109/TPAMI.2024.3524377
- [18] S. Ruan, C. Zhan, B. Liu, and Q. Wan, “Surface defect detection on bolt surface using a real-time fine-tuned YOLOv6 model,” J. of Big Data, Vol.12, No.1, pp. 226-252, 2025. https://doi.org/10.1186/s40537-025-01226-2
- [19] X. Yang, Y. Chen, L. Wu, and J. Zhao, “YOLO-VMTC: Enhancing steel surface defect detection with a lightweight and context-aware deep learning approach,” J. of Electrical Systems, Vol.20, No.4, pp. 6096-6108, 2024.
This article is published under a Creative Commons Attribution-NoDerivatives 4.0 Internationa License.