Research Paper:
Intelligent Evaluation Algorithm for English Teaching Quality Based on HMIPSO-Optimized BP Neural Networks
Feng Liu†
Maritime College, Hainan Vocational University of Science and Technology
No.18 Qiongshan Avenue, Meilan District, Haikou City, Hainan 571126, China
†Corresponding author

Traditional methods for assessing English teaching quality in higher education have gradually revealed their limitations, failing to reflect the dynamic changes comprehensively and accurately in the teaching process and the multidimensional nature of teaching outcomes. This study proposes an English teaching quality evaluation model based on the combination of a hybrid multi-strategy improved particle swarm optimization (HMIPSO) and backpropagation (BP) neural network. A teaching quality evaluation system is constructed using teaching content, teaching methods, and teaching outcomes. Experimental results show that the HMIPSO-BP model outperforms the traditional BP neural network model, with the mean squared error reduced by approximately 27.8% and the minimum error decreased by approximately 28.2%. This approach significantly reduces computation time while maintaining evaluation accuracy. The proposed method provides a novel and effective technical pathway for monitoring and improving the quality of English teaching in higher education.
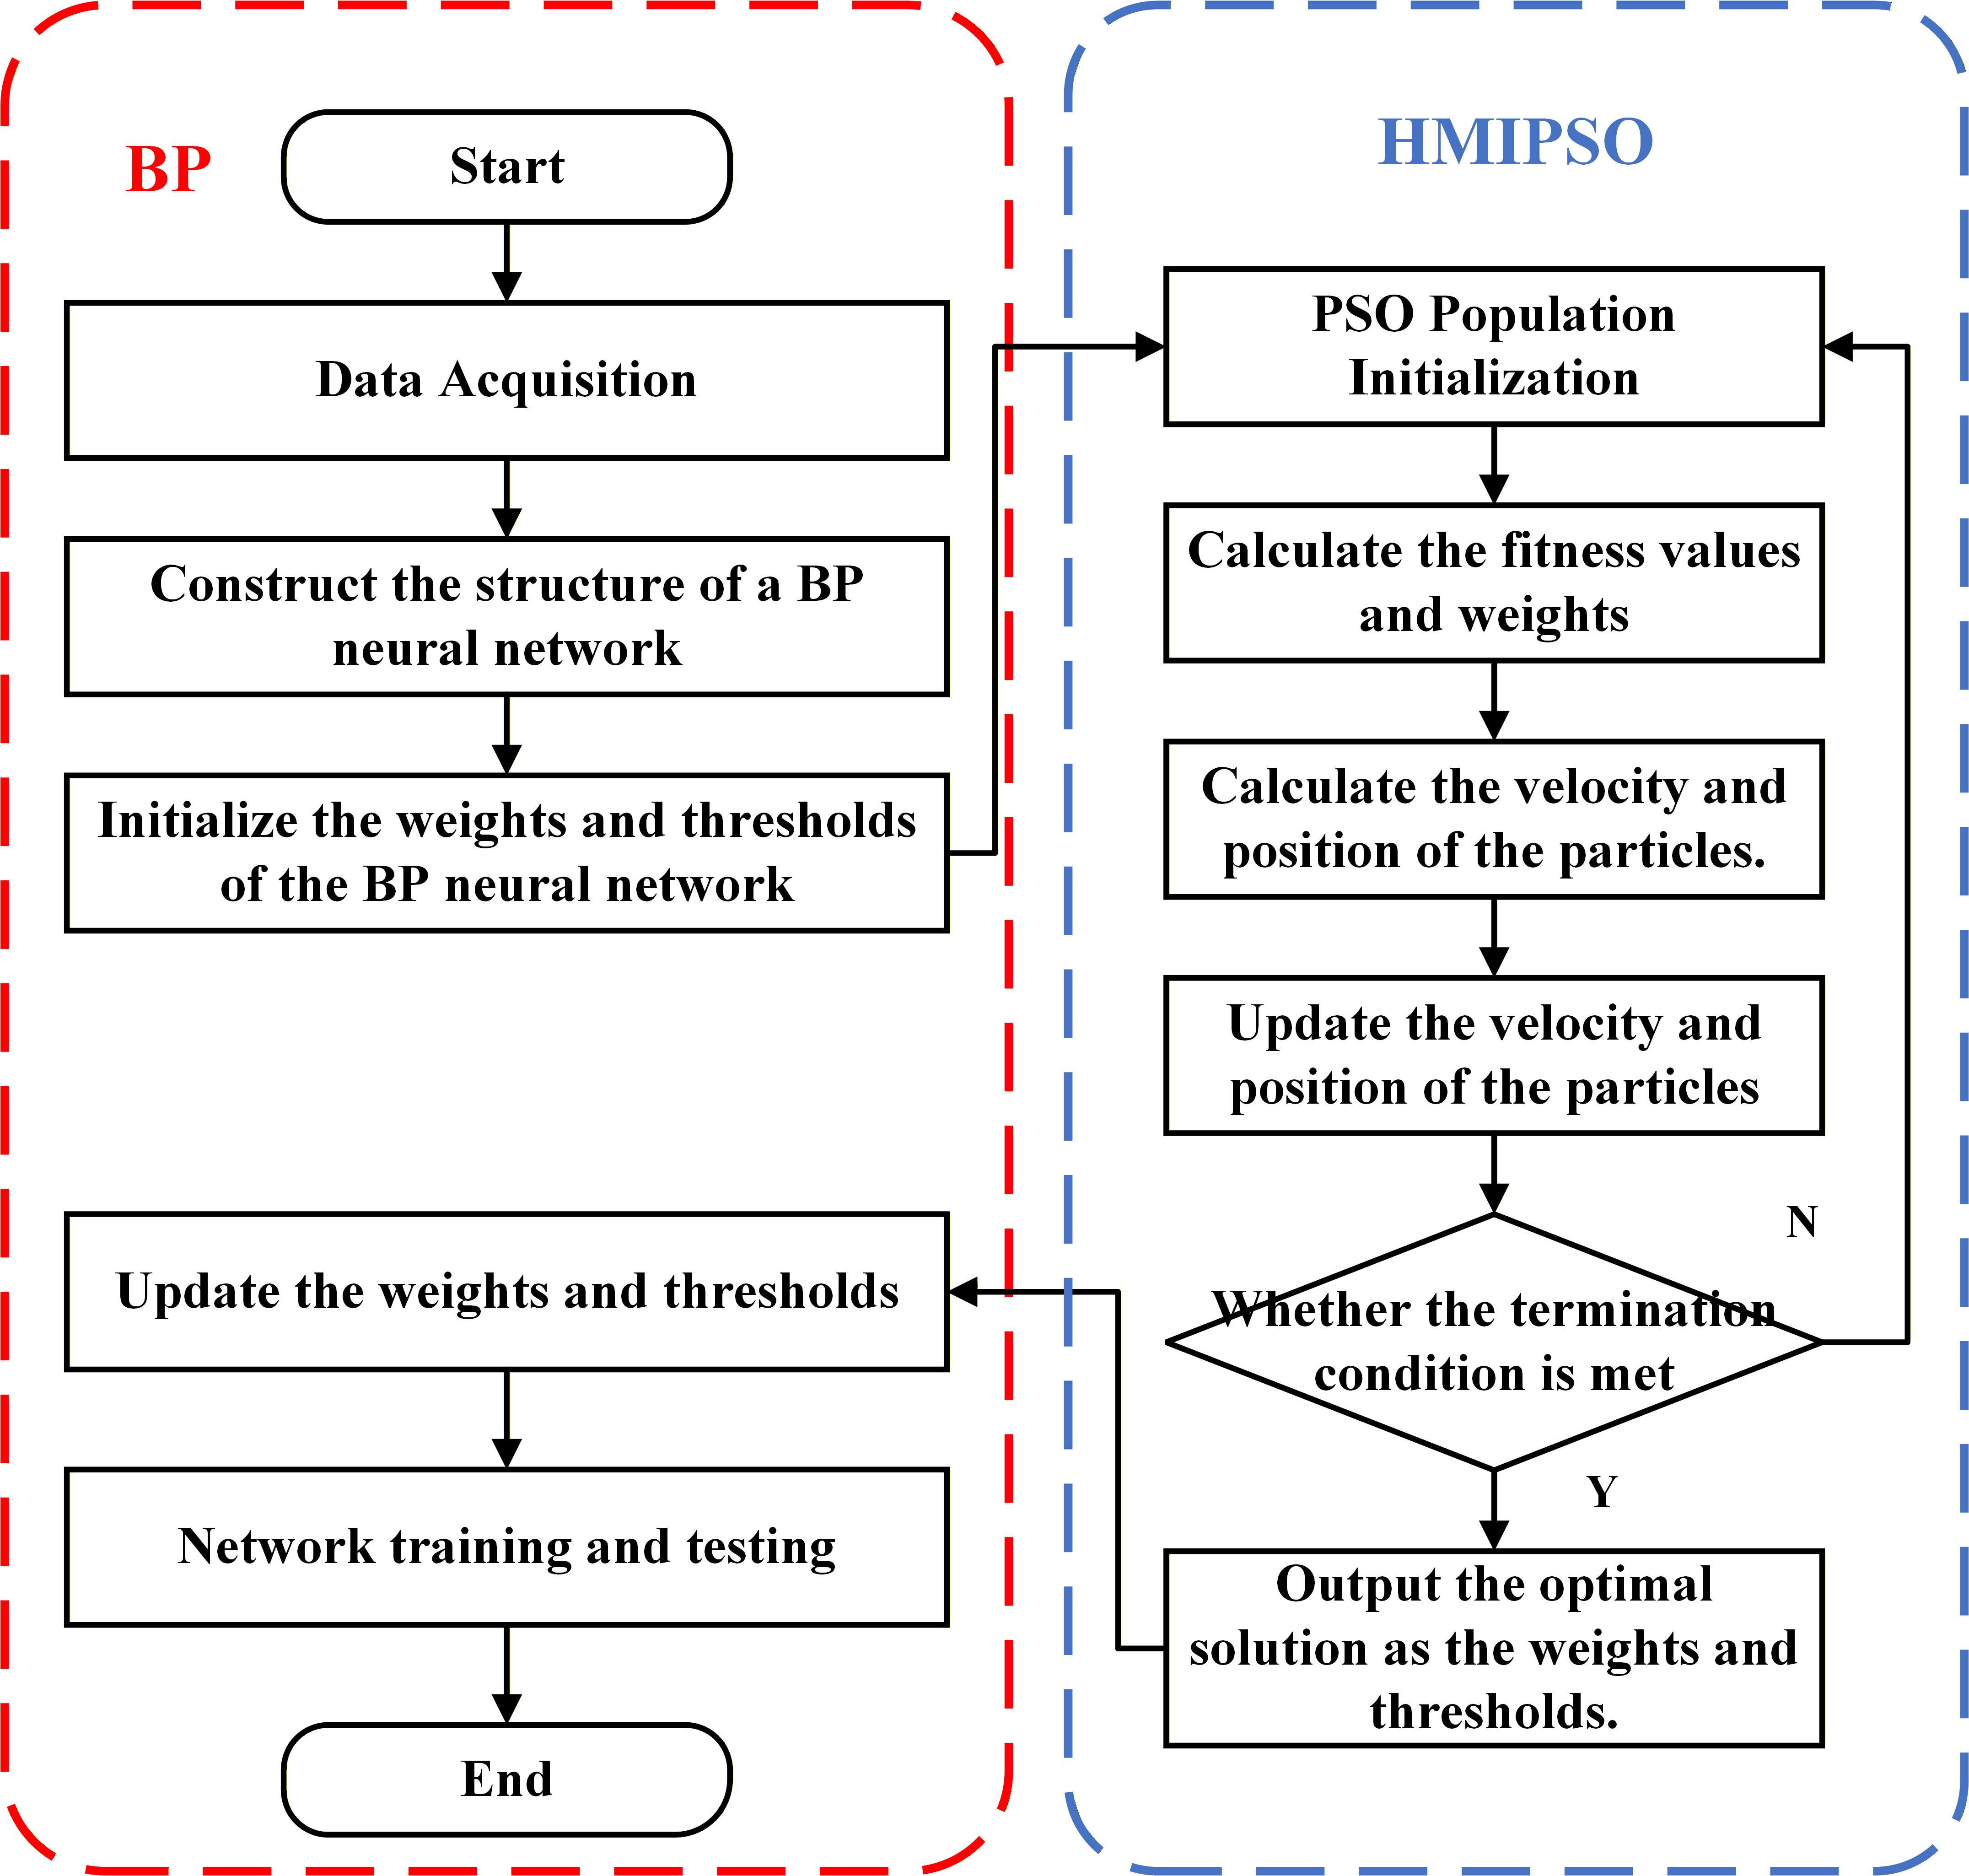
Flowchart of HMIPSO-BP algorithm
1. Introduction
Enhancing higher education quality is central to national talent strategies, and teaching quality directly affects discipline-based education and students’ overall competencies 1. In higher education, English teaching, language skills, cultural awareness, and academic application together form a multidimensional evaluation framework; however, traditional methods relying on summative exams and static surveys fail to capture dynamic skill development, interaction effectiveness, and learning adaptability, creating a gap between evaluation outcomes and actual teaching quality. Therefore, constructing an evaluation paradigm that integrates diagnostic, developmental, and process-oriented approaches is essential for advancing English teaching reform and achieving “assessment-driven teaching.” Meanwhile, rapid AI development has driven significant progress across fields 2, making it necessary to integrate teaching quality evaluation with modern information technologies, such as big data and artificial intelligence, to meet current development needs 3. The academic lineage of teaching evaluation dates back to the 1920s, with Hymes’s (1927) studies first establishing systematic theories of validity and reliability and laying the methodological foundation for modern educational assessment.
Various discipline-specific teaching quality evaluation methods have been developed to enhance instructional effectiveness 4. Zhao et al. 5 developed a 35-item blended evaluation scale for nursing undergraduates based on a model. Xia 6 proposed a multi-attribute decision-making model for Chinese language teaching using fuzzy TODIM, EDAS, and CRITIC techniques. Chen et al. 7 designed a BP-CM model for IoT hardware courses to address delayed feedback by integrating BOPPPS, PAD, and memory strategies to optimize teaching. Liu et al. 4 developed a CIPP-based evaluation framework combining the PLS-SEM and ANN methods to analyze the factors affecting business school faculty quality.
Scholars have applied big data technologies to evaluate teaching quality. Chang et al. 8 combined feature fusion, ReliefF, and improved PageRank algorithms to enhance information dissemination, teaching flow, and course analysis. Zhang et al. 9 developed a model using a genetic algorithm and neural networks to improve prediction accuracy over traditional models. Li et al. 10 introduced a monitoring system using facial recognition and RF cards for real-time tracking, and optimized teaching supervision. Sun and Jiang 11 designed a sports industry evaluation model using \(k\)-means and an improved ant colony algorithm and achieved an accuracy of 98.4%. Li and Zhang 12 applied the \(k\)-means and Apriori algorithms to create a more efficient teaching quality evaluation model.
Teaching quality evaluation is a fuzzy nonlinear problem that significantly affects assessment accuracy 13. With the development of artificial intelligence, scholars have continuously improved teaching evaluation methods. Techniques such as fuzzy analytic hierarchy process 14,15, analytic hierarchy process 16,17, decision tree methods 18, support vector machines 19, \(k\)-means clustering algorithms [20–22], and data mining algorithms 23 have been widely applied to enhance the accuracy of teaching quality evaluation.
Although existing methodologies address the relationship between teaching quality and evaluation indicators, structural flaws and insufficient rigor limit assessment validity. Backpropagation (BP) neural networks 24, known for their nonlinear mapping capabilities, are increasingly used in teaching quality evaluation because they can learn complex input–output relationships for pattern recognition and prediction 25. However, issues such as slow convergence, weak generalization, and poor prediction accuracy owing to gradient descent learning persist. To address these issues, this study adopts a hybrid multi-strategy improved particle swarm algorithm to optimize the BP network weights and thresholds, enhance the evaluation accuracy, and ensure that the output closely matches the desired vector [26–29].
2. Methodology
2.1. BP Neural Network
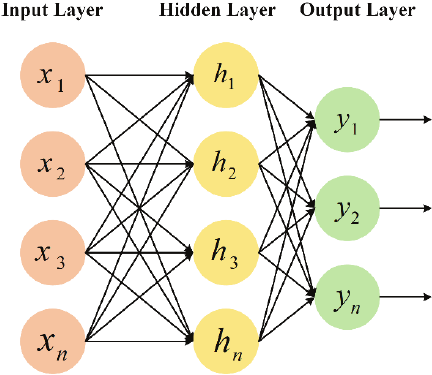
Fig. 1. BP neural network structure diagram.
The BP neural network is a multilayer feedforward neural network based on the gradient descent method.
The network propagates the input signals forward, calculates the output error, and then adjusts the connection weights between the neurons in each layer using backpropagation of the error to minimize the difference between the predicted output and the actual target. This process enabled the approximation of complex functions and pattern recognition. The structure of the BP neural network, as shown in Fig. 1, consists of two stages: forward propagation and backward propagation.
The forward propagation process is illustrated by Eqs. \(\eqref{eq:1}\) and \(\eqref{eq:2}\), where Eq. \(\eqref{eq:1}\) represents the process of transmission from the input layer to the hidden layer, and Eq. \(\eqref{eq:2}\) represents the transmission from the hidden layer to the output layer.
The BP process was used to update the connection parameters, as expressed by the following equations. Eqs. \(\eqref{eq:3}\) and \(\eqref{eq:4}\) represent the update processes for the output and hidden layer parameters, respectively.
2.2. Hybrid Multi-Strategy Improved Particle Swarm Optimization (HMIPSO)
Particle swarm optimization (PSO) mimics bird flock behavior in which particles adjust their positions based on personal and group experiences to find an optimal solution using collective intelligence to solve complex optimization problems.
In PSO, each solution is referred to as a “particle.” The particle flies through the solution space and updates its velocity and position by tracking both its individual best solution (\(pbest)\) and the best solution of the group (\(gbest)\). The mathematical formulae are as follows:
Equations \(\eqref{eq:5}\) and \(\eqref{eq:6}\) represent the velocity and position update formulas, respectively. In these equations, \(\nu_i^t\) is the velocity of the \(i\)-th particle at the \(t\)-th iteration, \(x_i^t\) is the position of the \(i\)-th particle at the \(t\)-th iteration, \(\omega\) is the inertia weight, \(c_1\) and \(c_2\) are the learning factors, \(r_1\) and \(r_2\) are random numbers, \(\textit{pbest}_i\) is the historical best position of the \(i\)-th particle, and \(\textit{gbest}\) is the historical best position of the group.
2.2.1. Gaussian Perturbation Particle Update Mechanism
To enhance the global convergence ability of the PSO algorithm and avoid premature convergence, a dynamic learning factor and an adaptive inertia weight adjustment mechanism were introduced. By dynamically adjusting the parameters, the algorithm search process gradually transitioned from a global wide search to a local deep search, achieving an intelligent balance between the breadth and depth of the search. The learning factors \(c'_1\) and \(c'_2\) as well as the inertia weight \(\omega'\) are given by Eqs. \(\eqref{eq:7}\)–\(\eqref{eq:9}\) 31.
Here, \(\textit{it}\) represents the current iteration count and \(\textit{Maxit}\) represents the maximum number of iterations.
In the velocity update mechanism of the PSO algorithm, Gaussian noise perturbation was introduced to enhance the random exploration ability, effectively suppress premature convergence. A standard normal distribution \(N(0,1)\) was used to represent the Gaussian noise component. Under this strategy, the velocity update mechanism for the particles is given by Eq. \(\eqref{eq:10}\):
2.2.2. Nonlinear Convergence Factor
The convergence factor needs to facilitate a good global search in the early stages and an effective local search in the later stages to balance the relationship between the local and global searches. Therefore, this study introduced the nonlinear convergence factor proposed by Lei et al. 32. This convergence factor is a monotonically decreasing function, where it gradually decreases in the early iterations to enhance the global search and decreases rapidly in the later iterations to improve the local search. The convergence factor is given by Eq. \(\eqref{eq:11}\):
Here, \(\iota\), \(\varsigma\), and \(\nu\) are the tuning parameters whose values were determined through mathematical experiments conducted using MATLAB software. In this study, \(\iota=2\), \(\varsigma=0.48\), and \(\nu=6\). Fig. 2 shows the search process curves of the nonlinear convergence factor introduced in this study compared with those of the linear convergence factor.
In PSO, a Cauchy mutation is introduced to enhance the global search capability of the algorithm. The Cauchy mutation introduces random perturbations based on the Cauchy distribution, allowing particles to explore the search space more broadly. This helps prevent the algorithm from falling into local optima, thereby improving its global optimization ability and accuracy. The probability density function of the Cauchy distribution is expressed as follows:
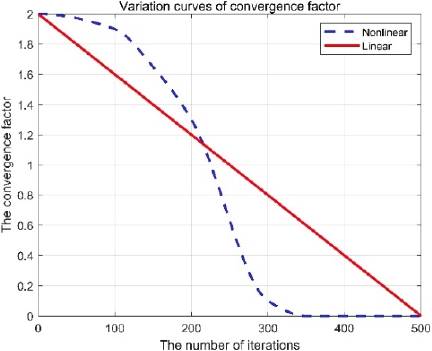
Fig. 2. Comparison diagram of convergence curves.
By combining the nonlinear convergence factor with the Cauchy mutation strategy, the updated PSO position formula is as follows:
2.3. Design of the HMIPSO-BP Model
By combining HMIPSO with BP, HMIPSO is used to optimize the weights and thresholds of the BP network, effectively avoiding the local minimum problem in the gradient descent method through global search. The HMIPSO algorithm simulates the social behavior of particle swarms by adjusting the positions of the particles based on their individual and global best solutions. It iteratively updates the neural network parameters, accelerates the convergence, and improves the model accuracy. Based on research by Han et al. 33, the specific process is as follows:
-
(1)
Construct the HMIPSO-BP model using the teaching quality evaluation indicators from the training set as inputs.
-
(2)
Randomly generate a set of individuals, each representing the initial thresholds of the neural network. The length of each individual is equal to the total number of individuals and sum of the neural network thresholds. The calculation formula is as follows:
\begin{equation} \label{eq:14} n=R\times S_1+S_1\times S_2+S_1+S_2, \end{equation}where \(n\) represents the encoding length of the neural network, \(S_1\) is the number of hidden layer nodes, \(S_2\) is the length of the output vector, and \(R\) is the length of the input vector. -
(3)
Determine the fitness function as follows:
\begin{equation} \label{eq:15} f=\dfrac{1}{E+1}E=\dfrac{1}{2}\sum_{k=1}^n \left(d_k-o_k\right)^2, \end{equation}where \(d_k\) and \(o_k\) represent the expected and actual outputs for \(k\) sets of data, respectively. Each individual was evaluated based on an effective performance value.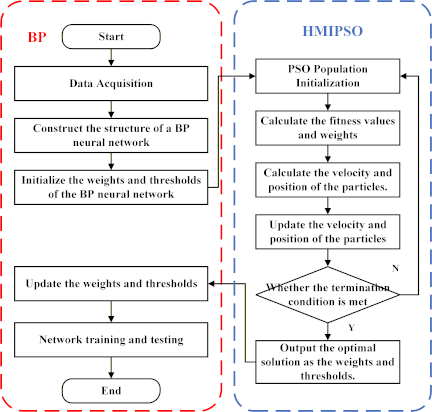
Fig. 3. Flowchart of HMIPSO-BP algorithm.
-
(4)
Update the particle’s velocity and position. The velocity and position of the particle are updated based on the fitness value of the particle and current best solution. Specifically, the velocity was updated using Eq. \(\eqref{eq:10}\), and the position was updated using Eq. \(\eqref{eq:12}\).
-
(5)
Update the inertia weight using Eq. \(\eqref{eq:9}\). When \(\omega\) is large, the particle has strong global and local optimization abilities; when \(\omega\) is small, the global optimization ability is weak; however, the local optimization ability is stronger.
-
(6)
Check whether the termination condition is satisfied. After each iteration, check whether the current error has reached the expected minimum value or if the maximum number of iterations has been reached. If either condition is satisfied, stop; otherwise, return to Steps \(\eqref{eq:4}\) and \(\eqref{eq:5}\) for further optimization.
-
(7)
The individual with the maximum fitness obtained after the iteration is selected as the final solution, providing optimized weights and thresholds.
-
(8)
Use the optimized weights and biases as initial values, and train the BP network until the maximum number of iterations is reached.
The flowchart of the HMIPSO-BP algorithm is shown in Fig. 3.
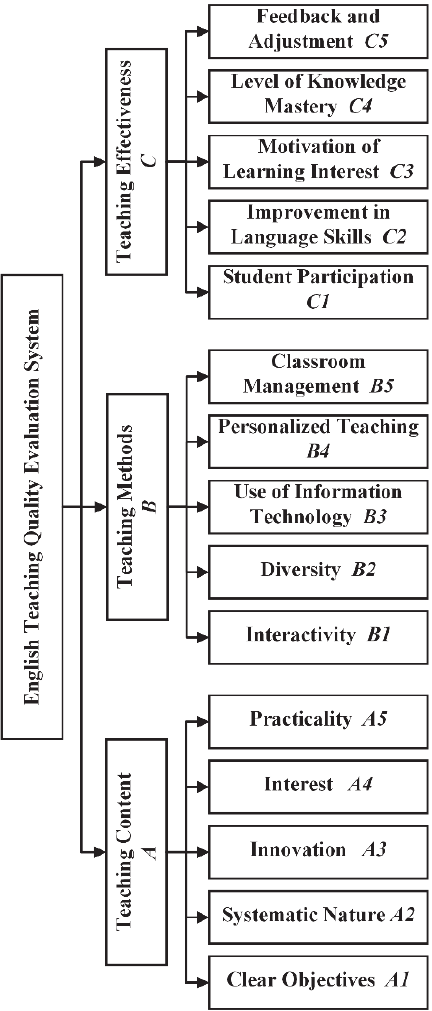
Fig. 4. English teaching quality evaluation index system.
3. Construction of an English Teaching Quality Assessment Index System
3.1. System Construction
As shown in Fig. 4, the English classroom teaching quality evaluation system developed in this study follows the context–input–process–product (CIPP) framework and draws upon established research on higher education quality assurance.
It comprises three primary dimensions, Teaching Content, Teaching Methods, and Teaching Effectiveness, as well as 15 corresponding secondary indicators. Each secondary indicator was operationally defined in the questionnaire through measurable items, such as clarity of learning objectives, alignment between course content and outcomes, classroom interaction and participation, timeliness of feedback, and practical application of knowledge.
As the main focus of this study lies in the algorithmic optimization and validation of the proposed HMIPSO-BP model rather than in re-establishing or verifying the indicator framework, the complete list of secondary indicators was not reproduced in the main text to maintain clarity and conciseness. All indicators and their definitions were incorporated into the data collection instrument and made available upon request.
3.2. Data Collection for Teaching Quality Evaluation
From January 2024 to December 2024, a questionnaire survey was conducted at the Hainan Vocational University of Science and Technology. The survey was administered both online and offline methods (280 online and 320 offline questionnaires), and a total of 591 responses were collected. Of these, 580 questionnaires were valid, with an effective recovery rate of 96.67%. To ensure the representativeness and diversity of the collected data, 580 valid questionnaires were distributed to students from multiple grades and majors. Specifically, 26.7% of respondents were first-year students, 31.9% were second-year students, 24.1% were third-year students, and 17.3% were fourth-year students. The participants were from five major programs: Mechanical Design, Manufacturing and Automation, New Energy Vehicle Engineering Technology, Automotive Service Engineering Technology, Software Engineering Technology, and Artificial Intelligence Engineering Technology. The survey included three main categories of English courses: College English I–IV (general English courses focusing on foundational language skills), Comprehensive English for Engineering and Technology (discipline-oriented English courses integrating technical reading and writing), and English Communication and Listening Practice (courses emphasizing oral communication and listening proficiency).
The expert scoring process followed a structured rubric based on the three primary indicators, Teaching Content, Teaching Methods, and Teaching Effectiveness, and the 15 sub-indicators described in Section 3.1. Each indicator was rated on a 5-point Likert scale, where 1 represented “very poor,” 2 “poor,” 3 “average,” 4 “good,” and 5 “excellent.” Five English teaching experts from the Hainan Vocational University of Science and Technology participated in the evaluation, each possessing over ten years of teaching experience and professional qualifications in higher education English instruction.
To ensure reliability, inter-rater agreement was analyzed using Cohen’s kappa coefficient, which yielded a value of 0.87, indicating a high level of consistency among the raters. In cases where individual scores differed by more than one point on any indicator, the experts discussed the differences and reached a consensus through collective review and adjustment.
4. Case Studies
In this study, 464 samples were selected from the valid data as training samples and 116 samples as test samples. The initial parameters of the HMIPSO-BP are listed in Table 1.
The course codes corresponding to the questionnaire evaluation samples are numbered \(D_1\) through \(D_6\).
Data from 464 samples from the training set were input into the HMIPSO-BP model for training. A portion of the training results and their corresponding expected output values are listed in Table 2.
To improve the performance and accuracy of the HMIPSO-BP, the rating data were normalized to ensure that the scores fell within the range of 0 to 1. A portion of student evaluation data is listed in Table 3.
Table 1. Parameter configuration table.

Table 2. Partial training results.

Table 3. Partial sample data.

Table 4. Training results of different models.

To verify the superiority and effectiveness of the teaching quality model combined with the HMIPSO-BP model, the proposed model was compared to the traditional BP, PSO-BP, genetic algorithm (GA)-BP, Grey Wolf Optimizer (GWO)-BP, and \(k\)-means models. Mean squared error (MSE) was used as the performance evaluation metric as follows:
The MSE after training with different models is shown in Table 4.
As listed in Table 4, the training results of the HMIPSO-BP model are superior to those of the BP, GA-BP, GWO-BP, and \(k\)-means models in terms of the average, maximum, and minimum values. In addition, the HMIPSO-BP model outperformed the unmodified PSO-BP model across all three metrics. A comparison of the running times of the six models is shown in Fig. 5.
As shown in Fig. 5, the running time of HMIPSO-BP was shorter than that of the other comparison models for any course number. Combined with the data listed in Table 4, this demonstrates that the HMIPSO-BP model significantly improves both evaluation accuracy and training speed, reducing the running time while maintaining evaluation precision.
A line graph comparing the average actual output values and expected output values of different models across different course groups is shown in Fig. 6.
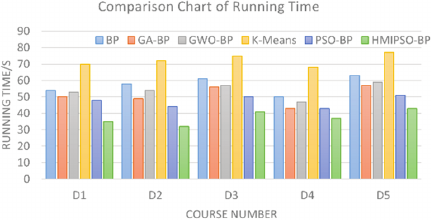
Fig. 5. Comparison chart of training running time.
As shown in Fig. 6, the training results of HMIPSO-BP were closer to the expected values for any course number compared with all other models.
The 116 test samples from the test set were input into the HMIPSO-BP model for validation and were compared with the results from the other five models. The test results for a portion of the samples are listed in Table 5.
As listed in Table 5, the actual output results of the HMIPSO-BP model in the test set are closer to the expected values than those of the other models, demonstrating the effectiveness and superiority of the proposed model.
To identify the evaluation indicators that most strongly influenced the predictions of the HMIPSO-BP model, we computed the SHapley Additive exPlanations (SHAP) value for each input feature. Table 6 lists the mean absolute SHAP values and the proportion of positive contributions across all samples.
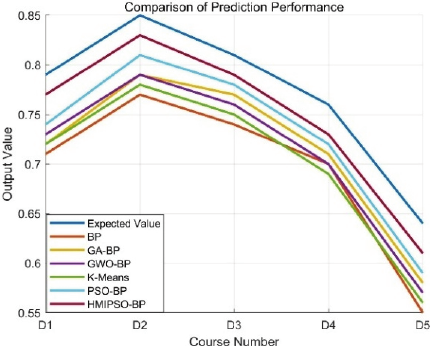
Fig. 6. Comparison of average evaluation results.
Table 5. Test results of different models.

Table 6. Global SHAP summary for all evaluation indicators.

Table 7. Cross-year generalization validation results.

As this is an evaluation tool for educators, the manuscript explains the features that drive predictions. Provide permutation importance, SHAP values, or partial-dependence plots and discuss how instructors could act on the findings.
The SHAP analysis shows that the features under Teaching Methods (B-series) and Teaching Effectiveness (C-series) exert the greatest influence on the predicted teaching quality scores, especially B2, C3, and B3. Indicators from the Teaching Content (A-series) had smaller yet consistent contributions. For educators, these findings imply that efforts to strengthen interactive pedagogy, design authentic practice tasks, and provide timely feedback can yield immediate gains in overall teaching quality. Maintaining a coherent content alignment (A3, A4) further stabilizes learning outcomes, turning model insights into concrete instructional improvements.
To further verify the temporal generalization ability of the HMIPSO-BP model, additional validation was performed using data collected from January to December 2023 at the Hainan Vocational University of Science and Technology. The 2023 dataset was obtained using the same evaluation questionnaire, index framework, and expert scoring rubric described in Section 3.2. The model was trained on the 2024 dataset (580 valid questionnaires) and tested directly on the 2023 dataset (546 valid questionnaires), representing an independent cross-year validation setting.
The cross-year generalization validation results are shown in Table 7. The results demonstrate that the HMIPSO-BP model maintains a strong predictive accuracy when applied to data from a different academic year, achieving a 12.1% lower MSE than PSO-BP and a 28.3% reduction compared with the standard BP model.
5. Conclusion
This study presents a HMIPSO and BP neural network model for evaluating English teaching quality in higher education using deep learning technology. The model, which incorporates a multi-strategy optimization algorithm, significantly improves the accuracy and efficiency of the assessment. The experimental results show that HMIPSO-BP outperforms traditional and improved BP models (e.g., GA-BP and PSO-BP) in terms of prediction accuracy, convergence speed, and global optimization, thereby avoiding local minimum issues. The model also demonstrates strong generalizability and stability, making it ideal for monitoring and enhancing the quality of English teaching. This study offers a new technological approach for evaluating teaching quality, with the potential for broader application in different disciplines and educational models and future optimization of evaluation systems for better decision support in higher education quality management.
- [1] M. Ďurišová, A. Kucharčíková, and E. Tokarčíková, “Assessment of higher education teaching outcomes (quality of higher education),” Procedia – Social and Behavioral Sciences, Vol.174, pp. 2497-2502, 2015. https://doi.org/10.1016/j.sbspro.2015.01.922
- [2] Y. Zhou, S. Zou, M. Liwang, Y. Sun, and W. Ni, “A teaching quality evaluation framework for blended classroom modes with multi-domain heterogeneous data integration,” Expert Systems with Applications, Vol.289, Article No.127884, 2025. https://doi.org/10.1016/j.eswa.2025.127884
- [3] M. Qian and L. Zhao, “Empowering undergraduate teaching quality evaluation with big data: Value connotations, realistic dilemmas and path choices,” Chongqing Higher Education Research, Vol.11, pp. 40-48, 2023. https://doi.org/10.15998/j.cnki.issn1673-8012.2023.05.004
- [4] R. Liu, Y. Zhang, and X. Fang, “Research on the influencing factors of business teachers’ teaching quality: PLS-SEM and ANN approach,” The Int. J. of Management Education, Vol.23, No.2, Article No.101134, 2025. https://doi.org/10.1016/j.ijme.2025.101134
- [5] Y. Zhao, W. Li, H. Jiang, M. Siyiti, M. Zhao, S. You, Y. Li, and P. Yan, “Development of a blended teaching quality evaluation scale (BTQES) for undergraduate nursing based on the Context, Input, Process and Product (CIPP) evaluation model: A cross-sectional survey,” Nurse Education in Practice, Vol.77, Article No.103976, 2024. https://doi.org/10.1016/j.nepr.2024.103976
- [6] F. Xia, “Optimized multiple-attribute group decision-making through employing probabilistic hesitant fuzzy TODIM and EDAS technique and application to teaching quality evaluation of international Chinese course in higher vocational colleges,” Heliyon, Vol.10, Article No.e25758, 2024. https://doi.org/10.1016/j.heliyon.2024.e25758
- [7] R. Chen, X. Luo, Q. Nie, L. Wang, J. Li, and X. Zeng, “BP-CM model: A teaching model for improving the teaching quality of IoT hardware technology based on BOPPPS and memory system,” Education and Information Technologies, Vol.28, pp. 6249-6268, 2023. https://doi.org/10.1007/s10639-022-11432-7
- [8] J. Chang, J. Huang, and Y. Hu, “Optimizing information dissemination model for improvement of college students’ education based on learning community,” Mobile Information Systems, Vol.2021, Article No.3815943, 2021. https://doi.org/10.1155/2021/3815943
- [9] H. Zhang, B. Xiao, J. Li, and M. Hou, “An improved genetic algorithm and neural network-based evaluation model of classroom teaching quality in colleges and universities,” Wireless Communications and Mobile Computing, Vol.2021, Article No.2602385, 2021. https://doi.org/10.1155/2021/2602385
- [10] S. Li, T. Shi, and J. Kuang, “Exploration and practice of informatization means in the quality supervision of college classroom teaching,” J. Phys.: Conf. Ser., Vol.1345, No.4, Article No.042032, 2019. https://doi.org/10.1088/1742-6596/1345/4/042032
- [11] Y. Sun and M. Jiang, “An evaluation model for the teaching reform of the physical education industry,” Discrete Dynamics in Nature and Society, Vol.2021, Article No.7147554, 2021. https://doi.org/10.1155/2021/7147554
- [12] Y. Li and H. Zhang, “Big data technology for teaching quality monitoring and improvement in higher education – Joint K-means clustering algorithm and Apriori algorithm,” Systems and Soft Computing, Vol.6, Article No.200125, 2024. https://doi.org/10.1016/j.sasc.2024.200125
- [13] T. Zhang, J. Liu, and H. Hu, “Teaching quality evaluation based on IPSO-BP neural network model,” Research and Exploration in Laboratory, Vol.42, pp. 174-178, 2023. https://doi.org/10.19927/j.cnki.syyt.2023.06.035
- [14] P. Wang, “Application and analysis of fuzzy hierarchical model in teaching quality assessment of primary education,” Proc. 3rd Int. Conf. Smart Generation Computing, Communication and Networking (SMART GENCON), 2023. https://doi.org/10.1109/SMARTGENCON60755.2023.10442273
- [15] Y. Zhang, “Application and analysis of fuzzy hierarchical model in education and teaching quality assessment,” Proc. IEEE Int. Conf. Information Technology, Electronics and Intelligent Communication Systems (ICITEICS), 2024. https://doi.org/10.1109/ICITEICS61368.2024.10625010
- [16] X. Guo, M. Gao, M. Zhang, Y. Chen, and S.-P. Tseng, “Design and implementation of teaching quality assessment system based on analytic hierarchy process fuzzy comprehensive evaluation method,” Proc. 8th Int. Conf. Orange Technol. (ICOT), 2020. https://doi.org/10.1109/ICOT51877.2020.9468778
- [17] M. Yuan, “Evaluation method of English teaching quality based on improved kernel extreme learning machine of analytical hierarchy process and krill herd,” Proc. IEEE 11th Joint Int. Inf. Technol. and Artificial Intelligence Conf. (ITAIC), pp. 1854-1859, 2023. https://doi.org/10.1109/ITAIC58329.2023.10408892
- [18] X. Ying and G. Vallejos, “Quality assessment model of middle school geography teaching practice course based on decision tree algorithm,” Proc. 5th Int. Conf. Applied Machine Learning (ICAML), pp. 65-70, 2023. https://doi.org/10.1109/ICAML60083.2023.00022
- [19] F. Li, “Research on intelligent assessment algorithm of English teaching diagnosis system based on SVM,” Proc. Int. Conf. Electronics and Devices, Computational Science (ICEDCS), pp. 618-621, 2023. https://doi.org/10.1109/ICEDCS60513.2023.00118
- [20] D. Zhang, “Quality evaluation of college English classroom teaching based on K-means clustering algorithm,” Proc. Int. Conf. Intelligent Systems and Computational Networks (ICISCN), 2025. https://doi.org/10.1109/ICISCN64258.2025.10934355
- [21] S. Yuan, “A K-means algorithm for higher education quality assessment system,” Proc. Int. Conf. Intelligent Computing, Communication and Convergence (ICI3C), pp. 289-293, 2023. https://doi.org/10.1109/ICI3C60830.2023.00062
- [22] Y. Li, “The quality evaluation of English talent training in universities based on K-means algorithm,” Proc. IEEE Int. Conf. Integrated Circuits and Communication Systems (ICICACS), 2023. https://doi.org/10.1109/ICICACS57338.2023.10100228
- [23] A. Li, “Research on the effectiveness of data mining algorithms in music educational assessment,” Proc. Int. Conf. Interactive Intelligent Systems and Techniques (IIST), pp. 355-360, 2024. https://doi.org/10.1109/IIST62526.2024.00136
- [24] Y. Liu, J. Xue, D. Li, W. Zhang, T. K. Chiew, and Z. Xu, “Image recognition based on lightweight convolutional neural network: Recent advances,” Image and Vision Computing, Vol.146, Article No.105037, 2024. https://doi.org/10.1016/j.imavis.2024.105037
- [25] Z. Salahuddin, H. C. Woodruff, A. Chatterjee, and P. Lambin, “Transparency of deep neural networks for medical image analysis: A review of interpretability methods,” Computers in Biology and Medicine, Vol.140, Article No.105111, 2022. https://doi.org/10.1016/j.compbiomed.2021.105111
- [26] Z. Nan, “Research on the application of BP algorithm of neural network in teaching quality evaluation,” Proc. Int. Conf. Optimization Computing and Wireless Communication (ICOCWC), 2024. https://doi.org/10.1109/ICOCWC60930.2024.10470499
- [27] P. Ge, T. Fan, G. Wang, Z. Zang, and X. Tao, “CA-BPNN-based multi-modal fusion teaching quality evaluation method,” Proc. IEEE Int. Conf. Progress in Informatics and Computing (PIC), pp. 29-35, 2024. https://doi.org/10.1109/PIC62406.2024.10892784
- [28] Y. Yao, X. Gao, and Q. Shen, “Research on the evaluation of mathematical teaching quality based on K-means and BP algorithm,” Proc. 7th Int. Conf. Education, Network and Information Technology (ICENIT), pp. 203-208, 2024. https://doi.org/10.1109/ICENIT61951.2024.00044
- [29] Y. Gao, Y. Zhang, and L. Li, “Undergraduate practice teaching job quality assessment based on artificial fish-BP neural network,” Proc. ISECS Int. Colloquium on Computing, Communication, Control, and Management, pp. 379-382, 2009. https://doi.org/10.1109/CCCM.2009.5267921
- [30] H. Zhang, M. Zhang, X. Qu, W. Peng, H. Zhang, and Y. Zhang, “Evaluation and prediction of water quality in the Beijing section of Yongding River based on CEWI index and BP neural network,” Environmental Science, Vol.XX, pp. 1-17, 2025 (in Chinese). https://doi.org/10.13227/j.hjkx.202503067
- [31] X. Wu, M. Guo, A. Hu, and Q. Wu, “Path planning for UAV based on improved genetic particle swarm optimization,” Chinese J. of Scientific Instruments, Vol.XX, pp. 1-11, 2025 (in Chinese). https://doi.org/10.19650/j.cnki.cjsi.J2413512
- [32] B. Lei, H. Tang, Y. Su, Y. Ru, and S. Fei, “Fuzzy adaptive power optimization control of wind turbine with improved whale optimization algorithm and kernel extreme learning machine,” Expert Systems with Applications, Vol.272, Article No.126750, 2025. https://doi.org/10.1016/j.eswa.2025.126750
- [33] Z. Han, Y. Sun, and J. Huang, “Construction of teaching quality evaluation model for college physical education based on PSO-BPNN algorithm,” J. Chongqing Univ. Educ., Vol.37, pp. 107-112, 2024.
This article is published under a Creative Commons Attribution-NoDerivatives 4.0 Internationa License.