
Research Paper:
Polytomous Model Integrating S–P Chart and Ordering Theory: Application to Cognitive Diagnosis of Fraction Calculation
Yuan-Horng Lin*,†
 and Mitsunobu Kawauchi**
*Department of Mathematics Education, National Taichung University of Education
No.140 Minsheng Rd., West Dist., Taichung 403514, Taiwan
†Corresponding author
**Graduate School of Education, Hyogo University of Teacher Education
942-1 Shimokume, Kato, Hyogo 673-1494, Japan

This study proposes an integrated model for cognition diagnosis applicable to polytomous data and conducts an empirical analysis using data on fraction addition and subtraction performance collected from elementary school students in Taiwan and Japan. This study develops computational procedures that extend the dichotomous student–problem (S–P) chart and ordering theory (OT) to polytomous response formats. The integrated polytomous student problem–ordering theory (SP–OT) model consists of a three-step procedure: (1) calculation of the caution indices of test-takers based on the polytomous S–P chart; (2) implementation of a two-stage cluster analysis using both the caution indices and score as clustering indicators; (3) construction of polytomous OT item structures for each cluster derived from the two-stage cluster analysis. The polytomous SP–OT model captured varying levels of student understanding and provided richer diagnostic insights. Furthermore, this model enhanced the accuracy and effectiveness of educational assessment. This study provided valuable methodological insights by developing a polytomous model that integrated the S–P chart and OT. This new model overcame the limitations of traditional dichotomous data by introducing a visualized and clustered approach to cognitive diagnosis. Future research may apply this polytomous SP–OT model to other disciplines.
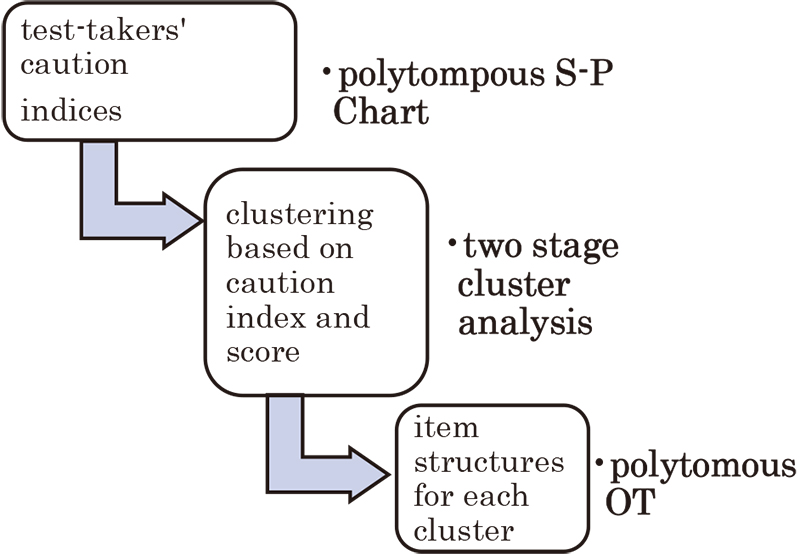
Procedure of the integrated polytomous SP―OT model for conducting cognitive diagnosis
- [1] C. Y. Dai, J. K. Cheng, and Y. C. Hsu, “The new meaning of S-P Chart,” Proc. of ED-MEDIA 2005–World Conf. on Educational Multimedia, Hypermedia & Telecommunications, pp. 3074-3079, 2005.
- [2] T. E. Dinero and S. L. Blixt, “Information about tests from Sato’s SP chart,” College Teaching, Vol.36, No.3, pp. 123-128, 1988. https://doi.org/10.1080/87567555.1988.10532421
- [3] P. W. Airasian and W. M. Bart, “Ordering theory: A new and useful measurement model,” Educational Technology, Vol.13, No.5, pp. 56-60, 1973.
- [4] S. Lee, T. Lee, R. Liu, S. Joo, and D. Shi, “Research trends and challenges in diagnostic classification models: Insights from dynamic topic modeling,” Measurement: Interdisciplinary Research and Perspectives, pp. 1-32, 2025. https://doi.org/10.1080/15366367.2025.2493998
- [5] F. Tang, I. Uchendu, F. Wang, H. H. Dodge, and J. Zhou, “Scalable diagnostic screening of mild cognitive impairment using AI dialogue agent,” Scientific Reports, Vol.10, Article No.5732, 2020. https://doi.org/10.1038/s41598-020-61994-0
- [6] D. W. Tai, R. C. Zhang, and J. L. Chen, “An evaluation of the visual presentation e-learning on engineering drawing by using the SP chart analysis,” Int. J. of e-Education, e-Business, e-Management and e-Learning, Vol.4, No.3, pp. 203-206, 2014. https://doi.org/10.7763/IJEEEE.2014.V4.331
- [7] Y. Yan, S. Dong, and X. Yu, “Using ordering theory to learn attribute hierarchies from examinees’ attribute profiles,” J. of Educational and Behavioral Statistics, Vol.50, No.6, pp. 985-1013, 2025. https://doi.org/10.3102/10769986241280389
- [8] T. Sato, “The S-P chart and the caution index,” NEC Educational Information Bulletin, Vol.80, No.1, 1980 (in Japanese).
- [9] T. Sato and M. Kurata, “Basic S-P score table characteristics,” NEC Research and Development, Vol.47, pp. 64-71, 1977 (in Japanese).
- [10] W. M. Bart and D. J. Krus, “An ordering-theoretic method to determine hierarchies among items,” Educational and Psychological Measurement, Vol.33, No.2, pp. 291-300, 1973. https://doi.org/10.1177/001316447303300208
- [11] D. W. Braithwaite and R. S. Siegler, “Putting fractions together,” J. of Educational Psychology, Vol.113, No.3, pp. 556-571, 2021. https://doi.org/10.1037/edu0000477
- [12] V. Trivena, A. R. Ningsih, and A. Jupri, “Misconception on addition and subtraction of fraction at primary school students in fifth-grade,” J. of Physics: Conf. Series, Vol.895, No.1, Article No.012139, 2017. https://doi.org/10.1088/1742-6596/895/1/012139
- [13] A. M. Jarrah, Y. Wardat, and S. Gningue, “Misconception on addition and subtraction of fractions in seventh-grade middle school students,” Eurasia J. of Mathematics, Science and Technology Education, Vol.18, No.6, Article No.em2115, 2022. https://doi.org/10.29333/ejmste/12070
- [14] N. C. Aksoy and D. O. Yazlik, “Student errors in fractions and possible causes of these errors,” J. of Education and Training Studies, Vol.5, No.11, pp. 219-233, 2017. https://doi.org/10.11114/jets.v5i11.2679
- [15] R. S. Siegler, L. K. Fazio, D. H. Bailey, and X. Zhou, “Fractions: The new frontier for theories of numerical development,” Trends in Cognitive Sciences, Vol.17, No.1, pp. 13-19, 2013. https://doi.org/10.1016/j.tics.2012.11.004
- [16] R. S. Siegler and H. Lortie-Forgues, “Conceptual knowledge of fraction arithmetic,” J. of Educational Psychology, Vol.107, No.3, pp. 909-918, 2015. https://doi.org/10.1037/edu0000025
- [17] Y. Copur-Gencturk, “Teachers’ conceptual understanding of fraction operations: Results from a national sample of elementary school teachers,” Educational Studies in Mathematics, Vol.107, No.3, pp. 525-545, 2021. https://doi.org/10.1007/s10649-021-10033-4
- [18] M. A. Simon, N. Placa, A. Avitzur, and M. Kara, “Promoting a concept of fraction-as-measure: A study of the learning through activity research program,” The J. of Mathematical Behavior, Vol.52, pp. 122-133, 2018. https://doi.org/10.1016/j.jmathb.2018.03.004
This article is published under a Creative Commons Attribution-NoDerivatives 4.0 Internationa License.