Research Paper:
Brightness-Sensitive Generative Adversarial Network Using a Chained Extension Framework for PET-to-CT Medical Image Synthesis
Xiaoyu Deng*,†
 , Kouki Nagamune**
, and Hiroki Takada*
, Kouki Nagamune**
, and Hiroki Takada*
*Graduate School of Engineering, University of Fukui
3-9-1 Bunkyo, Fukui, Fukui 910-0017, Japan
†Corresponding author
**Department of Electronics and Computer Science, Graduate School of Engineering, University of Hyogo
2167 Shosha, Himeji, Hyogo 671-2280, Japan

Multimodal medical imaging is pivotal for early disease screening; however, its deployment is often constrained by limited resources. While deep learning-based synthesis cannot replace clinical imaging, high-fidelity cross-modal translation can provide actionable prior information for preliminary assessment. To this end, we introduce a chained extension framework that scales model capacity and precision by linking multiple encoder–decoder modules. Starting from a minimal encoder–decoder backbone, we construct a triple-stage generative adversarial network and integrate a brightness-sensitive loss that reweights luminance-dependent errors. This staged design decomposes positron emission tomography to computed tomography translation into complementary subtasks targeting structural consistency, texture enhancement, and key-region refinement. Comprehensive experiments indicate that the proposed approach generates synthetic CT images that closely match reference CT scans, visually and quantitatively, achieving a structural similarity index of 0.85, peak signal-to-noise ratio of 23.31 dB, and mean absolute error of 6.93×10⁻². Thus, our framework is feasible as an assistive tool for early screening workflows in resource-limited settings. Moreover, the staged training strategy, coupled with brightness-aware weighting, mitigates common optimization plateaus in cross-modal synthesis, suggesting a principled path toward further gains in fidelity and robustness.
Data acquisition and preprocessing steps
1. Introduction
Positron emission tomography (PET) and computed tomography (CT) jointly provide complementary physiological and anatomical information for clinical diagnosis 1. However, integrated PET/CT systems remain prohibitively expensive and scarce in resource-limited areas, and patients undergoing such examinations also face notable radiation exposure 2. These factors underscore the need for alternative approaches to facilitate early disease screening.
Deep convolutional neural networks (DCNN) 3 and generative adversarial networks (GAN) 4 have demonstrated significant potential in image-to-image translation tasks across domains, including natural images and medical images 5. Nonetheless, translating cross-modal medical images poses unique challenges in accurately preserving tissue density, structure, and diagnostic details—critical elements for reliable clinical assessments 6.
To address these challenges, we propose a novel framework that integrates a triple-stage generator with brightness-sensitive loss functions. Our approach decomposes the complex task of cross-modal medical image synthesis into three dedicated stages that optimize structural fidelity, texture representation, and final image fusion. The brightness-sensitive loss functions further enhance the ability of the model to retain clinically meaningful features. Experimental results show that our method outperforms existing strategies in PET-to-CT image conversion, offering a cost-effective and efficient solution for early disease screening. Our main contributions are as follows:
-
Triple-Stage Generator: We introduce a triple-stage generation framework that decouples the full image synthesis pipeline into three functionally complementary sub-modules: the structure-constrained stage, the texture-reconstruction stage, and image synthesis and pixel-refinement stage. This hierarchical design reformulates an inherently complex multiobjective optimization problem into several single-objective subtasks with faster convergence, markedly improving training efficiency while enhancing structural and textural fidelity in the generated images.
-
Brightness-Sensitive Loss Function: Recognizing that luminance distributions in medical images encode critical anatomical cues, we devise a brightness-sensitive loss that assigns weights to distinct brightness intervals. This mechanism directs the encoder–decoder to allocate greater learning capacity to high-information regions, preserving fine details in high-luminance structures and mitigating artifacts in darker areas.
-
Stagewise Optimization Strategy: By integrating the triple-stage generator with the brightness-sensitive loss, we first partition the cross-modal translation task across dedicated subgenerators and subsequently impose targeted constraints on each encoder–decoder. This stage-wise, task-oriented optimization scheme effectively reduces task coupling and improves quantitative accuracy and visual quality in cross-modal medical image conversion.
2. Related Works
In recent years, deep learning has made significant progress in tasks such as classification, segmentation 7, registration, and synthesis of medical images 8. This study focused primarily on the synthesis of CT images using deep learning methods, which can be broadly categorized into the following two frameworks.
2.1. CNN-Based CT Image Synthesis
CNN-based methods typically adopt encoder–decoder architectures to synthesize CT images by minimizing differences from real scans 9. Building on U-Net, Hashimoto et al. employed CNNs to generate TCT from uncorrected PET 10, while Zhang et al. leveraged bi-domain information and cycle consistency to improve PET-CT synthesis 11. Nonetheless, conventional downsampling and upsampling 12 can lead to detail loss and texture blurring 13, limiting fine-grained modeling of complex features.
2.2. GAN-Based CT Image Synthesis
GAN-based approaches leverage adversarial training for richer textures 14. Pix2pix pioneered conditional GANs for end-to-end translation, whereas SA-UNet 15 and U-Transformer 16 introduced attention or Transformer modules into U-Net to capture key structures and global context. Additionally, 17 demonstrated the effectiveness of attention and skip connections in conditional GAN-based PET registration and generation, and CycleGAN 18 employed cyclic constraints to improve pseudo-CT fidelity. Combining Transformers with CNNs further preserves structure and texture 19. Wang et al. 20 proposed DSG-GAN, a dual-stage generator that decomposes multiobjective synthesis into sequential subtasks. Li et al. 21 introduced TCGAN, integrating the advantages of Transformers and CNNs for higher-fidelity PET-to-CT generation.
Chen et al. 22 devised MedPrompt, employing adaptive prompt blocks within a Transformer framework to achieve state-of-the-art multitask medical image translation. Liang et al. 23 introduced LPTN, based on Laplacian pyramid decomposition for real-time high-resolution illumination and color transformations. Dalmaz et al. 24 developed ResViT, a multimodal GAN that fuses convolutional networks and Vision Transformers with a residual Transformer module, capturing both local structure and global context. Gao et al. 25 proposed an encoder–decoder network that combines convolution-deconvolution, residual shortcuts, and inception modules to preserve pixel-level details while learning nonlinear cross-modal mappings.
In an unsupervised setting, Liu et al. 26 presented UNIT by coupling GANs and VAEs under a shared latent space assumption. Huang et al. 27 proposed MUNIT, which disentangles domain-invariant content and domain-specific style codes for diverse cross-domain generation. Liu et al. 28 then introduced FUNIT, leveraging large-scale multi-source data in training and only a few target-class samples at inference to achieve high-fidelity few-shot translation. While these methods greatly advance image synthesis, their full potential in medical imaging requires further investigation 29.
2.3. Problem Statement
Table 1 provides an overview of the general advantages and limitations of CNN-, GAN-, and Transformer-based frameworks. Despite the considerable achievements in CT image synthesis, existing studies still face the following challenges:
Table 1. Comparison of CNN-, GAN-, and Transformer-based frameworks for medical image synthesis.

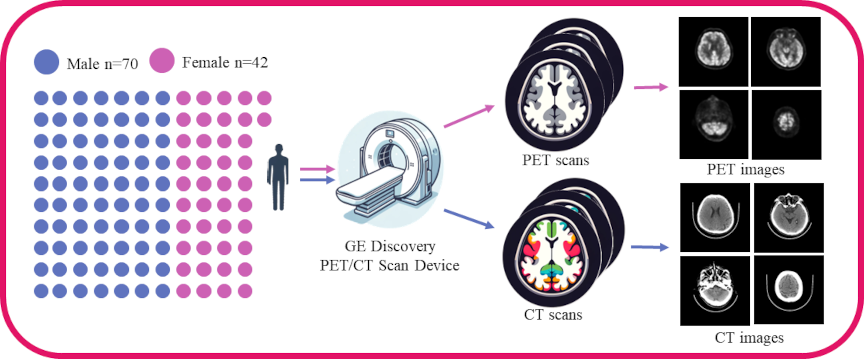
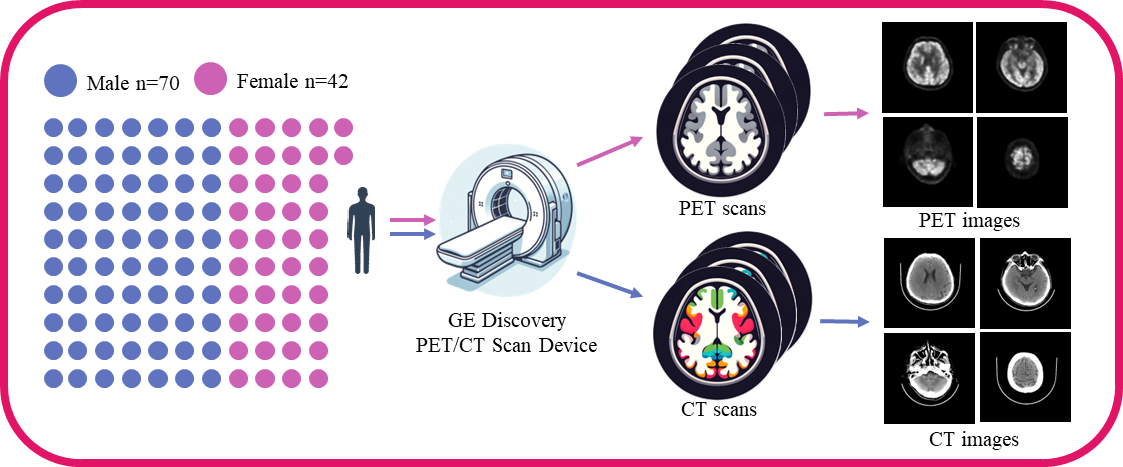
Fig. 1. Flowchart illustrating data acquisition and preprocessing steps. The left side of the figure illustrates the gender distribution of the participants: 70 males (represented by blue dots) and 42 females (represented by pink dots). At the center of the figure is a schematic of the GE Discovery PET/CT scanning equipment, a medical imaging device capable of providing precise positron emission tomography and computed tomography scans. The PET and CT scans are indicated by pink and blue arrows, respectively. Each scanning method is applied to the same group of participants, ensuring data consistency and comparability. The right side of the figure is divided into two parts: the upper half displays brain images obtained from PET scans, while the lower half shows results from CT scans. Each section includes four representative images, showcasing different angles and slices of brain structure.
-
Detail Loss and Texture Blurring: The common downsampling and upsampling operations in CNN frameworks tend to cause loss of detail, texture blurring, and checkboard artifacts, which are critical for accurate medical image synthesis.
-
Insufficient Emphasis on Brighter Regions: Different brightness levels in CT images correspond to varying importance of tissues and lesions. Current methods are not yet optimized for high-brightness structures and dark textures, impacting the practicality of synthetic images in clinical diagnostics.
-
Performance Bottlenecks: Although Transformer-based architectures have demonstrated remarkable efficacy in preserving anatomical structures and textural patterns during image synthesis, their application in medical image translation scenarios frequently encounters performance limitations owing to inherent task complexity.
These persistent challenges underscore the critical need to develop novel methodologies that can enhance translation fidelity while maintaining clinical relevance in medical imaging applications. This study addressed network structure and loss function aspects and proposed multistage generation and brightness-sensitive optimization strategies to improve the fidelity and clinical usability of synthesized CT images.
3. Data Acquisition and Preprocessing
We used the brain PET and CT scan data provided by the Anhui Provincial International Joint Research Center for Advanced Technology in Medical Imaging, School of Computer Science and Technology, Anhui University, in collaboration with the Sino Canadian Health Research Institute, to extensively evaluate the effectiveness of our method. The medical data were subject to an ethical review process and received approval from the Ethics Committee. We strictly adhered to the ethical standards for medical research involving human subjects as outlined in the 1964 Helsinki Declaration and its subsequent revisions, ensuring that all participants provided explicit written informed consent prior to their involvement in the study. The dataset acquisition workflow is illustrated in Fig. 1.
Table 2. Dataset statistics.

3.1. Data Acquisition
The brain PET/CT scan data used were provided by the Anhui Provincial International Joint Research Center for Advanced Technology in Medical Imaging, School of Computer Science and Technology, Anhui University, in collaboration with the Sino Canadian Health Research Institute. In this study, we used image data from PET and CT scans, including gender and age information, while excluding personally identifiable information such as names and medical histories. The scan data were obtained using the GE Discovery PET/CT scanner, encompassing a total of 112 adult PET and CT scans from 42 females and 70 males.
3.2. Data Preprocessing
We separately processed the data from different modalities to ensure they meet the requirements of the corresponding deep learning networks. The data used in this study were stored in DICOM format along with some label information.
3.2.1. PET and CT Data Preprocessing
We used MicroDicom software on Windows system to initially process PET and CT scan data as follows:
-
Statistical analysis of data label distribution: gender, age, weight.
-
Exporting the scan information in a unified visual format.
The exported image data were processed using the Python-based OpenCV library to remove redundant information, such as inspection beds and private information, from the PET and CT images.
3.2.2. Paired Image Dataset Processing
The specific label distribution of the dataset is shown in Table 2.
All data consist of paired PET/CT scan images, with each image having a depth of 16 bits. The processed PET and CT images were paired by filename and saved in \(256 \times 256\) pixel RGB image format, as in Fig. 2. After manual screening, we obtained 4,606 pairs of PET/CT images, with 4,230 pairs used for training and 376 used for testing.
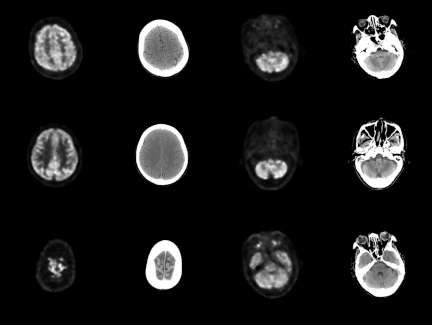
Fig. 2. Visualization of the paired PET-CT image dataset. Columns 1 and 3 present PET images from the same subject, whereas Columns 2 and 4 display CT images corresponding to the same anatomical location. Consequently, each pair in this dataset comprises both PET and CT images.
4. Methods
We present the architecture of our proposed triple-stage generator and the brightness-sensitive loss function, focusing on the encoder–decoder design and the rationale behind multi-stage segmentation of the cross-modal image translation task.
4.1. Triple-Stage Generator
The triple-stage generator decomposes cross-modal medical image transformation into three subtasks: structural constraints, texture feature generation, and pixel-level adjustment. By assigning each encoder–decoder pair to a single objective, the framework addresses multiobjective optimization more effectively than the single-stage approach.
4.1.1. Encoder–Decoder Pair
We employ a streamlined encoder architecture designed to facilitate the sequential integration of multiple encoders while retaining rich multiscale feature representations. The encoder progressively reduces spatial resolution and increases feature dimensionality through consecutive downsampling operations, implemented via convolutional layers (stride \(> 1\)) or max pooling. The architecture comprises eight encoder modules with input feature channel dimensions of \([3, 64, 128, 256, 512, 512, 512, 512]\), ultimately reducing the spatial resolution to \(512 \times 1 \times 1\). The complete layer configuration is provided in Table 3.
Table 3. Encoder setting.

The decoder converts feature maps output by the encoder back to the spatial resolution of the original image for pixel-level prediction. The decoder includes a series of upsampling steps, which are achieved through transposed convolutions that gradually increase the spatial dimensions of the feature maps. During this process, feature maps from corresponding encoder layers, also known as “skip connections,” are added to aid the decoder in better restoring image details. The decoder used in this study comprises seven decoder modules, with input feature channels for each decoder module of sequential input feature channels of 512, 1,024, 1,024, 1,024, 1,024, 512, 256, and sequential output feature channels of 1,024, 1,024, 1,024, 1,024, 512, 256, 128. After passing through the last decoder module, the shape of the feature information is \(128 \times 128 \times 128\). The final upsampling operation is performed by the Visual Block, which employs the Tanh function as its nonlinear activation. Detailed settings of the decoder and Visual Block are provided in Table 4.
Table 4. Decoder setting.

4.1.2. Triple-Stage Generator Architecture
To address distinct optimization tasks effectively, the triple-stage generator employs a mirror-symmetry arrangement of encoders and decoders (Fig. 3). Three encoder–decoder pairs—each comprising an encoder, decoder, skip connections, and Visualized Block—sequentially produce outputs labeled Stage1, Stage2, and Output. Each output is used for dedicated loss computations, facilitating focused improvements in structural constraints, texture fidelity, and final image adjustment.
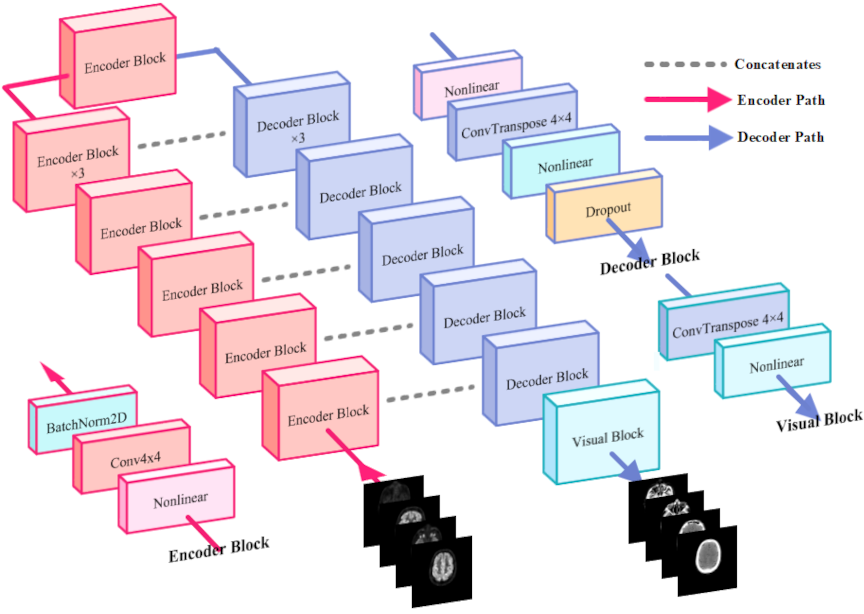
Fig. 3. Architecture of the proposed modeling. The model comprises eight encoder modules, seven decoder modules, and one visualization decoder module. The encoding path is indicated by red lines, the decoding path by blue lines, and standard skip connections by gray dashed lines. The model takes PET images as input and predicts the corresponding CT images.
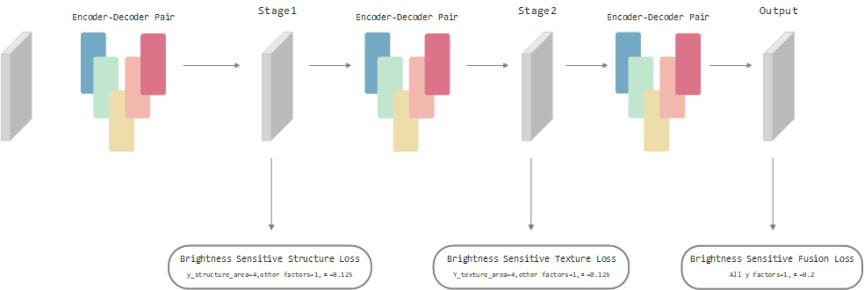
Fig. 4. Triple-stage generator architecture. It comprises three identical encoder–decoder modules (shown as colored sections). “Stage1,” “Stage2,” and “Output” denote the outputs of the first, second, and third generators, respectively. The arrows leading from each output indicate the loss functions applied to that particular output.
This multistage division of structural, textural, and synthesis tasks is advantageous in handling multiobjective optimization, offering a clearer pathway for tackling precision bottlenecks often encountered in single-stage cross-modal medical image translation. Fig. 4 illustrates the overall network design explained hereunder:
-
G1 (structural constraint generator) enforces structure-awareness by employing attention-driven connections at both the same and higher network levels, emphasizing anatomically salient features while filtering out noise and redundant information.
-
G2 (texture generator) adopts a dual-module approach, comprising texture extraction and reconstruction. The extraction module isolates texture features from PET inputs, whereas the reconstruction module leverages multilevel attention to align and enhance texture details in the CT domain.
-
G3 (image synthesis and difference adjustment generator) fuses the refined structural and texture information, outputting the final CT image with improved fidelity and reduced residual discrepancies.
4.1.3. Optimization Strategy
The main objective of this study is to demonstrate the superiority of multistage cascading in conjunction with a luminance-sensitive loss function in cross-modal image translation. Consequently, the fine-grained optimization of an individual model is not the primary focus. Nevertheless, to strike a balance between computational efficiency and model performance, several pragmatic modifications are applied to the conventional U-Net backbone.
-
Deeper Down-Sampling: To capture the latent mapping between PET and CT modalities more comprehensively, the number of down-sampling layers is increased from the customary four to seven. This deeper hierarchy enables the network to learn richer high-level semantic representations, improving cross-modal translation quality.
-
Lightweight Decoder: On the decoder path, only standard feature concatenation is employed. More sophisticated schemes such as dense connections or depthwise inception connections are deliberately omitted to minimize the parameter count and computational burden while maintaining an overall streamlined architecture.
-
Computation-Aware Loss Design: Feature-based perceptual losses are not adopted. Excluding such high-overhead terms further reduces training cost and underscores the potential applicability of the proposed method in resource-constrained environments.
4.2. Brightness-Sensitive Loss
Common loss functions for image generation include mean absolute error (MAE) or L1, and mean square error (MSE) or L2. While L1 measures the mean absolute difference between predicted and true pixel values, L2 squares these errors. Consequently, larger errors are penalized more heavily under L2, whereas smaller errors are penalized more uniformly under L1. Given that pixel intensities in this study are scaled to \([-1,1]\), L2 remains particularly sensitive when deviations exceed 1, whereas L1 is more effective for finer error adjustments.
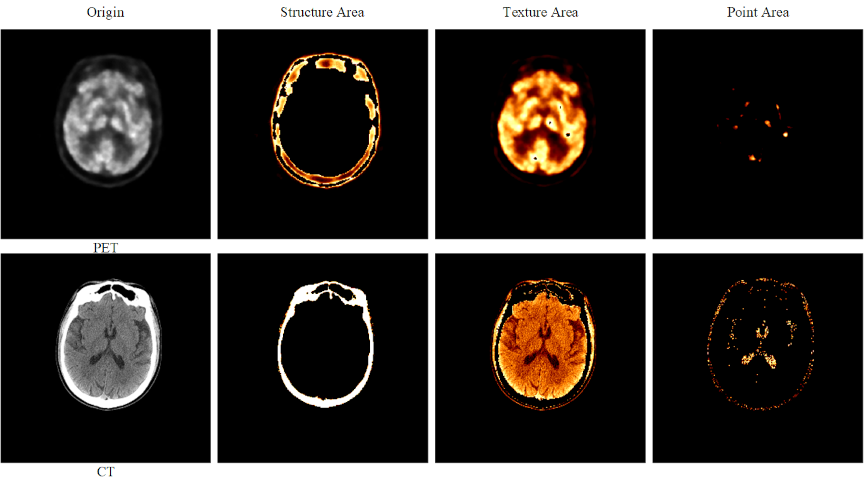
Fig. 5. Brightness-sensitive loss components. The first row displays PET images, whereas the second row presents CT images. From left to right, the four columns show: (1) the original image, (2) the image after applying a structural threshold (Structure Area), (3) the image after applying a texture threshold (Texture Area), and (4) the image after applying a detailed region threshold (Point Area).
To incorporate pixel-brightness characteristics, we propose a brightness-sensitive loss (BSLoss), which assigns weights to structural, textural, and point-like regions based on intensity (Fig. 5). First, the predicted image \(\mathbf{\hat{y}}\) and ground truth \(\mathbf{y}\) are mapped from \([-1,1]\) to \([0,1]\):
Following intensity thresholds, we define:
We integrate \(\alpha\) and \(\mathbf{B_w}\) into L1 and L2 forms:
5. Experiments
Table 5. Performance of GAN employing different generators.

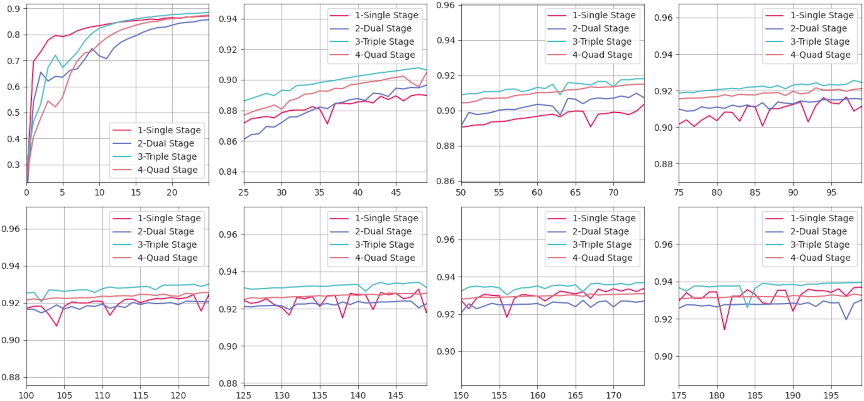
Fig. 6. Evaluation results of the SSIM for CT images generated by various models compared with the corresponding real CT images over a training period of 0–200 epochs. The horizontal axis of each subplot spans a fixed range of 25 epochs, while the vertical axis denotes SSIM values. SSIM values are calculated using a Gaussian filter with a kernel size of 11 and a kernel sigma value of 1.5. The evaluation metric is defined within a range of 0–1, where higher SSIM values indicate a greater structural similarity between the generated and real CT images.
This section evaluates different generator architectures for PET-to-CT image conversion. We adopt structural similarity index measure (SSIM), peak signal-to-noise ratio (PSNR), and MAE as the primary metrics and visualize both quantitative and qualitative results to analyze the performance variance across models.
5.1. Results of Quantitative Experiments for Multistage Generator
We assessed four configurations with an increasing number of stages—single, dual, triple, and quad—whose parameter counts ranged from 54M to 217M. As shown in Table 5, the triple-stage model consistently achieved the most favorable trade-off between performance and complexity, offering clear evidence of its suitability for high-precision medical imaging:
-
SSIM: Attained the highest value of 0.82, demonstrating superior preservation of structural fidelity.
-
PSNR: Achieved a slightly higher score of 20.78 dB compared with all other configurations.
-
MAE: Produced the lowest value of 7.5, indicating more accurate intensity reconstruction.
Although the quad-stage model delivered a comparable PSNR (20.77 dB), it suffered from a reduction in SSIM (0.81) and an increased MAE (8.7), implying that the additional parameters may introduce overfitting, diminishing overall effectiveness. This underscores the importance of selecting an architecture that balances representational capacity with generalizability.
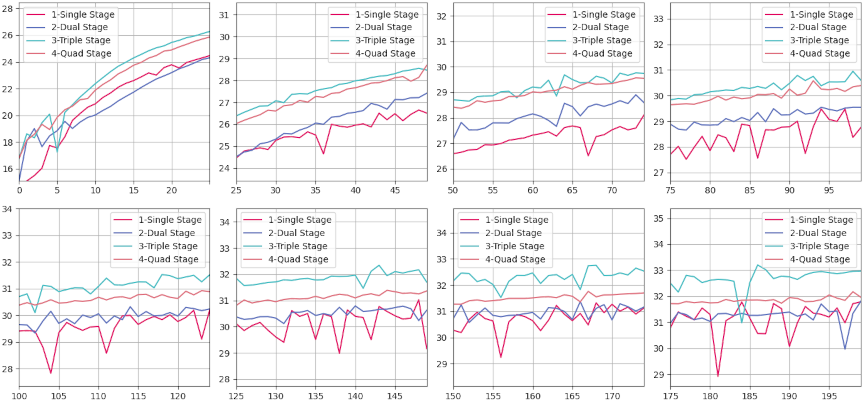
Fig. 7. Evaluation results of PSNR for CT images generated by various models compared with corresponding real CT images, measured over a training period of 0–200 epochs. Each subplot represents a window of 25 epochs, with the horizontal axis indicating the number of epochs and the vertical axis representing PSNR values. PSNR, expressed in decibels (dB), quantifies the quality of reconstruction of the generated CT images relative to real images, with higher values indicating better image fidelity.
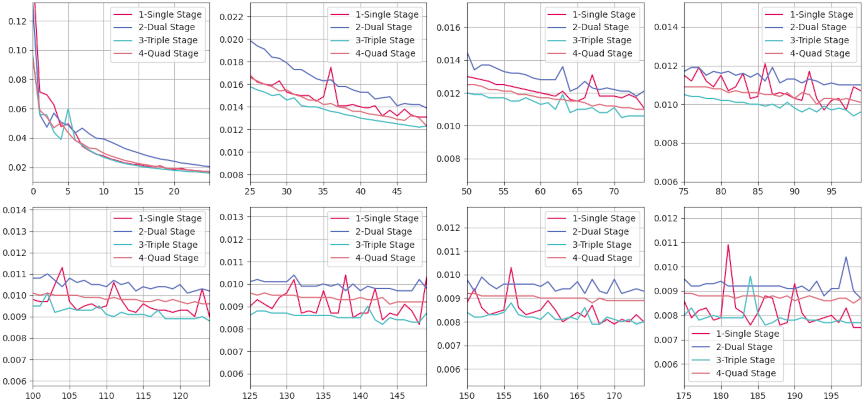
Fig. 8. MAE evaluation results for CT images generated by various models compared to the corresponding real CT images over a training duration spanning from 0–200 epochs. Each subplot within the figure represents a discrete training interval of 25 epochs, with the horizontal axis denoting the epoch count and the vertical axis indicating MAE values. MAE measures the average magnitude of the errors between the generated and real CT images, where lower values signify a closer approximation to the actual images.
Overall, the results suggest that moderately increasing the number of stages can yield measurable improvements, whereas excessive architectural depth may lead to diminishing returns and increased risk of overfitting. Fig. 6 illustrates the SSIM convergence patterns: fluctuations during the early epochs (0–25) reflect rapid parameter adaptation, followed by a stable plateau (100–200 epochs) indicating consistent structure preservation. The triple-stage model maintained the highest SSIM across the entire training process, confirming its ability to capture fine-grained anatomical details without excessive complexity.
Similarly, Fig. 7 shows PSNR rapidly increasing in the initial training phase, then plateauing with minor oscillations after epoch 100. Again, the triple-stage network consistently outperformed its counterparts in reconstruction quality. In Fig. 8, all models exhibit a steep initial drop in MAE; however, the triple-stage configuration achieved and sustained the lowest MAE, representing an optimal balance between the underfitting tendencies of single-stage models and the overfitting or computational overhead risks associated with four-stage designs.
Evidently, the triple-stage model offers the optimal synergy of accuracy, stability, and efficiency, enabling precise feature extraction while maintaining robust generalizability. This makes it the preferred choice for high-precision cross-modal medical image synthesis. Future work will explore advanced training strategies to further enhance reconstruction fidelity and robustness, particularly in complex clinical scenarios.
5.2. Quantitative Results of the Triple Stage Generator Optimized with Brightness-Sensitive Loss
Table 6 compares various methods on SSIM, PSNR, and MAE.
Table 6. Results achieved by compared models.

Classical CNN/GAN methods (U-Net, U-GAT-IT, RIED-Net, and ResViT) generally maintained higher SSIM/PSNR, reflecting solid structural reconstruction capabilities. CycleGAN, Pix2Pix, UNIT, and MUNIT exhibited weaker performance on medical images with complex structures. MedPrompt achieved the highest PSNR (23.33), indicating strong overall fidelity. TripleStage and TripleStage+BSLoss excelled in MAE, with the luminance-sensitive variant also achieving the best SSIM (0.85). This suggests that fine-grained luminance guidance helps capture critical intensity details while balancing structural fidelity. In conclusion, TripleStage+BSLoss showed outstanding error control and structural accuracy, making it highly suitable for medical imaging tasks that demand precision. Future research may explore more advanced training strategies or modular architectures to further enhance model robustness.
6. Discussion
6.1. Texture Comparison Experiments
We performed a visual comparison of images generated by different models, as illustrated in Fig. 9. The original PET and real CT images served as references. A single-stage GAN yielded a blurry image with color artifacts, while TCGAN exhibited overly smooth textures, lacking structural detail. MedPrompt introduced spurious vertical shadows, indicating discrepancies from the real CT. By contrast, DSG-GAN captured certain subtle brain features, although the overall texture remained less consistent than desired.
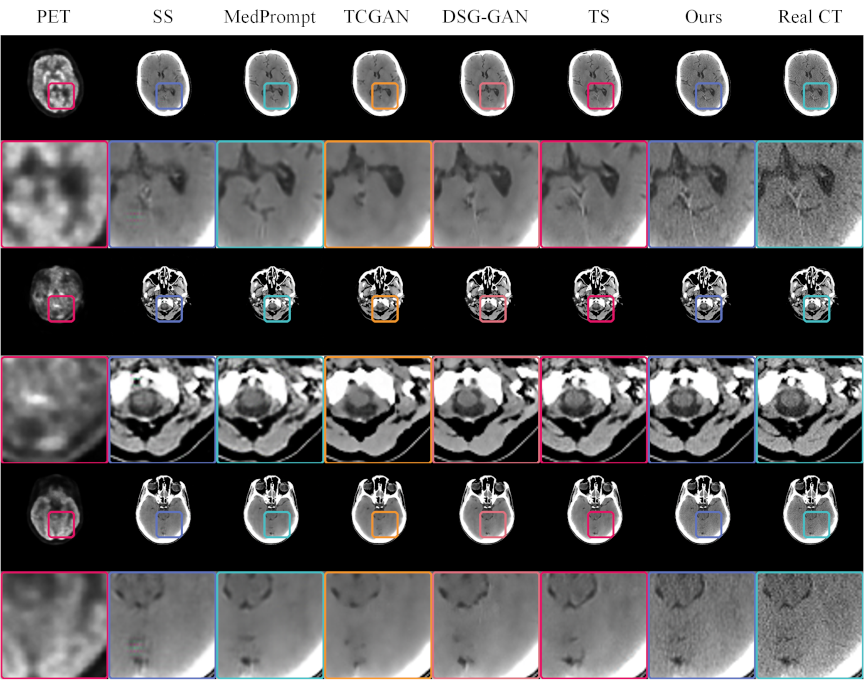
Fig. 9. CT images generated by various models, compared with real PET and CT images. The odd rows present the complete paired PET–CT images, while the even rows provide magnified views of specific regions within these pairs. Each model uses the PET image located at the extreme left as the input. The real CT images positioned at the extreme right serve as references for comparison. This format allows for a detailed evaluation of the ability of each model to replicate the structural and textural details found in real CT scans, facilitating a direct assessment of their performance in medical imaging applications.
Fig. 10. Pixel value distribution of CT images generated by various methods. The horizontal axis represents the average pixel value, while the vertical axis indicates the count of these pixel values. The lines in the chart depict the overall distribution patterns of pixel values across the CT images. The proximity of these lines to the line representing real CT images serves as a metric for similarity; closer distances between the lines suggest a higher statistical resemblance to the actual CT image distribution.
Fig. 11. \(3\times5\) subplots. The displayed series of \(3\times5\) subplots delineates the pixel value discrepancies between synthetic CT images generated by various models and actual CT images. The horizontal axis represents the difference in the mean pixel values at corresponding locations between the synthetic and real CT images. The vertical axis quantifies the frequency of these pixel value differences, with each subplot having a distinct scale on the vertical axis. This design choice facilitates intuitive cross-comparison by aligning the horizontal axes across subplots. Such an arrangement allows for a direct visual assessment of the differences, highlighting the performance of each model in reproducing the pixel value distribution found in genuine CT scans. This structured presentation aids in evaluating the efficacy of each synthetic approach in capturing the detailed characteristics of medical images.
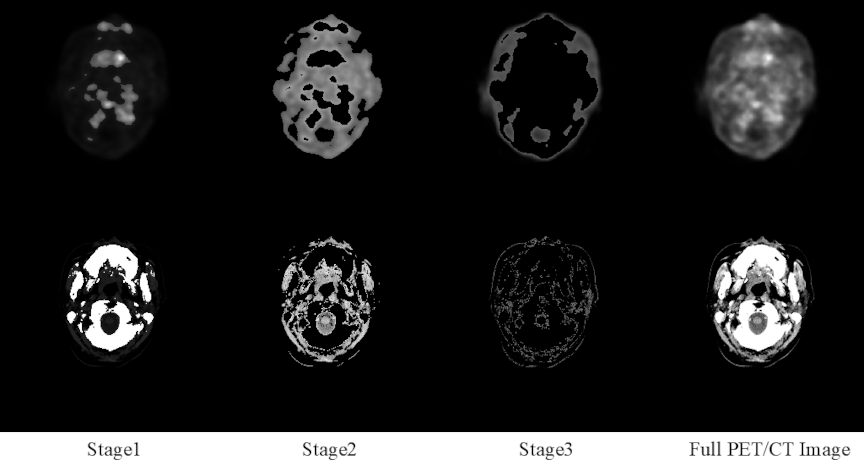
Fig. 12. Region segmentation in complete PET–CT images using the brightness-sensitive loss function. In the first row, Columns 1–3 show the segmented regions, and the last column shows the complete PET image. The second row shows Columns 1–3 display its segmented regions, and the complete CT image in the last column.
Notably, the triple-stage network attained superior global texture fidelity, despite missing some localized details. Integrating a brightness-sensitive loss function further refined texture reproduction, as evident in magnified views like rows 2, 4, and 6, demonstrating closer alignment with real CT images. These findings underscore the effectiveness of a cascading multistage GAN architecture for cross-modal medical image generation, suggesting potential for early disease screening applications.
6.2. Pixel Distribution Analysis
Figure 10 compares the pixel distributions of generated and real CT images. The horizontal axis denotes pixel values, and the vertical axis represents pixel counts across RGB channels. In most subplots, peaks exceeding 50,000 indicate that low-intensity regions dominate both real and generated images, reflecting broad distribution consistency.
Focusing on mid-range intensities, such as [88,117] and [108,118], the triple-stage model matched real-image distributions more closely than the baseline methods. DSG and the triple-stage network also aligned well in certain intervals, although reliance of DSG on VGG loss appeared to downplay brighter regions, such as [252,254]. By contrast, the triple-stage model optimized with brightness-sensitive loss maintained distributions close to those of real CT images in these intervals and sustained higher pixel counts, indicating improved fidelity across a wider intensity range.
These pixel-level analyses confirm that multistage architectures, particularly those with brightness-sensitive constraints, more accurately replicate critical luminance features. This understanding supports future optimizations of generative models and enhances their ability to preserve essential clinical details in medical images.
6.3. Statistical Graph of Pixel Differences Between Real CT and Generated Images
Figure 11 categorizes difference values into discrete intervals. In the first row and first to third columns, differences beyond 159 in absolute value are negligible, except for TCGAN around [252,254]. Moreover, minimal deviations appear in the fourth and fifth columns of the first row and the first and second columns of the third row, reflecting high overall fidelity among several methods.
Notably, the [\(-57\),57] range dominates the difference distribution; in the second row and third column, the vertical axis peaks at 54,000, indicating a large proportion of zero-difference pixels. This observation highlights the strong performance of the current algorithms in reproducing real CT intensities. In the second and fourth columns of the second row, within narrower intervals such as [\(-30\),\(-15\)], [15,40], our proposed method consistently yields fewer differences compared to other approaches, underscoring superior reconstruction accuracy. This analysis provides a nuanced perspective for further algorithmic refinements in cross-modal image generation.
6.4. Novelty and Interpretability
Cross-Modal Conversion Advantage: The proposed multistage extended generative network, integrated with a brightness-sensitive loss function, assigns adaptive weights to regions of varying brightness. This enables the network to priorities diagnostically critical details. By addressing the limitation of conventional uniform loss functions, which tend to overlook small yet clinically significant lesions, our method substantially improves the clinical accuracy and utility of the generated images.
Hierarchical Learning Advantage: The triple-stage generator consists of three collaboratively operating sub-modules:
-
Stage 1–Structural Constrainer: Captures and reinforces the overall anatomical layout, ensuring the accuracy of the macro-structure.
-
Stage 2–Texture Refiner: Further enriches tissue textures and edge fidelity on the structurally coherent basis established in Stage 1.
-
Stage 3–Fusion Synthesizer: Integrates multi-scale features from the preceding stages to harmonize structure and texture in the final output.
This task-oriented decomposition effectively resolves the long-standing challenge whereby a single-stage model struggles to simultaneously optimize structural clarity and textural realism, distinguishing our approach from classical designs or naive multistage stacking strategies.
Model Interpretability: This study employed a streamlined encoder–decoder architecture. Multistage cascade experiments of up to four stages revealed that the three-stage variant achieved the best overall performance. Building upon this observation, we introduced a brightness-sensitive loss function that decomposes the cross-modal translation task into three brightness-weighted subtasks, enabling each generator to focus on a specific high-priority region, as illustrated in Fig. 12.
The first row of Fig. 12 presents the original PET image and its three segmented regions obtained via thresholding within the brightness-sensitive loss. The second row shows the corresponding original CT image and its segmented regions. Conceptually, this design parallels partitioning a style-transfer problem into three brightness-defined regions, processed sequentially by three generators, each dedicated to a distinct focus area. The synergistic integration of the brightness-sensitive loss with the multistage generator not only improves quantitative accuracy but also substantially enhances the interpretability of the entire framework.
7. Conclusion
This study proposed an extended multistage generator framework that systematically addresses cross-modal medical image translation. By decomposing the task into three focused stages—image structure, texture, and key regions—each encoder–decoder pair is optimized for a single objective, mitigating precision bottlenecks that often arise from simply deepening or widening network layers.
Experimental results confirmed the high fidelity of generated CT images relative to real CT scans, as evidenced by favorable performance on SSIM, MAE, and other core metrics. These findings underscore the capacity of the framework to capture nuanced features and maintain structural integrity, highlighting its potential as an early disease screening aid. Although gaps persist between generated and real images from a purely technical standpoint, our study indicates that cross-modal medical image synthesis holds considerable promise for clinical research and applications.
We acknowledge several limitations of this study. The dataset is relatively small and lacks multi-institutional diversity, which may limit generalizability. The current pipeline is restricted to a single translation direction (PET\(\rightarrow\)CT) and a narrow set of acquisition protocols, leaving other modality pairs and acquisition settings underexplored.
In future work, we will extend the framework beyond PET\(\rightarrow\)CT to additional directions and modalities, including CT\(\rightarrow\)PET and MRI\(\rightarrow\)PET, and assess performance on larger multimodality datasets. We also plan to combine quantitative metrics with clinically meaningful endpoints and structured radiologist assessments to enhance clinical feasibility and support seamless integration into diagnostic and screening workflows.
Acknowledgments
A preliminary version of this study was presented at the International Conference on Machine Learning and Cybernetics (ICMLC 2025). The present paper provides an extended analysis with a new dataset and revised model architecture. This work was supported by JSPS KAKENHI Grant Number JP23K28367, and partially funded by the White Rock Foundation. The authors also acknowledge the Anhui Provincial International Joint Research Center for Advanced Technology in Medical Imaging, School of Computer Science and Technology, Anhui University in collaboration with the Sino-Canadian Health Research Institute for providing the brain PET/CT dataset used in this study.
- [1] H. Schöder, Y. E. Erdi, S. M. Larson, and H. W. D. Yeung, “PET/CT: A new imaging technology in nuclear medicine,” European J. of Nuclear Medicine and Molecular Imaging, Vol.30, No.10, pp. 1419-1437, 2003. https://doi.org/10.1007/s00259-003-1299-6
- [2] M. W. Saif, I. Tzannou, N. Makrilia, and K. Syrigos, “Role and Cost Effectiveness of PET/CT in Management of Patients with Cancer,” The Yale J. of Biology and Medicine, Vol.83, No.2, pp. 53-65, 2010.
- [3] O. Ronneberger, P. Fischer, and T. Brox, “U-Net: Convolutional Networks for Biomedical Image Segmentation,” N. Navab, J. Hornegger, W. M. Wells, and A. F. Frangi (Eds.), Medical Image Computing and Computer-Assisted Intervention – MICCAI 2015, Lecture Notes in Computer Science, Vol.9351, pp. 234-241, 2015. https://doi.org/10.1007/978-3-319-24574-4_28
- [4] P. Isola, J.-Y. Zhu, T. Zhou, and A. A. Efros, “Image-to-Image Translation with Conditional Adversarial Networks,” 2017 IEEE Conf. on Computer Vision and Pattern Recognition (CVPR), pp. 5967-5976, 2017. https://doi.org/10.1109/CVPR.2017.632
- [5] T. Wang, Y. Lei, Y. Fu, J. F. Wynne, W. J. Curran, T. Liu, and X. Yang, “A review on medical imaging synthesis using deep learning and its clinical applications,” J. of Applied Clinical Medical Physics, Vol.22, Issue 1, pp. 11-36, 2021. https://doi.org/10.1002/acm2.13121
- [6] S. Kaji and S. Kida, “Overview of image-to-image translation by use of deep neural networks: Denoising, super-resolution, modality conversion, and reconstruction in medical imaging,” Radiological Physics and Technology, Vol.12, No.3, pp. 235-248, 2019. https://doi.org/10.1007/s12194-019-00520-y
- [7] M. E. Rayed, S. M. S. Islam, S. I. Niha, J. R. Jim, M. M. Kabir, and M. Mridha, “Deep learning for medical image segmentation: State-of-the-art advancements and challenges,” Informatics in Medicine Unlocked, Vol.47, Article No.101504, 2024. https://doi.org/10.1016/j.imu.2024.101504
- [8] K. Suzuki, “Overview of deep learning in medical imaging,” Radiological Physics and Technology, Vol.10, No.3, pp. 257-273, 2017. https://doi.org/10.1007/s12194-017-0406-5
- [9] V. Sevetlidis, M. V. Giuffrida, and S. A. Tsaftaris, “Whole Image Synthesis Using a Deep encoder–decoder Network,” S. A. Tsaftaris, A. Gooya, A. F. Frangi, and J. L. Prince (Eds.), “Simulation and Synthesis in Medical Imaging,” Lecture Notes in Computer Science, Vol.9968, pp. 127-137, 2016. https://doi.org/10.1007/978-3-319-46630-9_13
- [10] F. Hashimoto, M. Ito, K. Ote, T. Isobe, H. Okada, and Y. Ouchi, “Deep learning-based attenuation correction for brain PET with various radiotracers,” Annals of Nuclear Medicine, Vol.35, No.6, pp. 691-701, 2021. https://doi.org/10.1007/s12149-021-01611-w
- [11] J. Zhang, Z. Cui, C. Jiang, J. Zhang, F. Gao, and D. Shen, “Mapping in Cycles: Dual-Domain PET-CT Synthesis Framework with Cycle-Consistent Constraints,” L. Wang, Q. Dou, P. T. Fletcher, S. Speidel, and S. Li (Eds.), “Medical Image Computing and Computer Assisted Intervention (MICCAI 2022),” Lecture Notes in Computer Science, Vol.13436, pp. 758-767, 2022. https://doi.org/10.1007/978-3-031-16446-0_72
- [12] Y. Lecun, L. Bottou, Y. Bengio, and P. Haffner, “Gradient-based learning applied to document recognition,” Proc. of the IEEE, Vol.86, Issue 11, pp. 2278-2324, 1998. https://doi.org/10.1109/5.726791
- [13] J. Pons, S. Pascual, G. Cengarle, and J. Serrà, “Upsampling Artifacts in Neural Audio Synthesis,” 2021 IEEE Int. Conf. on Acoustics, Speech and Signal Processing (ICASSP 2011), pp. 3005-3009, 2021. https://doi.org/10.1109/ICASSP39728.2021.9414913
- [14] I. J. Goodfellow, J. Pouget-Abadie, M. Mirza, B. Xu, D. Warde-Farley, S. Ozair, A. Courville, and Y. Bengio, “Generative Adversarial Nets,” Advances in Neural Information Processing Systems, Vol.27, 2014.
- [15] C. Guo, M. Szemenyei, Y. Yi, W. Wang, B. Chen, and C. Fan, “SA-UNet: Spatial Attention U-Net for Retinal Vessel Segmentation,” 2020 25th Int. Conf. on Pattern Recognition (ICPR), pp. 1236-1242, 2021. https://doi.org/10.1109/ICPR48806.2021.9413346
- [16] O. Petit, N. Thome, C. Rambour, L. Themyr, T. Collins, and L. Soler, “U-Net Transformer: Self and Cross Attention for Medical Image Segmentation,” C. Lian, X. Cao, I. Rekik, X. Xu, and P. Yan (Eds.), “Machine Learning in Medical Imaging,” Lecture Notes in Computer Science, Vol.12966, pp. 267-276, 2021. https://doi.org/10.1007/978-3-030-87589-3_28
- [17] A. Singh, J. Kwiecinski, S. Cadet, A. Killekar, E. Tzolos, M. C. Williams, M. R. Dweck, D. E. Newby, D. Dey, and P. J. Slomka, “Automated nonlinear registration of coronary PET to CT angiography using pseudo-CT generated from PET with generative adversarial networks,” J. of Nuclear Cardiology, Vol.30, Issue 2, pp. 604-615, 2023. https://doi.org/10.1007/s12350-022-03010-8
- [18] X. Dong, T. Wang, Y. Lei, K. Higgins, T. Liu, W. J. Curran, H. Mao, J. A. Nye, and X. Yang, “Synthetic CT generation from non-attenuation corrected PET images for whole-body PET imaging,” Physics in Medicine & Biology, Vol.64, No.21, Article No.215016, 2019. https://doi.org/10.1088/1361-6560/ab4eb7
- [19] J. Li, Y. Wang, Y. Yang, X. Zhang, Z. Qu, and S. Hu, “Small animal PET to CT image synthesis based on conditional generation network,” 2021 14th Int. Congress on Image and Signal Processing, BioMedical Engineering and Informatics (CISP-BMEI), 2021. https://doi.org/10.1109/CISP-BMEI53629.2021.9624232
- [20] H. Wang, X. Wang, F. Liu, G. Zhang, G. Zhang, Q. Zhang, and M. L. Lang, “DSG-GAN: A dual-stage-generator-based GAN for cross-modality synthesis from PET to CT,” Computers in Biology and Medicine, Vol.172, Article No.108296, 2024. https://doi.org/10.1016/j.compbiomed.2024.108296
- [21] J. Li, Z. Qu, Y. Yang, F. Zhang, M. Li, and S. Hu, “TCGAN: A transformer-enhanced GAN for PET synthetic CT,” Biomedical Optics Express, Vol.13, Issue 11, pp. 6003-6018, 2022. https://doi.org/10.1364/BOE.467683
- [22] X. Chen, S. Luo, C.-M. Pun, and S. Wang, “MedPrompt: Cross-modal Prompting for Multi-task Medical Image Translation,” Z. Lin, M.-M. Cheng, R. He, K. Ubul, W. Silamu, H. Zha, J. Zhou, and C.-L. Liu (Eds.), “Pattern Recognition and Computer Vision,” Lecture Notes in Computer Science, Vol.15044, pp. 61-75, 2025. https://doi.org/10.1007/978-981-97-8496-7_5
- [23] J. Liang, H. Zeng, and L. Zhang, “High-Resolution Photorealistic Image Translation in Real-Time: A Laplacian Pyramid Translation Network,” Proc. of 2021 IEEE/CVF Conf. on Computer Vision and Pattern Recognition (CVPR), pp. 9387-9395, 2021. https://doi.org/10.1109/CVPR46437.2021.00927
- [24] O. Dalmaz, M. Yurt, and T. Cukur, “ResViT: Residual Vision Transformers for Multimodal Medical Image Synthesis,” IEEE Trans. on Medical Imaging, Vol.41, Issue 10, pp. 2598-2614, 2022. https://doi.org/10.1109/TMI.2022.3167808
- [25] F. Gao, T. Wu, X. Chu, H. Yoon, Y. Xu, and B. Patel, “Deep Residual Inception Encoder–Decoder Network for Medical Imaging Synthesis,” IEEE J. of Biomedical and Health Informatics, Vol.24, Issue 1, pp. 39-49, 2020. https://doi.org/10.1109/JBHI.2019.2912659
- [26] M.-Y. Liu, T. Breuel, and J. Kautz, “Unsupervised Image-to-Image Translation Networks,” Proc. of the 31st Int. Conf. on Neural Information Processing Systems (NIPS’17), pp. 700-708, 2017.
- [27] X. Huang, M.-Y. Liu, S. Belongie, and J. Kautz, “Multimodal Unsupervised Image-to-Image Translation,” V. Ferrari, M. Hebert, C. Sminchisescu, and Y. Weiss (Eds.), “Proc. of the European Conf. on Computer Vision (ECCV2018),” Lecture Notes in Computer Science, Vol.11207, pp. 179-196, 2018. https://doi.org/10.1007/978-3-030-01219-9_11
- [28] M.-Y. Liu, X. Huang, A. Mallya, T. Karras, T. Aila, J. Lehtinen, and J. Kautz, “Few-Shot Unsupervised Image-to-Image Translation,” Proc. of 2019 IEEE/CVF Int. Conf. on Computer Vision (ICCV), pp. 10550-10559, 2019. https://doi.org/10.1109/ICCV.2019.01065
- [29] M. K. Sherwani and S. Gopalakrishnan, “A systematic literature review: Deep learning techniques for synthetic medical image generation and their applications in radiotherapy,” Frontiers in Radiology, Vol.4, Article No.1385742, 2024. https://doi.org/10.3389/fradi.2024.1385742
This article is published under a Creative Commons Attribution-NoDerivatives 4.0 Internationa License.