
Research Paper:
Fused Filament Fabrication Using Cellulose Nanofiber Composites: Development of Filament with Higher Fiber Content and Evaluation of Fabricated Objects
Yosuke Kiminami* and Toshitake Tateno**,†

*Graduate School of Science and Technology, Meiji University
1-1-1 Higashimita, Tama-ku, Kawasaki, Kanagawa 214-8571, Japan
**Meiji University
Kawasaki, Japan
†Corresponding author

Fused filament fabrication is a type of material extrusion process category of additive manufacturing. Because the material is prepared in the form of filaments, a wide variety of materials including composite materials with continuous fibers can be used. With the recent increase in environmental consciousness, the use of biodegradable composites using polylactic acid (PLA) and continuous cellulose nanofiber (CNF) strings has garnered attention from the scientific community. However, the fiber content of the composites remains low, preventing full exploitation of the ultrahigh intrinsic strength of CNFs. In this study, we proposed two methods to increase fiber content. First, we modified the cross-sectional shape of the filament from circular to rectangular to increase the fiber content. Second, we optimized the process parameters during filament fabrication by adjusting the feed rates of continuous CNFs and PLA, resulting in a higher fiber content up to 35%. Following this, filaments with higher fiber content were used in fabrication experiments. Tensile tests of the fabricated specimens showed that the mechanical strength increased with the fiber content. Finally, we present an application example of the developed CNF filament for reinforcing finger orthosis.
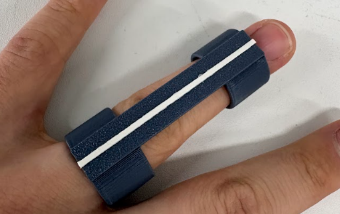
FFF using continuous CNF composites
1. Introduction
Additive manufacturing (AM) is a technology that builds three-dimensional (3D) objects by stacking materials such as polymers and metals based on a 3D model. Fused filament fabrication (FFF) is a type of material extrusion process category in official AM terminology. In FFF, a thermoplastic filament is heated, melted, and extruded through a nozzle to form objects layer-by-layer.
Compared with other AM methods, FFF offers advantages such as simple and low-cost equipment and the ability to handle a wide variety of materials. However, plastic materials generally have low strength, making it difficult to use them directly for mechanical components. Therefore, many studies have focused on the use of composite materials. By combining polymers with high-strength materials, such as glass and carbon fibers, their strength can be improved 1. A representative example is carbon-fiber-reinforced plastic (CFRP) 2,3, which offers excellent mechanical properties, such as high strength and low weight.
CFRP can be categorized into two types: (1) fiber-reinforced plastics containing short or long fibers dispersed in a matrix, and (2) continuous fiber-reinforced plastics. In general, structures fabricated using continuous fibers exhibit higher strength 4. Furthermore, the high tensile strength is optimized by tailoring the fiber orientation according to the load direction using fiber placement technology.
However, CFRPs have significant environmental drawbacks, including difficulties in recycling and high costs associated with incineration, often resulting in disposal of these materials into landfills. Environmental issues such as global warming and pollution have become increasingly critical in recent years. The adoption of the Sustainable Development Goals by the United Nations in 2015 5 has further emphasized the importance of achieving a sustainable society.
The pollution caused by marine plastics is a major environmental concern. Plastics and microplastics in the ocean do not decompose and remain in the environment almost permanently, posing risks to marine ecosystems and human health 6,7. As the awareness of these issues increases, many companies are focusing on carbon-neutral materials and environmentally friendly manufacturing processes.
In FFF, efforts have been made to replace petroleum-based plastics with biomass-derived materials and develop biodegradable materials 8,9. For example, previous studies have improved the mechanical properties by combining polylactic acid (PLA) with natural fibers such as hemp 10,11. Recently, cellulose nanofibers (CNFs) 12, which exhibit higher strength than hemp fibers, have attracted attention from the scientific community.
CNFs are fibrous materials obtained by the nanoscale fibrillation of plant-derived cellulose such as wood. These fibers are known to be five times stronger than steel and one-fifth of its weight. The tensile strength is improved by mixing discontinuous CNFs and PLA 13,14. However, increasing the CNF content leads to aggregation, which makes it difficult to further improve the mechanical properties. To overcome this limitation of discontinuous CNFs, the use of continuous CNFs to reinforce PLA in FFF has been proposed 15. In this approach, dried CNF sheets are cut into narrow strips and joined to form continuous fibers, which are then combined with PLA to fabricate filament materials for FFF. Tensile tests of specimens fabricated using this method have confirmed improved strength compared with PLA-only specimens 16. However, the fiber content remains limited to \(\sim\)20%, preventing full utilization of the potential strength of CNFs.
Therefore, in this study, we proposed two methods to increase the fiber content of CNFs. Composite filaments with higher fiber contents were fabricated and used in FFF processes, and the fabricated objects were evaluated in terms of accuracy and mechanical strength.
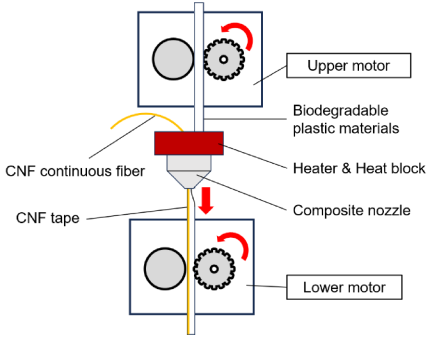
Fig. 1. CNF filament fabrication process.
2. Proposed Method
2.1. Biodegradable AM Using CNF Tape
This section outlines the fabrication method for composite filaments and printing method for biodegradable AM using CNF tape.
First, the fabrication method of the CNF filament, which is composed of continuous CNFs and biodegradable resin, is described. Fig. 1 shows the filament fabrication process. A composite nozzle is heated and a biodegradable resin material such as PLA is fed from the upper motor. The resin is heated inside the composite nozzle using a heater, and the melt resin is combined with solid-state CNF sheets. The extruded CNF composite is cooled to the solid state by the ambient air and shaped into a filament, which is then pulled by a lower motor. The resulting filament is referred to as “CNF tape.”
Next, the FFF method is described. The fabrication process follows the same principle as the conventional FFF, as shown in Fig. 2. However, because the CNF tape has a higher rigidity than the molten resin, it is difficult to change its orientation during deposition. Therefore, the object is fabricated by repeatedly forming straight deposition paths and cutting filament at the ends.
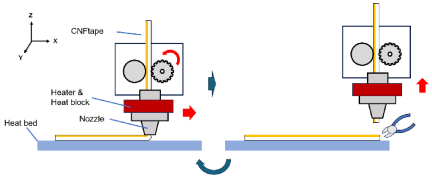
Fig. 2. FFF process using CNF filament.
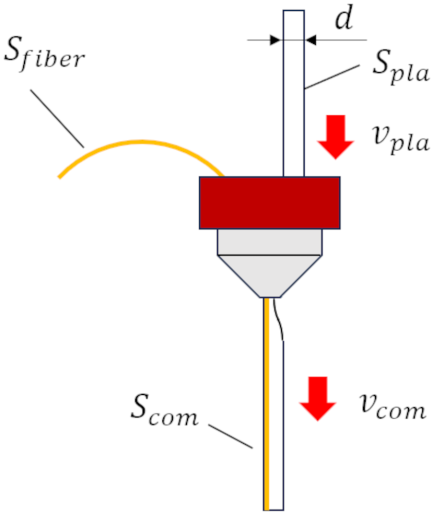
Fig. 3. Process parameters of the composite filament fabrication.
2.2. Adjustment of the Fiber Content via Process Parameters
The process parameters for controlling the fiber content in the composite filament are illustrated in Fig. 3.
Let \(S_{\mathit{fiber}}\) be the cross-sectional area of the continuous CNFs, \(S_{\mathit{pla}}\) be the cross-sectional area of PLA, and \(S_{\mathit{com}}\) be the cross-sectional area of the composite filament. Let \(v_{\mathit{pla}}\) denote the feeding speed of the upper motor supplying the PLA and \(v_{\mathit{com}}\) denote the take-up speed of the lower motor.
If neither the PLA filament nor the CNF sheet contains air bubbles or cavities before mixing, it can be assumed that there is no change in mass or volume before and after mixing. Assuming incompressible materials and the conservation of mass, the following equation holds true:
The speed ratio \(\mathit{SR}\) is defined as
Because \(S_{\mathit{fiber}}\) remains constant before and after the composite process, the ratio of PLA to CNF in the filament can be controlled by adjusting the speed ratio \(\mathit{SR}\). It is important to note that the cross-sectional area of the composite does not depend on the material speed. After passing through the nozzle, the cross-sectional area becomes constant and is determined by the relationship between the input and output amounts of the nozzle. The dependence of the cross-sectional area on the speed ratio is the same for both mass and volume ratios.
If the PLA filament has a circular cross section with diameter \(d\), and the CNF has a rectangular cross section with width \(a\) and thickness \(b\), then
Substituting these into the previous equation yields
In this study, the fiber content is controlled by adjusting the speed ratio \(\mathit{SR}\), thereby increasing the fiber content by reducing the resin proportion.
2.3. Cross-Sectional Shape of the Composite Filament
Filament diameters of 1.75 mm are commonly used in many studies on composite materials. When continuous fibers with nearly circular cross sections, such as hemp fibers, are used as they can maintain their shape within the filament and can be extruded without problems. However, in the case of sheet-like continuous fibers such as CNF sheets, the fibers may twist inside the filament due to internal movement. This can cause nozzle clogging, fiber deformation, or damage. To address this issue, we proposed a filament with a rectangular cross section. This design suppressed fiber twisting and increased the fiber content.
3. Evaluation of Material Strength of CNF Sheets
Tensile tests were conducted to evaluate the mechanical properties of the CNF sheets. A commercially available CNF sheet (Risho Kogyo) with dimensions of \(\mbox{500}~\mbox{mm}\, \times\, \mbox{500}~\mbox{mm}\, \times\, \mbox{0.2}~\mbox{mm}\) was used. Two types of specimens were tested in this study. The first was the dumbbell-shaped specimen, which followed JIS K 7127 Type 1B, and was cut using a dumbbell cutter. The other was the strip-shaped specimen, which was cut into strips with a width of \(\sim\)1.36 mm using a food-cutting machine. Because the roughness of the side surface of the specimen generally affects its tensile strength, the test was also conducted using the same strip that was used as a continuous fiber in the composite filament for FFF. An acrylic ultraviolet resin was applied to prevent damage to the gripping sections. The distance between the gripping sections was used as the gauge length.
The dumbbell- and strip-shaped specimens are shown in Figs. 4 and 5, respectively. Four specimens for each type were prepared for the tensile tests.
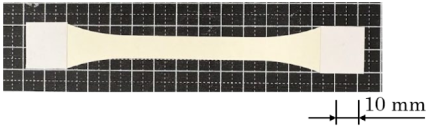
Fig. 4. CNF dumbbell-shaped specimen.
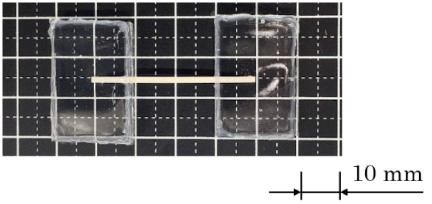
Fig. 5. CNF strip-shaped specimen.
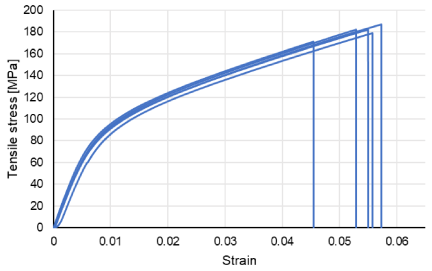
Fig. 6. Stress–strain curves of the CNF dumbbell-shaped specimens.
The nominal stress and nominal strain were used for evaluation. The thickness was measured using a digital micrometer. The cross-sectional area was calculated using the average values.
Tensile tests were conducted using a universal testing machine (Shimadzu EZ-LX) at a speed of 1 mm/min. The specimens were reinforced with vinyl tape to prevent damage to the gripped sections.
The stress–strain curves of the dumbbell-shaped specimens are shown in Fig. 6. The results indicated a low variability and a high tensile strength of \(\sim\)180 MPa. Compared with the typical tensile strength of PLA (50–60 MPa), the CNF sheets exhibited approximately three times higher strength. This confirmed that the CNF sheets were effective as reinforcement materials for PLA.
The stress–strain curves of the strip-shaped specimens are shown in Fig. 7. The results showed that the average maximum tensile stress was \(\sim\)165 MPa, indicating high strength. However, compared with the dumbbell-shaped specimens, the variability was larger, and the strength was slightly reduced. This is likely due to the deterioration of the side surfaces during cutting. The dumbbell-shaped specimens were cut with specialized sharp teeth, whereas the strip-shaped specimens were cut with blunt teeth made for the food-cutting machine. Regarding this variability, our previous study showed that the roughness of the lateral surfaces of CNFs can be suppressed in composite materials with PLA. Nevertheless, the strength still significantly exceeded that of PLA, indicating that the CNF strip-shaped specimens were suitable as reinforcement materials.
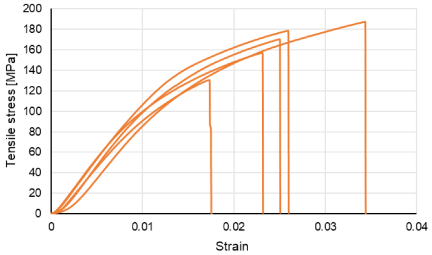
Fig. 7. Stress–strain curves of the CNF strip-shaped specimens.
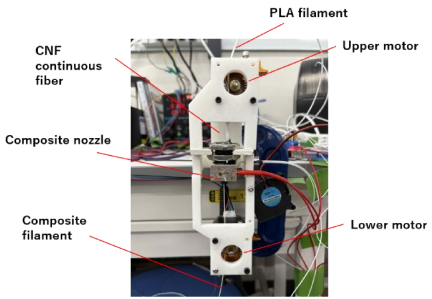
Fig. 8. Photograph of the composite filament fabrication system. CNF: cellulose nanofiber.
4. Fabrication and Evaluation of the Composite Filaments
Based on a previous study 11, we developed a system for fabricating composite filaments consisting of continuous fibers and resin. The system is shown in Fig. 8. The basic structure followed that of prior work and we made two improvements to enhance the performance. First, the shape of the composite nozzle was modified from a circular to a rectangular cross section, as shown in Fig. 9. Second, the driven-side bearing attached to the lower motor was changed from a grooved bearing to a nongrooved bearing (NTN, 624ZZ).
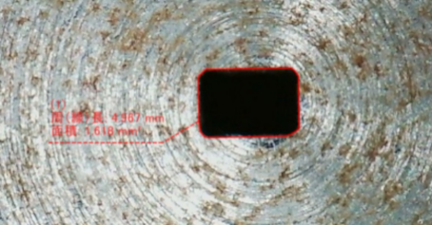
Fig. 9. Outlet shape of the rectangular nozzle.
| Upper motor speed [rad/s] | \(\pi/36\), \(\pi/18\), \(\pi/9\) |
| Speed ratio | 1–4 (1,2,3,4) |
| Diameter of bearing at the lower motor [mm] | 13 |
| Nozzle shape | Rectangle (1 mm \(\times\) 1.5 mm) |
| Nozzle temperature [°C] | 155 |
| Cross-sectional area of nozzle hole [mm\(^2\)] | 1.618 |
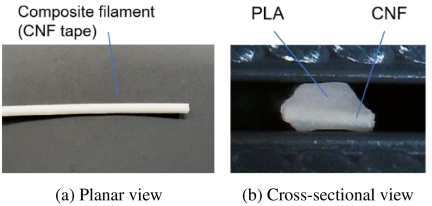
Fig. 10. Photographs of the fabricated composite filament (CNF tape). PLA: polylactic acid.
To increase the fiber content, it is necessary to adjust the speeds of the upper and lower motors during the continuous fiber composite process. In this study, the fiber content was controlled by varying the speed ratio \(\mathit{SR}\) defined in Eq. (6). The upper motor speed was set to three levels: \(\pi/36\), \(\pi/18\), and \(\pi/9\) rad/s.
For each condition, the speed ratio \(\mathit{SR}\) was varied from 1 to 4. Five composite filaments were fabricated for each condition, resulting in 60 samples.
The fabrication conditions are summarized in Table 1. The resin filament used was PLA with a diameter of 1.75 mm (FlashForge, white). Fig. 10 shows the photographs of the fabricated composite filaments.
We also evaluated three factors, namely, the CNF mass content, cross-sectional area, and surface properties of the composite filaments.
4.1. CNF Mass Content
The fiber mass content was calculated using
To determine this value, both the mass of the continuous CNFs and the mass of the composite filament are required.
First, we employed a method to directly measure the weight . Five CNF samples, each 200 mm in length, were prepared. Their total mass was measured three times using an electronic balance, and the average value was divided by the number of samples to obtain the mass per fiber. Similarly, composite filaments of 200 mm in length were prepared (five samples per condition), and the average mass per filament was calculated. These values were substituted into the above equation to determine the fiber mass content.
The relationship between the speed ratio and fiber mass content is shown in Fig. 11. The results showed that the fiber mass content increased monotonically as the speed ratio \(\mathit{SR}\) increased, demonstrating the theoretical formula given by Eq. (3). As the \(\mathit{SR}\) increased, the take-up speed of the lower motor increased, reducing the amount of resin per unit length. Since the fiber length remained unchanged, the relative fiber content increased.
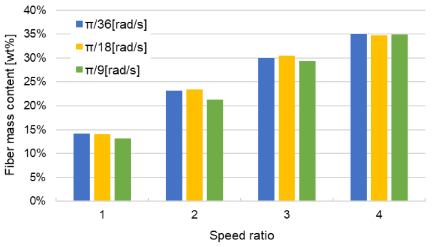
Fig. 11. Relationship between the speed ratio and fiber mass content for each upper motor speed.
This confirmed that adjusting the speed ratio was effective for controlling the fiber content. Furthermore, the maximum fiber content achieved was \(\sim\)35%, which was a significant improvement compared with the typical fiber content of 20%.
4.2. CNF Cross-Sectional Area of the Composite Filament
During filament fabrication, defects such as bubbles may form inside the PLA, causing expansion of the filament volume.
To evaluate this, the theoretical cross-sectional area was calculated using Eq. (6) and compared with the experimentally measured values. The width \(a\) and thickness \(b\) of the CNFs were taken as the average values measured, as described in Section 2.2. Here, \(a=1.36\) and \(b=0.20\).
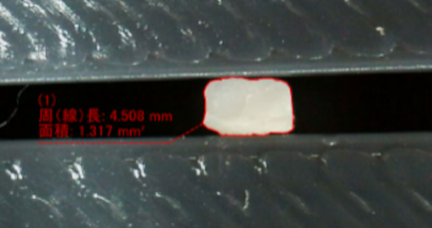
Fig. 12. Cross-sectional image used to measure the cross-sectional area.
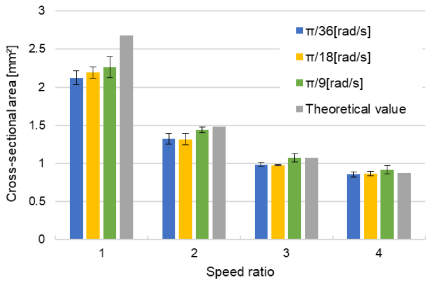
Fig. 13. Relationship between the speed ratio and cross-sectional area for each upper motor speed.
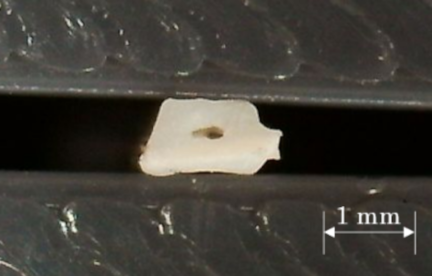
Fig. 14. Cross-sectional image of filament fabricated at high upper motor speed. Voids were observed near the center of the filament.
The fabricated composite filaments were used to measure the cross-sectional area. A 10-mm segment was cut from each filament, and its cross section was measured using image analysis, as shown in Fig. 12. Five samples were measured for each condition and the average values were used for comparison.
The measured and theoretical cross-sectional areas are plotted against the speed ratio in Fig. 13. At a speed ratio of 1, the measured cross-sectional area was significantly smaller than the theoretical value. This is attributed to the high resistance when pushing the resin, resulting in slippage between the filament and the drive gear or leakage of the molten resin. At a higher overall speed (\(\pi/9\)), voids were observed in the cross section, as shown in Fig. 14. Because the measured cross-sectional area included these voids, the values appeared to be larger than the actual material cross section.
Bubbles might form due to the impregnation of resin into the CNFs, caused by the excessive take-up speed of the lower motor. Consequently, the air in the CNFs was transferred into the resin and formed voids upon cooling. Because the resulting cross-sectional area was sometimes larger than that calculated using the formula (as shown in Fig. 13), we inferred that the voids expanded during mixing. Furthermore, because the void expanded in the radial direction, we perceived that it affected the cross-sectional area, but it did not affect the mass ratio.
These results indicated that reducing the overall process speed was necessary to suppress void formation and improve the adhesion between the CNFs and resin.
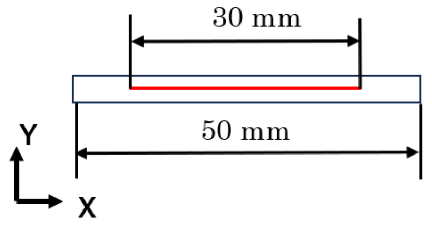
Fig. 15. Surface property measurement position of the composite filament. The measurement was made 30 mm in the longitudinal direction (\(x\)-axis) of a filament cut to a length of 50 mm.
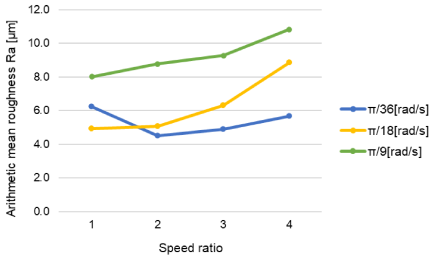
Fig. 16. Relationship between the speed ratio and surface roughness \(R_a\) for each upper motor speed.
4.3. Surface Properties
Surface roughness measurements were conducted to evaluate the influence of the process parameters on the surface properties of the composite filaments. A complementary metal oxide semiconductor laser sensor (Keyence, ILS100) and positioning stage (COMS, PM80B-200XY) were used to acquire the 3D surface data. The arithmetic mean roughness \(R_a\) was calculated using 3D analysis software. The cut-off value was set to 2.5 mm.
A 50-mm segment was cut from each filament and the central 30-mm region was measured along the longitudinal direction. The measurement position is illustrated in Fig. 15. Five samples were analyzed for each condition.
The relationship between the speed ratio and surface roughness \(R_a\) is shown in Fig. 16.
It can be seen that the surface roughness increased as the speed ratio increased except for the lowest upper motor speed condition (\(\pi/36\)). This is attributed to bubble formation. At a high speed ratio (\(\mathit{SR}=4\)) and upper motor speed of \(\pi/9\), traces of burst voids were observed on the surface (Fig. 17). These voids are caused by insufficient resin impregnation, which leads to surface irregularities. In addition, the contact between the drive gear of the lower motor and the filament can deteriorate the surface condition. At higher take-up speeds, the cooling time is shorter, and the filament may still be soft when in contact with the gear, resulting in surface deformation.
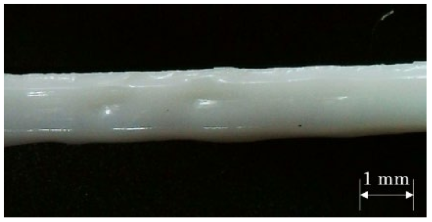
Fig. 17. Image of the filament surface fabricated at a high take-up speed.
By contrast, when the upper motor speed was low (\(\pi/36\)), we did not observe any significant changes in surface roughness, even at higher speed ratios. This is because lower speeds promote better impregnation and allow sufficient cooling before gear contact.
These results suggest that lower processing speeds are preferable for improving impregnation and surface quality.
4.4. Optimal Filament Fabrication Conditions
The optimal fabrication conditions must be selected based on fiber content, cross-sectional quality, surface conditions, and production speed. Each factor has a trade-off, and no single condition is optimal for all criteria. Therefore, a balanced condition (upper motor speed: \(\pi/18\), speed ratio: 4) was selected for subsequent fabrication experiments.
5. Fused Filament Fabrication Experiments
5.1. Effect of Tool Path on the Fabrication Accuracy
The FFF-AM system using a CNF tape is shown in Fig. 18. The system consisted of a desktop three-axis robot equipped with an extruder and a heated bed.
In this study, a drive gear modified for rectangular filaments was used, as shown in Fig. 19. A bearing (NTN, 694ZZ/5K) with an outer diameter of 11 mm was combined with a grooved guide ring and fabricated using a conventional FFF machine. A filament guide was also installed above the extruder to ensure stable feeding.
The fabrication procedure followed the procedure described in Section 2.1. The deposition paths are shown in Fig. 20, where extrusion was performed sequentially along paths \(\textrm{A} \to \textrm{B}\), \(\textrm{C} \to \textrm{D}\), and \(\textrm{E} \to \textrm{F}\). Straight-line tool paths were used. At the end of each path, extrusion was temporarily stopped and the filament was cut. The starting position was then shifted and the process was repeated. This procedure built an object consisting of three parallel paths in a single layer.
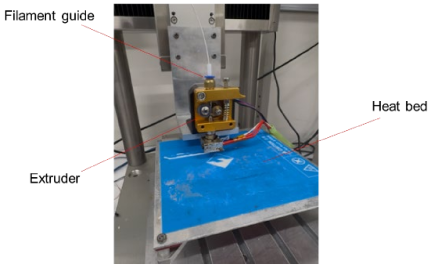
Fig. 18. Photograph of the FFF-AM system.
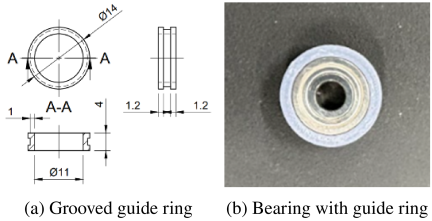
Fig. 19. Drive gear for the rectangular filament.
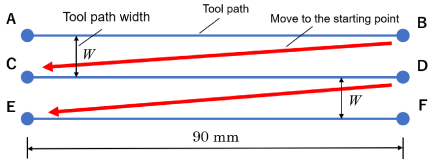
Fig. 20. Tool paths used in the experiment.
The tool path width \(W\) was varied from 1.0 mm to 2.0 mm in 0.2 mm increments. In addition, because gaps began to appear visually at \({W=2.0}\), two additional conditions (\({W= 2.1}\) and \({W=2.2}\)) were tested, resulting in eight types of specimens. After fabrication, both ends of each specimen were cut to a length of 50 mm. The dimensions of the specimens are shown in Fig. 21 and the process parameters used in the fabrication experiment are shown in Fig. 22. The fabrication conditions are summarized in Table 2.
In continuous-fiber AM, it is necessary to match filament feeding and tool speeds to prevent fiber bending or breakage. The tool speed \(v_{\mathit{tool}}\) is calculated as
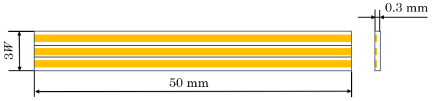
Fig. 21. Dimensions of the fabricated object.
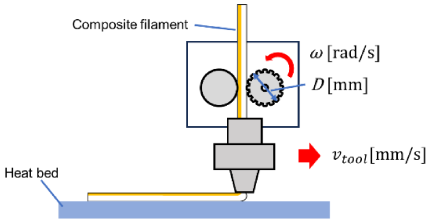
Fig. 22. Process parameters used in the fabrication experiment.
| Upper motor speed used for filament fabrication [rad/s] | \(\pi/18\) |
| Speed ratio used in filament fabrication | 4 |
| Tool speed \(v\) [mm/s] | 2.7 |
| Diameter of drive gear \(D\) | 10.6 |
| Angular velocity of drive gear \(\theta\) | \(\pi/6\) |
| Layer height [mm] | 0.3 |
| Nozzle temperature [°C] | 170 |
| Heat bed temperature [°C] | 60 |
| Nozzle diameter [mm] | 1.5 |
In FFF, an “ironing effect” is often used to smooth surfaces by pressing the nozzle against the extruded material 17. This can reduce voids 18 and internal defects 19, which degrade the filament strength. However, when continuous fibers are used, it is difficult to select appropriate tool paths to avoid fiber damage and internal gaps 20. In this study, the fabricated specimens were evaluated based on the relationship between the ironing effect and tool path width.
Three-dimensional surface data were obtained using the same method described in Section 4.3. The surface roughness \(R_a\) was measured along the \(x\)-axis direction at three positions in the central 30 mm region of the specimen, as shown in Fig. 23, and the geometric profiles were evaluated along the \(y\)-axis direction at five equally spaced positions by measuring the difference between the maximum and minimum heights, as shown in Fig. 24.
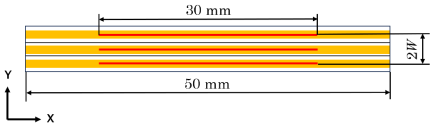
Fig. 23. Surface property measurement of the composite filament along the \(x\)-axis.
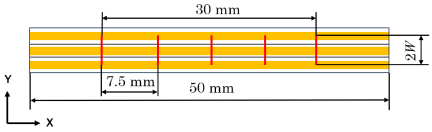
Fig. 24. Surface property measurement of the composite filament along the \(y\)-axis.
Photographs of the fabricated specimens at \({W=1.4}\) and \({W=2.2}\) are shown in Fig. 25. An example of the \(y\)-axis direction profile measurement is shown in Fig. 26. The relationship between the tool path width \(W\) and surface roughness \(R_a\) is shown in Fig. 27. The minimum roughness was observed at \({W=1.6}\), and the surface roughness increased as \(W\) decreased or increased. However, the variations were \(\sim\)1.5–4.0 μm, which were relatively small. Here, the surface roughness of the fabricated object was compared with that of the filament. The surface roughness \(R_a\) of the composite filament under an upper motor speed of \(\pi/18\) and speed ratio of 4 was \(\sim\)9.0 μm, as shown in Fig. 16. By contrast, the \(R_a\) of the fabricated object was evidently lower, indicating a smoother surface. This is likely due to the ironing effect.
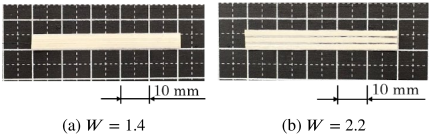
Fig. 25. Photographs of the fabricated specimens for the accuracy experiment.
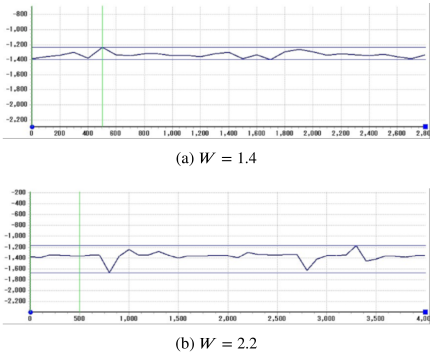
Fig. 26. Examples of the profile measurement along the \(y\)-axis.
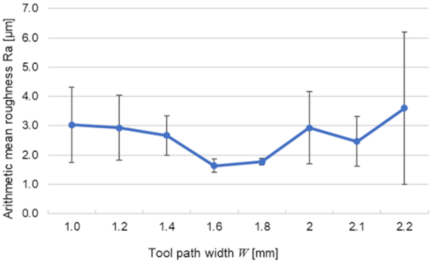
Fig. 27. Relationship between the tool path width and surface roughness.
The relationship between the tool path width and height difference is shown in Fig. 28. As \(W\) increased, the height difference increased, indicating the formation of grooves and gaps. At \({W=2.2}\), the height difference exceeded 500 μm, which was similar to the layer height, indicating complete gaps. By contrast, when the width of the deposition path was small, the height difference was small. However, when \({W=1.0}\) and \({W=1.2}\), the spacing was smaller than the width of the continuous CNF (1.36 mm), resulting in overlapping fibers. Although a flat surface was obtained under these conditions, the reason for this phenomenon remains unclear and further investigation is required in future work.
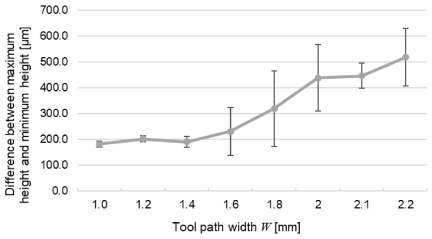
Fig. 28. Relationship between the tool path width and height difference.
Based on these results, \({W=1.4}\) was selected as the most appropriate value to achieve a stable geometry and was used as the design parameter for the specimens in subsequent tensile tests.
5.2. Effect of Fiber Content on the Mechanical Strength
The specimens were fabricated using the tool path width \({W=1.4}\) selected in the previous section and a CNF tape having a higher fiber content. Two types of specimens with different fiber contents were fabricated (four specimens for each type), and tensile tests were conducted to evaluate the effect of the fiber content. The fabrication conditions are tabulated in Table 3. The specimens fabricated using filaments with speed ratios of 3 and 4 were designated as SR3 and SR4, respectively. The dimensions of the specimens are shown in Fig. 29.
The cross-sectional area used to calculate the nominal stress was obtained from the image measurements, as shown in Fig. 30. To prevent damage during the tensile tests, acrylic ultraviolet resin was applied to the gripping sections, as shown in Fig. 31. The distance between the grips was used as the gauge length.
| Upper motor speed used in filament fabrication [rad/s] | \(\pi/18\) |
| Speed ratio used in filament fabrication | 3, 4 |
| Tool speed \(v\) [mm/s] | 2.7 |
| Diameter of drive gear \(D\) | 10.6 |
| Angular velocity of drive gear \(\theta\) | \(\pi/6\) |
| Layer height [mm] | 0.3 |
| Tool path width \(W\) | 1.4 |
| Nozzle temperature [°C] | 170 |
| Heat bed temperature [°C] | 60 |
| Nozzle diameter [mm] | 1.5 |
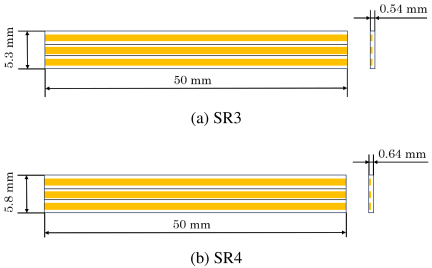
Fig. 29. Dimensions of the specimens.
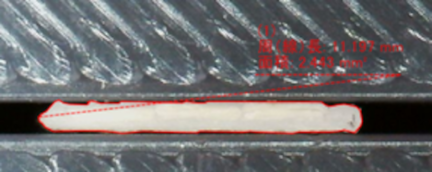
Fig. 30. Cross-sectional image used for measurement.
The stress–strain curves for the SR3 and SR4 specimens are shown in Fig. 32. The average maximum tensile strength was \(\sim\)75 and 86 MPa for the SR3 and SR4 specimens, respectively. For comparison, the PLA-only specimens exhibited a tensile strength of \(\sim\)49 MPa 16. These results confirmed that CNF reinforcement improved the strength of PLA. An increase of \(\sim\)5% in fiber content increased the tensile strength by \(\sim\)11 MPa. This indicated that increasing the fiber content by reducing the resin content was effective in enhancing the mechanical properties. When compared with the experimental results for the CNF strips, the difference between the maximum and minimum tensile strengths of the CNF strips in Fig. 7 was \(\sim\)60 MPa, whereas the corresponding differences for the composites in Fig. 32 were limited to \(\sim\)10 MPa for both the SR3 and SR4 specimens.
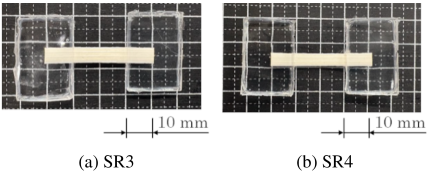
Fig. 31. Photographs of the fabricated specimens for the strength experiment.
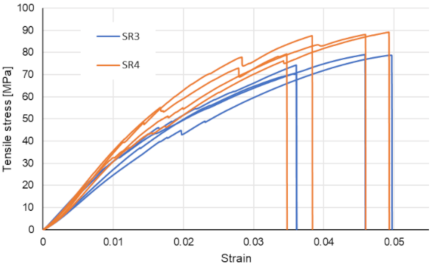
Fig. 32. Stress–strain curves of the fabricated specimens.
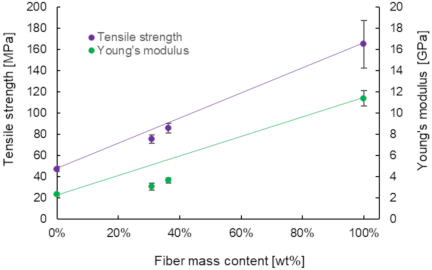
Fig. 33. Relationship between the fiber mass content and tensile strength and Young’s modulus.
Figure 33 shows the relationship between the fiber mass content and tensile strength and Young’s modulus. The data for the PLA-only specimen in the figure were obtained from the literature 16 and did not have error bars. The other data represent the average and standard deviations obtained from the experiments in this study. To compare the results with the rule of mixtures, the experimental results for PLA-only and CNF sheet-only specimens were connected by a straight line. The tensile strength of the printed specimens approximately followed this trend, whereas the Young’s modulus was lower than expected. This can be attributed to the delamination of the continuous CNFs. As shown in Fig. 34, delamination occurred in the continuous CNFs inside the specimen. The resulting voids caused the fibers to solidify in a bent state, which led to a reduction in the Young’s modulus.
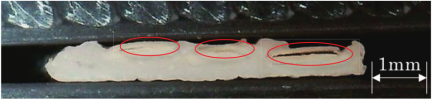
Fig. 34. Cross-sectional image of the fabricated specimen. Delamination inside the fibers is apparent, as highlighted by the red circles.
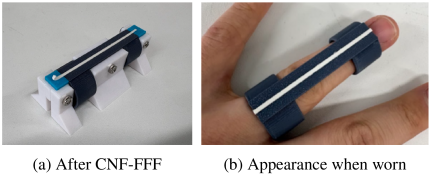
Fig. 35. Fabricated finger orthosis as an application example. CNF-FFF: cellulose nanofibers-fused filament fabrication.
6. Application Example
A finger orthosis was fabricated as an application example of a biodegradable AM using CNF tape. First, an orthosis consisting of two rings attached to a slender plate was fabricated with PLA using a conventional FFF machine (Bambu Lab, P1S). After fabrication, the orthosis was mounted and fixed to a jig, with the rings facing downward and the plate facing upward. CNF tapes were then added to the flat surface of the plate for reinforcement using the same method described in Section 5.1.
In this study, different FFF machines were used to fabricate the plate with rings and deposit the CNF tape. However, because both processes are based on the same FFF method, the entire structure can be fabricated integrally using a single FFF machine. In this case, a jig is unnecessary.
The results of the CNF sheet reinforcement and fabricated orthosis attached to a finger are shown in Fig. 35. The CNF sheet was firmly bonded to the surface. In this experiment, only a single path of CNF tape was deposited. However, it is also possible to deposit multiple paths or embed the CNF tape within the structure by making a cover over it.
Through this example, we confirmed that FFF enabled easy fabrication of a finger orthosis customized to the user’s size, and that reinforcement using CNF tape can also be easily implemented. Furthermore, because the orthosis is made from biodegradable materials, its environmental impact remains low even if it is disposed after use.
7. Conclusion
In this study, we proposed two methods for increasing the fiber content in biodegradable AM using CNFs, and we evaluated the fabricated objects.
In fabricating composite filaments, we successfully increased the fiber content by adjusting the speed ratio between the upper and lower motors in the FFF system. Increasing the speed ratio reduced the amount of resin while keeping the amount of fibers constant, thereby increasing the fiber content up to 35%.
We found that the nozzle speed had a greater influence on the surface quality of the composite filaments than the speed ratio. Insufficient impregnation at high speeds resulted in the formation of voids. Therefore, reducing the processing speed was crucial to improve the surface quality.
In the fabrication experiments, the most appropriate tool path width was determined to be 1.4 mm, which minimized variations and prevented gaps without overlapping of continuous CNFs.
Furthermore, the tensile tests demonstrated that increasing the fiber content improved the mechanical strength in accordance with the rule of mixtures.
We fabricated a finger orthosis as an application example of the proposed fabrication method. The results confirmed that the objects fabricated using conventional FFF could be easily reinforced using CNF tape.
These results confirmed the effectiveness of the proposed method for enhancing the fiber content and improving the mechanical properties of CNF-based biodegradable AM.
- [1] A. N. Dickson, J. N. Barry, K. A. McDonnell, and D. P. Dowling, “Fabrication of continuous carbon, glass and Kevlar fibre reinforced polymer composites using additive manufacturing,” Addit. Manuf., Vol.16, pp. 146-152, 2017. https://doi.org/10.1016/j.addma.2017.06.004
- [2] V. Acanfora, A. Sellitto, A. Russo, M. Zarrelli, and A. Riccio, “Experimental investigation on 3D printed lightweight sandwich structures for energy absorption aerospace applications,” Aerosp. Sci. Technol., Vol.137, Article No.108276, 2023. https://doi.org/10.1016/j.ast.2023.108276
- [3] K. Jimbo, T. Shitani, S. Nakajima, and S. Morita, “Design optimization of continuous fiber arrangement using lamination parameters in material extrusion-based additive manufacturing,” Int. J. Automation Technol., Vol.18, No.5, pp. 712-720, 2024. https://doi.org/10.20965/ijat.2024.p0712
- [4] X. Kong, G. Sun, Q. Luo, V. Brykin, and J. Qian, “Experimental and theoretical studies on 3D printed short and continuous carbon fiber hybrid reinforced composites,” Thin-Walled Struct., Vol.205, Part A, Article No.112406, 2024. https://doi.org/10.1016/j.tws.2024.112406
- [5] Department of Economic and Social Affairs, United Nations, “Transforming our world: The 2030 Agenda for Sustainable Development,” https://sdgs.un.org/2030agenda [Accessed March 5, 2026]
- [6] T. R. Walker, L. Wang, A. Horton, and E. G. Xu, “Micro(nano)plastic toxicity and health effects: Special issue guest editorial,” Environ. Int., Vol.170, Article No.107626, 2022. https://doi.org/10.1016/j.envint.2022.107626
- [7] F. A. S. Islam, “The effects of plastic and microplastic waste on the marine environment and the ocean,” Eur. J. Environ. Earth Sci., Vol.6, No.3, pp. 1-9, 2025. https://doi.org/10.24018/ejgeo.2025.6.3.508
- [8] D. Xing et al., “3D-printing continuous plant fiber/polylactic acid composites with lightweight and high strength,” Polym. Compos., Vol.46, No.6, pp. 4967-4980, 2025. https://doi.org/10.1002/pc.29178
- [9] V. Dananjaya, M. Yang, Y. Zheng, and C. Abeykoon, “Effect of filler characteristics and processing route on bamboo powder-reinforced PLA composites,” J. Clean. Prod., Vol.537, Article No.147193, 2025. https://doi.org/10.1016/j.jclepro.2025.147193
- [10] M. D. H. Beg, K. L. Pickering, J. O. Akindoyo, and C. Gauss, “Recyclable hemp hurd fibre-reinforced PLA composites for 3D printing,” J. Mater. Res. Technol., Vol.33, pp. 4439-4447, 2024. https://doi.org/10.1016/j.jmrt.2024.10.082
- [11] Y. Yaguchi, K. Takeuchi, T. Waragai, and T. Tateno, “Durability evaluation of an additive manufactured biodegradable composite with continuous natural fiber in various conditions reproducing usage environment,” Int. J. Automation Technol., Vol.14, No.6, pp. 959-965, 2020. https://doi.org/10.20965/ijat.2020.p0959
- [12] T. Yi et al., “From cellulose to cellulose nanofibrils—A comprehensive review of the preparation and modification of cellulose nanofibrils,” Materials, Vol.13, No.22, Article No.5062, 2020. https://doi.org/10.3390/ma13225062
- [13] Q. Wang, C. Ji, L. Sun, J. Sun, and J. Liu, “Cellulose nanofibrils filled poly(lactic acid) biocomposite filament for FDM 3D printing,” Molecules, Vol.25, No.10, Article No.2319, 2020. https://doi.org/10.3390/molecules25102319
- [14] Z. Zhang et al., “3D printing of cellulose nanofiber/polylactic acid composites via an efficient dispersion method,” Compos. Commun., Vol.43, Article No.101731, 2023. https://doi.org/10.1016/j.coco.2023.101731
- [15] T. Tateno, “Environmentally conscious light-weight design and fabrication with continuous cellulose nanofiber string in additive manufacturing,” Proc. EcoDesign 2023, Article No.P3-2, 2024.
- [16] T. Tateno, A. Nishida, and Y. Kiminami, “Effect of CNF string on tensile strength of bio-degradable parts fabricated in fused filament fabrication,” Int, Conf, Exp. Mech., pp. 800-801, 2025.
- [17] Z. Zhang, Y. Long, Z. Yang, K. Fu, and Y. Li, “An investigation into printing pressure of 3D printed continuous carbon fiber reinforced composites,” Compos. A: Appl. Sci. Manuf., Vol.162, Article No.107162, 2022. https://doi.org/10.1016/j.compositesa.2022.107162
- [18] Q. He, H. Wang, K. Fu, and L. Ye, “3D printed continuous CF/PA6 composites: Effect of microscopic voids on mechanical performance,” Compos. Sci. Technol., Vol.191, Article No.108077, 2020. https://doi.org/10.1016/j.compscitech.2020.108077
- [19] C. O. Balderrama-Armendariz, A. A. Maldonado-Macias, E. MacDonald, J. I. Aguilar-Duque, and R. Garcia-Pereyra, “Square nozzle to improve mechanical performance and density in fused filament Fabrication additive manufacturing,” Manuf. Lett., Vol.40, pp. 179-184, 2024. https://doi.org/10.1016/j.mfglet.2024.05.004
- [20] H. Wang et al., “Additive manufacturing of continuous fiber reinforced composites with variable volume fractions,” Compos. A: Appl. Sci. Manuf., Vol.187, Article No.108504, 2024. https://doi.org/10.1016/j.compositesa.2024.108504
This article is published under a Creative Commons Attribution-NoDerivatives 4.0 Internationa License.