Research Paper:
Integration of Three-Dimensional Point Clouds and Sensing Data for Digital Twin-Oriented Construction Management
Satoshi Kubota*,†, Aika Yamaguchi**, Tomoharu Tanaka*, Kazana Harada*, Tsubasa Hayakawa*, and Kazuki Nakata*
*Faculty of Environmental and Urban Engineering, Kansai University
3-3-35 Yamatecho, Suita, Osaka 564-8680, Japan
†Corresponding author
**Graduate School of Science and Engineering, Kansai University
Suita, Japan

Construction sites vary widely in scale and conditions, making it difficult to adopt a unified method for acquiring three-dimensional (3D) data. Standardized procedures for transferring 3D data across project phases and practical methods for utilizing such data have not yet been established. This study proposes a construction information system based on point-cloud data to support the development of a construction site digital twin. Field experiments were conducted at small-, medium-, and large-scale construction sites to evaluate the system’s applicability across progress, quality, and safety management. For progress management, daily point-cloud data acquired by unmanned aerial vehicles and high-elevation cameras were superimposed to visualize construction progress, and quantitative assessment of earthwork changes was achieved through point-to-point distance analysis. For quality management, time-synchronized video data enabled reconstruction of past site conditions from multiple viewpoints. For safety management, a single worker’s position data and heart rate data were actually collected and visualized, and a conceptual use case for integrating biometric information with point-cloud data was presented. At large-scale construction sites, unified management was demonstrated by integrating point-cloud data from multiple work areas on a single data platform using coordinate assignment and time-axis management. In this study, work areas refer to spatial subdivisions used for construction management purposes, rather than contractual or organizational boundaries. The results indicate that the proposed system can support efficient progress sharing and enhance situational awareness among stakeholders.
Visualization of construction site digital twin
1. Introduction
Three-dimensional (3D) visualization of construction sites enables various applications, including safety management, quality control, and investigation of construction defects. However, construction sites differ significantly in scale, terrain, and construction progress, making it difficult to apply a unified method to acquire point-cloud data that accurately represent site conditions. In urban environments, previous studies collected data related to social infrastructure and urban activities and visualized them in 3D space, contributing to the development of digital twin technologies 1,2,3,4,5. In contrast, efforts to construct digital twins at construction sites remain limited. The types of data required for realizing digital twins in construction projects have not been clearly defined, and standardized procedures for transferring and utilizing data across project phases, such as surveying, design, construction, inspection, and maintenance, have not yet been established.
For small- to medium-scale construction sites, measurement methods must be adapted to site-specific conditions, and simplified measurement and modeling techniques are required to reduce the workload associated with data acquisition. Therefore, this study examines the accuracy of point-cloud data obtained using simplified measurement methods. At large-scale construction sites, it is difficult to construct 3D data for various structures because of their large scale, even if the site is divided into smaller work areas. Unmanned aerial vehicle (UAV)-mounted or handheld cameras require multiple measurement sessions, and the resulting datasets must be merged 6,7. Because merging is not required for small- to medium-scale sites, errors introduced during merging may reduce the data accuracy in large-scale environments. Therefore, appropriate measurement and data construction methods for large-scale sites must be examined. Informal interviews with on-site supervisors indicated that progress information was not always consistently shared across workplaces. Differences in responsibilities, update timing, and data-handling practices among contractors often result in fragmented information flow. As a result, supervisors and workers have difficulty understanding the progress in each work area. Progress confirmation requires time and may delay subsequent tasks, thereby reducing overall efficiency. Therefore, a mechanism for sharing progress information across an entire site is required. This practical observation further motivated the development of a unified platform that enables cross-area progress monitoring based on point-cloud data.
This study aims to enhance construction management and support the realization of digital twins for construction sites by defining the types of data that can be acquired on-site and proposing a digital twin framework based on point-cloud data. Point-cloud data from small- to medium-scale and large-scale sites were measured and integrated into a unified platform for centralized progress management. The progress is visualized by superimposing point-cloud datasets and performing a differential analysis. This study reorganizes and extends the content of previous studies 8,9,10,11 by implementing a construction information system and presenting practical applications and discussions based on its use at both small- to medium-scale and large-scale construction sites.
This study addresses the limitations of the existing research on UAV photogrammetry, TLS measurements, progress monitoring, and digital twin technologies. Many studies have examined these topics in isolation and have not provided an operational framework capable of integrating heterogeneous sensing data across multiscale construction sites. To overcome these gaps, this study proposes a point-cloud-centered information management foundation that can be deployed in daily construction operations. First, the study extends a construction information model originally developed for small-scale sites 8,9,11 to large-scale construction environments by expanding the point-cloud-centered data model and adapting the four-category classification of on-site data as dynamic, semi-dynamic, semi-static, and static into a unified class structure suitable for construction management. Building on this foundation, the proposed system is validated across multiple construction sites. In this study, the term “work areas” refers to spatial subdivisions defined for construction management purposes, and does not necessarily correspond to contract packages or organizational boundaries among contractors or subcontractors. In addition to the small- and medium-scale sites examined in our previous work, this study incorporated several large-scale construction projects including road relocation, bridge substructure construction, and extensive earthwork allowing the system to be tested under diverse site conditions and operational constraints. Through repeated on-site deployment across these projects, the system was refined based on practical feedback, thereby demonstrating its scalability and robustness in real construction workflows.
Through quantitative evaluation of measurement accuracy, processing time, and data volume using UAVs, TLS, and high-elevation cameras, this study demonstrates the practical applicability of the system. The proposed method integrates heterogeneous point-cloud datasets such as road relocation, bridge construction, and earthwork datasets within a single spatial and temporal platform. The system architecture is designed to support digital twin-based measurements, processing, management, and utilization. The architecture incorporates essential operational requirements, including daily data-acquisition frequency, coordinate assignment, data storage, and the integration of worker biometric data into an implementable system design. Finally, the study presents practical use cases in progress, quality, and safety management by combining point-cloud data, video logs, and biometric information. These examples demonstrate that digital twin-based construction management can be feasibly implemented at the site level, thereby providing evidence of its operational viability.
In summary, the novelty of this study lies in three aspects:
-
(1)
Extending a point-cloud-centered information model originally developed for small- and medium-scale sites to large-scale construction environments.
-
(2)
Integrating heterogeneous sensing data, including UAV photogrammetry, TLS, high-elevation cameras, and limited biometric logs, within a unified spatial and temporal platform.
-
(3)
Demonstrating the practical applicability through multisite field deployments that highlight operational constraints and data management requirements.
These points distinguish the present study from our previous work and existing research, which typically examined sensing modalities in isolation.
2. Challenges in Construction Information Management
A major challenge in construction information management is the absence of clearly defined specifications for the types of data that should be acquired and utilized at construction sites. In the field of digital twins for social infrastructure, Ye et al. 12 examined their application to bridge inspection, whereas Fujii et al. 13 reported that long intervals between data updates and the increased workload associated with data acquisition hindered the implementation of digital twins in maintenance operations. In civil engineering, buildingSMART International has established international standards for the use of 3D model data throughout design, construction, and maintenance 14, including the Industry Foundation Classes (IFC) 15. Although IFC provides a framework for defining 3D models, it does not specify data classifications tailored to construction-site operations.
Research on 3D data construction often involves UAV surveying 16,17 and terrestrial laser scanning 18,19. However, to promote ICT adoption among small and medium-sized enterprises, low-cost measurement and modeling methods using UAVs or cameras are required. When measuring specific structures, measurement strategies must consider the site scale and surrounding conditions. Existing studies on construction management using 3D data include progress monitoring with mobile mapping systems 20, project progress management 21, and four-dimensional construction modeling 22. Kanzaki 23 discussed the use of 3D models in planning, construction, and maintenance, but did not address the data transfer between these phases. Therefore, methods for transferring and utilizing data across the project stages must be clarified. The proposed point-cloud-centered framework differs from spatial-ID-based digital twin platforms 24. Spatial-ID systems rely on predefined semantic identifiers assigned to design components and are highly effective for asset management when detailed BIM/CIM models and stable component semantics are available. However, such model-dependent approaches are difficult to apply to construction sites where the geometry changes daily, temporary structures appear and disappear, and design information is often incomplete. In contrast, this study focuses on integrating heterogeneous sensing data such as UAV photogrammetry, TLS, high-elevation cameras, GNSS logs, video records, and biometric information within a unified spatial and temporal coordinate system without requiring semantic labeling. This approach is suitable for dynamic construction environments such as earthworks, road relocation, and early-stage bridge construction, where rapid geometric changes make semantic modeling impractical.
The data generated at construction sites can be collected and accumulated throughout the construction process. In process management, 3D terrain data can be used to record progress; in quality management, video data for remote inspections and terrain data can be utilized; and in safety management, worker position and biometric data can be applied. Although such data should ideally be stored daily, no systematic effort exists to accumulate data from planning to the completion for digital twin implementation. Consequently, the benefits of long-term data accumulation remain unclear, data definitions for on-site acquisition are lacking, and manual data collection from ICT machinery or wearable devices imposes additional burdens on workers.
In this study, point-cloud data were acquired and used for earthwork, bridge, and road construction. Absolute coordinates were assigned to the data constructed for centralized management. Point-cloud datasets acquired at different times were superimposed to visualize progress, and progress information was shared across the site to improve construction management efficiency. Construction sites involve simultaneous activities, resulting in constraints such as limited measurement position, angles, and noise from materials, scaffolding, vehicles, and workers. In addition, characteristic points may be lost owing to changes in the object geometry, and some areas may be unmeasurable depending on the progress conditions, creating further challenges for data acquisition and integration.
Daily data were acquired at the construction sites examined in this study using UAV photogrammetry, TLS, and a high-elevation camera. The acquired data were processed into georeferenced point-cloud data using bundle adjustment, GNSS-based coordinate assignment, and noise filtering. Video data were converted into compressed MP4 files. All processed data were stored on a local computer with tiered storage of high-resolution point clouds that were 5–20 GB per UAV flight and 10–30 GB per TLS scan, and were archived in lossless formats, while meshes and extracted frames were stored for daily viewing. At the small- and medium-scale sites, the total data volume accumulated over a typical three-month period ranged from approximately 0.5 to 1.5 TB. At large-scale sites, the daily UAV and TLS data resulted in large amount of data over the same duration. These values are consistent with the measurements obtained in our field trials. The contractor responsible for each work area performed daily updates, and the integrated dataset was shared with the site managers and supervisors through a unified platform for a cross-area progress review.
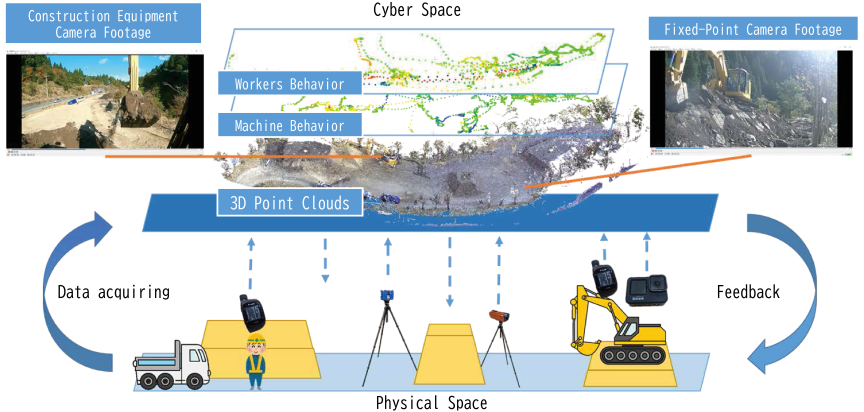
Fig. 1. Visualization of construction site digital twin 8,9.
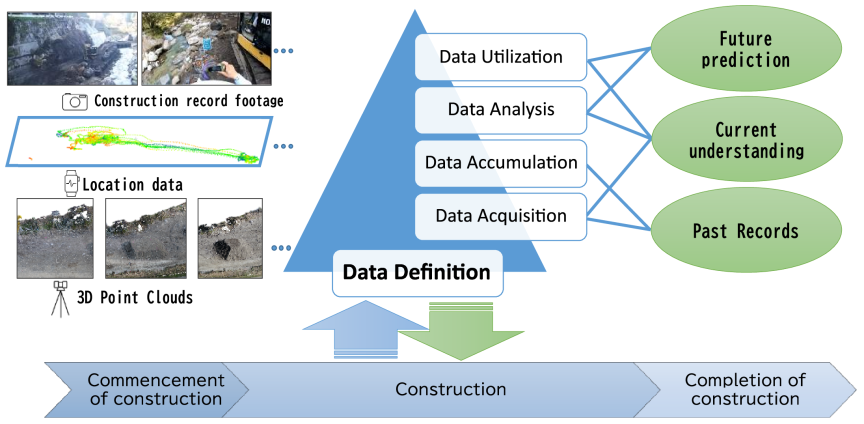
Fig. 2. Advanced construction with data utilization.
3. Definition of Digital Twins and Construction Information
3.1. Concept of a Construction Site Digital Twin
This study proposes a construction site digital twin that collects the data generated on construction sites, stores them as logs, and visualizes site conditions within a digital environment. A digital twin is grounded in the concept of a cyber-physical system 25 in which data from the physical environment are continuously collected, synchronized, and represented in 3D space. To construct such a digital twin, the required data types must be defined, and methods for visualizing site conditions must be established. In this study, point-cloud data obtained from various measurement devices serve as the primary data source. Use cases for data utilization are presented, and issues related to data acquisition, visualization, and accumulation for constructing a construction site digital twin are examined.
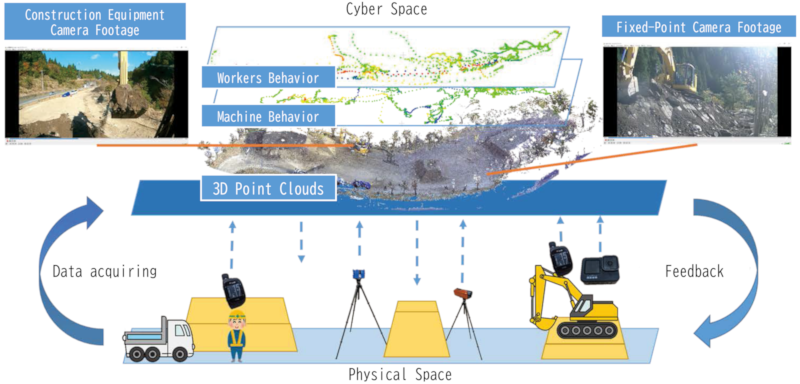
Figure 1 illustrates the concept of the construction site digital twin. Based on the idea of a digital thread, the system collects and stores daily progress and construction records throughout the construction period, from the initiation to the completion of civil engineering structures. A 3D representation of the construction site was created using point-cloud data, and the accumulated data were displayed to support construction planning and management. The construction site digital twin has three main functions (Fig. 2):
-
(1)
Record of the Past: It accumulates work records and changes in site data, serving as a data repository that can be referenced when needed in later project phases.
-
(2)
Understanding the Present: It reproduces the construction space in three dimensions within the digital environment, reflecting the current state of the physical site.
-
(3)
Prediction of the Future: It predicts construction progress based on accumulated historical data.
In this study, the functions of a construction site digital twin were conceptually organized into past recordings, present visualizations, and future predictions. Among these, this study implemented and evaluated only the first two functions. The prediction function is presented as a conceptual future capability that may be enabled by the accumulation of sensing data. However, it was not implemented or validated in this study.
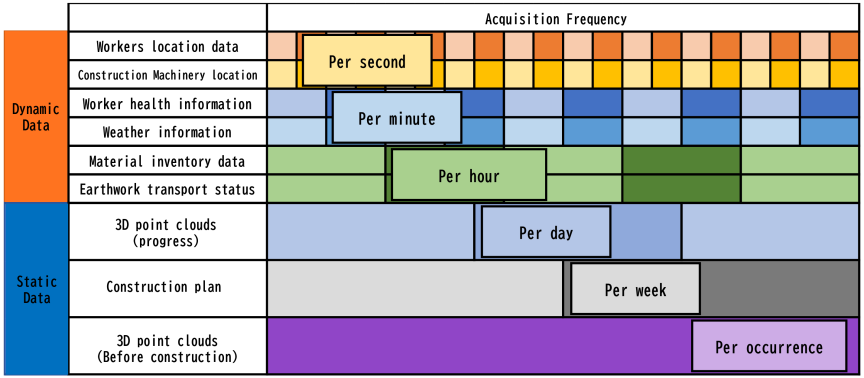
Fig. 3. Data acquisition frequency at the construction site.
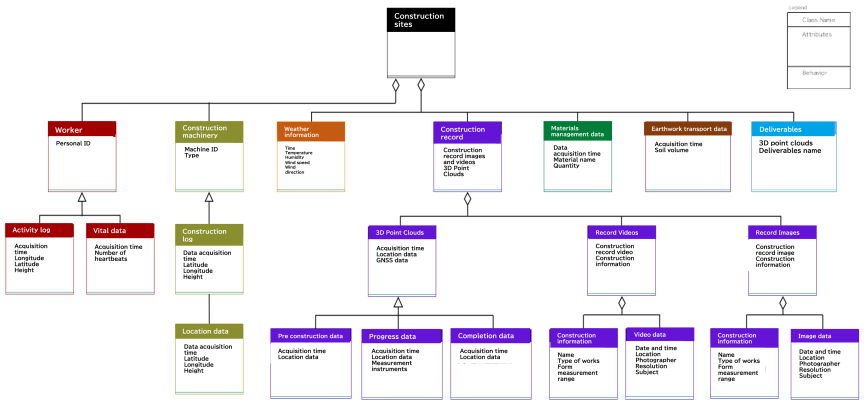
Fig. 4. Class diagram at the construction site.
3.2. Definition of Data Acquired on Construction Sites
3.2.1. Definition of Acquisition Frequency
In this study, the acquisition frequency of the construction site data was defined with reference to the local dynamic map framework used in autonomous driving systems 26, considering the continuously changing characteristics of construction sites. The data were classified into four categories: dynamic, semi-dynamic, semi-static, and static. Dynamic information refers to data acquired at short intervals within a single day, whereas static information refers to data acquired at longer intervals, typically exceeding one day. To ensure that construction site data remain up-to-date, acquisition frequencies are defined for each data category. Based on the source of data generation, construction site data are divided into two types: scan data manually acquired by workers and sensing data automatically collected by devices. The acquisition frequencies for each type are shown in Fig. 3.
Dynamic information consists of sensing data automatically collected as log data from devices, and is therefore acquired on a second-by-second basis. However, weather conditions and material management status do not change at constant intervals, and sensing them every second accumulates redundant data. Therefore, worker health and weather information were acquired on a minute basis, whereas material management and soil transport data were acquired on an hourly basis. Static information consists of scan data collected manually by workers; acquiring such data multiple times per day is impractical. Therefore, acquisition intervals longer than one day were defined. When the interval is extended to the yearly scale, the data can serve as long-term maintenance records. Because this study focuses on the construction phase, daily acquisition is used for routine records, weekly acquisition for data expected to change over longer periods, such as construction planning, and single-time acquisition for terrain data collected during initial and completion surveys.
The four-category classification was based on the rate of change in each data type and the management purpose for which the data were used. Dynamic information, such as worker and machinery locations, changes within seconds; therefore, second-level acquisition is necessary to detect collision risks. Semi-dynamic information including worker vital signs and weather conditions changes at a slower rate and is primarily used for monitoring trends, making minute-level acquisition sufficient. Semi-static information, such as material inventory and soil transport status, is used for operational planning and logistics management, and hourly acquisition balances information freshness with the burden of data processing and communication. Static information, including point-cloud data and construction plans, changes on a daily or longer basis and is used for progress tracking and long-term record keeping. Higher acquisition frequencies for these data types increase the data volume, processing time, and sharing latency without improving management effectiveness. This consideration proposes the recommended acquisition frequencies shown in Fig. 3.
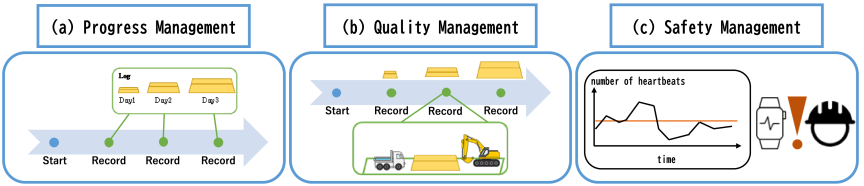
Fig. 5. Use cases at the construction site.
3.2.2. Creation of Class Diagrams
Based on the classification of construction information, class diagrams for data acquired at construction sites were created using the Unified Modeling Language notation (Fig. 4).
The Document Data class defines textual data manually created by personnel, such as construction plans and reports submitted to relevant organizations. Because such documents serve various purposes, their contents are not specified here; instead, they are categorized simply as data types. The Management Data class included quantitative data related to material management and soil transport. Because these data can be recorded manually or automatically using sensors, it is difficult to define them quantitatively. Considering that daily intervals did not capture intra-day variations, the acquisition frequency was set to an hourly basis. The Construction Record class is used to record the daily progress and includes construction photographs, construction videos, and 3D terrain data. Construction photographs are defined with reference to existing photo management practices and include information such as construction content, shooting date and time, and the photographer’s identity. Construction videos include all video data recorded on-site, such as footage from network cameras used for remote monitoring and cameras mounted on construction machinery. The video data recorded the construction scenes, camera settings, and environmental conditions at the time of recording. The 3D terrain data class stores daily progress using point-cloud data and serves as the basis for visualizing site conditions. The Weather Information class records weather data obtained from rain gauges installed on-site and meteorological information from the Japan Meteorological Agency. Considering the need to reference weather forecasts and monitor temperature and humidity, the acquisition frequency was set on an hourly basis. The Construction Machinery class stores log data collected from sensors mounted on ICT construction machinery during operation. Each machine was assigned a unique identifier to track its status and rental period. The Construction Worker class stores the records of worker activities and movement histories, with each worker assigned a unique identifier. Using smartwatches worn by workers, movement histories and heart rate data were recorded at one-second intervals from the start to the end of the recording period.
The scope of the class diagram in Fig. 4 is limited to data acquired at construction sites, such as point-cloud data, photographs, videos, weather information, and sensing logs. Design models and construction plans such as BIM, CIM, and IFC models, component attributes, and planned schedules are not represented in the diagram because they are typically created and managed outside the on-site acquisition workflow. Instead, these models are linked to the proposed system through external references such as coordinate systems, work area identifiers, and temporal metadata. Integration with external models enables the interpretation of point-cloud differences in terms of planned versus actual conditions.
4. Proposal of Use Cases
In the construction site digital twin, point-cloud data serve as the primary basis for visualizing the construction progress by superimposing datasets acquired at different times. Absolute coordinates were assigned to the point-cloud data, and other sensing data were overlaid within this spatial framework. This study focuses on three typical use cases of construction supervision: process management, quality management, and safety management, where point-cloud, vital-sensing, and video data are utilized to understand the on-site conditions (Fig. 5).
4.1. Process Management
Daily point-cloud data of the site terrain were acquired using TLS, UAVs, or high-elevation cameras (Fig. 5(a)). By superimposing these datasets on previously acquired point-cloud data, the daily construction progress can be monitored. Accumulated daily records enable periodic reviews, allowing corrective actions to be taken during construction rather than after the discovery defects. In addition, milestone-setting methods are often unclear in partial payment systems based on work progress. Daily acquisition of 3D terrain data enables comparison between the actual site conditions and before and after construction data represented by the as-designed terrain surfaces and the as-built terrain obtained immediately after major construction milestones. These datasets were unified into a common absolute coordinate system using ground control points, enabling direct comparison with daily point-cloud data acquired on-site. Temporary objects, such as vehicles, stockpiles, scaffolding, and vegetation, were manually removed prior to differencing to ensure that only terrain-related changes were evaluated. To quantify the progress, point-cloud differencing was performed using the compute cloud/cloud distance function in the CloudCompare software. The vertical point-to-point distance (\(z\)-direction) between two epochs was calculated to visualize positive (embankment or filling) and negative changes (cutting or excavation). A blue-white-red color gradient was applied, where blue indicates a decrease in elevation, white indicates no change, and red indicates an increase in elevation. The color range can be adjusted depending on the level of detail required for each construction activity. This workflow enables daily quantification of cut-and-fill volumes and supports a comparison between the planned and actual progress throughout the construction period.
4.2. Quality Management
When construction defects or deficiencies occur, the data accumulated within the construction site digital twin can be used to reconstruct the conditions at the time of the incident and identify the cause of the error. Time-synchronized video data provided multiple viewpoints of the site, enabling remote inspection and verification of construction procedures (Fig. 5(b)). By integrating video data with point-cloud data, supervisors can review past site conditions, confirm the sequence of operations, and assess whether construction activities are performed according to specifications.
4.3. Safety Management
Smart devices are used to quantitatively evaluate changes in workers’ physical conditions based on vital sensing data. In this study, smartwatches were used to collect worker-related information, including GNSS-based movement histories and heart rate variations. By analyzing the positional relationship between the construction machinery and workers, situations with a high risk of collision can be identified, supporting accident prevention (Fig. 5(c)). Furthermore, visualizing heart rate data within a 3D spatial context allows supervisors to assess worker workload and physical strain, contributing to improved safety management and early detection of abnormal conditions. In this study, both the worker’s position data and heart rate data were collected from a single worker using a smartwatch, and the recorded data were visualized to evaluate the feasibility. However, the integration of biometric and positional data with point-cloud data beyond this single-worker example has not been implemented. This use case is intended as a conceptual demonstration for future work.
5. Design of Construction Information System
5.1. System Architecture
This paper proposes a construction information system designed to support the digital twin-oriented management of data generated on construction sites and enable its use in the proposed use cases. The overall system architecture, which is based on point-cloud data, is shown in Fig. 6. Site conditions and structural changes were captured using TLS and UAVs, whereas the behavior of construction machinery and workers was recorded using cameras and wearable devices. Data were provided to users through the data model defined in Section 2 and a common interface.
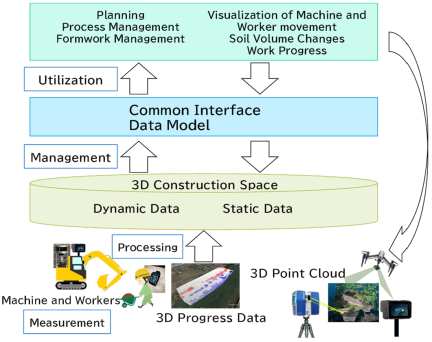
Fig. 6. Concept of construction information system 8,9.
The common interface defines the data exchange protocol between the system and database and standardizes the required data fields for transmission. Examples of system outputs include visualizing the differences between point-cloud datasets to assess progress, and visualizing the movement of machinery and workers. These outputs can be fed back to the site to support revision of construction activities and corrective actions.
In this study, to enhance the reproducibility of the proposed system, we proposed data formats and metadata items for use in the workflow. Point-cloud data acquired from UAV photogrammetry and TLS were stored in LAS or LAZ formats, whereas video data obtained from fixed cameras and wearable devices were stored in MP4 format. Time-synchronized metadata were managed in the CSV or JSON format. We considered it desirable for these datasets to include metadata such as timestamps, coordinate system identifiers, work-area IDs, sensor IDs, and acquisition conditions. A common interface was designed to accommodate these metadata items through an appropriate schema, allowing consistent storage and retrieval across different sensing devices. Regarding the flow of data, we also examined an end-to-end workflow consisting of (1) acquisition of point-cloud data, videos, and sensing logs; (2) preprocessing, such as coordinate assignment and noise filtering; (3) storage in a database that manages both high-resolution and lightweight datasets; and (4) visualization, time series queries, difference computation, and overlay of sensing data on the unified platform.
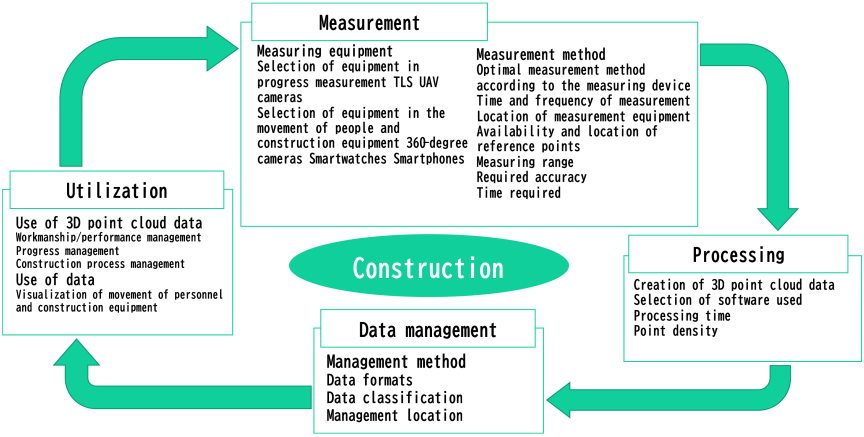
Fig. 7. Information cycle during and after construction 8,9.
5.2. Information System Framework
An information system is generally defined as a mechanism for collecting, processing, transmitting, and utilizing information necessary for social or organizational activities 27. The construction information system proposed in this study was examined based on this definition. The system performs four processes: measurement, processing, management, and utilization, across the stages of pre-construction, during and after construction, and maintenance. This cycle is repeated as the construction and maintenance activities progress, allowing for the accumulation of information over time. When transitioning between the stages, the required information was identified and transferred. The data obtained during the maintenance stage can be used as part of the as-built drawings or construction plans for future repair work.
5.3. Use Case of the System
Figure 7 summarizes the items to be considered during the measurement, processing, management, and utilization of the construction and post-construction stages.
-
(1)
Measurement: Measurement ranges and equipment installation positions were determined according to the measurement target to ensure that the required accuracy specified in the guidelines for shape management, inspection, and progress calculations was satisfied. The presence and placement of control points as well as the measurement timing and frequency were also defined.
-
(2)
Processing: Point-cloud data acquired from multiple TLS positions were merged, and point-cloud data were generated from videos and photographs when applicable. The software was selected according to the measurement devices used, and the point-cloud density was considered.
-
(3)
Management: Information is transferred from construction to maintenance in accordance with the class diagram of construction information. The data formats, classifications, and storage locations were defined to ensure long-term usability.
-
(4)
Utilization: Constructed point-cloud data and visualized soil volume data were used for daily progress monitoring, process management, and shape management. Soil volume changes can be visualized by comparing point-cloud datasets acquired at different times, and the movement of workers and machinery can be visualized by integrating point-cloud data with GNSS information. During the maintenance stage, the point-cloud data of the completed structure were used to visualize the damage and support periodic inspections.
Table 1. Accuracy assessment by comparison of photogrammetric results with TLS point-cloud data 8,9.

6. Implementation in Large-Scale and Small- to Medium-Scale Construction Sites
6.1. Implementation in Small- to Medium-Scale Construction Sites
6.1.1. Overview
This section verifies the measurement, processing, management, and utilization cycle of the proposed construction information system at an actual construction site and clarifies the considerations required for constructing a construction site digital twin. A small- to medium-scale construction site was selected, and measurements were conducted before and after modifying the embankment shape. When access to the site was restricted, an UAV (Inspire 2) was used for aerial photogrammetry. In areas with UAV flight restrictions or narrow spaces, a high-elevation camera mounted on a monopod is used for ground-based photogrammetry. Point-cloud data were generated from photographs using structure from motion and multi-view stereo (SfM/MVS). In aerial photogrammetry, the measurement devices and flight altitudes are varied, and the measurement time, point-cloud generation time, and data accuracy are compared using the TLS-derived point-cloud data as the reference.
The small- to medium-scale construction site used in this study was an earthwork site with an approximate area of 1 ha. This site included areas with vegetation and narrow working spaces. Daily data acquisition was conducted using a camera-equipped UAV and TLS. Ground control points installed by the authors were used for coordinate alignment. Static data, such as control point measurements, were retained throughout the observation period. The stored sensor logs and video data amounted to several tens of gigabytes, and the total volume of the point-cloud data was approximately 0.5–1.5 TB. To clearly distinguish the scope of the field experiment from its long-term operational use, we state that the above values represent only the measured data obtained during the observation period in which daily acquisition was conducted for the experiment. Because long-term data accumulation varies substantially depending on acquisition frequency, retention policy, and project duration, this study did not provide numerical estimates for long-term storage requirements. Instead, the discussion focuses on the operational considerations derived from the measured data collected in the field experiment.
The accuracy thresholds of \(\pm 200\) mm for UAV point-cloud data and \(\pm 100\) mm for TLS point-cloud data were adopted with reference to the accuracy ranges commonly used in public construction projects in Japan, where UAV-based measurements are typically required to achieve an accuracy of approximately \(\pm 200\) mm and TLS-based measurements approximately \(\pm 100\) mm. These levels of accuracy are sufficient for the purpose of this study, which focused on monitoring daily progress. The thresholds allow the stable detection of cut-and-fill trends and volumetric changes while considering the practical limitations of on-site data acquisition.
6.1.2. Site Measurement
To evaluate the accuracy of photogrammetry using UAV-mounted and high-elevation cameras, the point-cloud data generated from each method were compared with the TLS point-cloud data. Table 1 summarizes the percentage of points falling within the required accuracy of \(\pm 200\) mm, as well as measurement time, processing time, and data size.
The results indicated that both UAV-based and high-elevation camera-based photogrammetry can achieve sufficient accuracy for daily progress monitoring. UAV measurements at lower altitudes produced denser point clouds but required longer processing times. In contrast, higher-altitude UAV flights reduce processing time and data size while maintaining acceptable accuracy. Ground-based photogrammetry using a high-elevation camera achieves high accuracy in narrow or restricted areas where UAV flights are not feasible.
These findings demonstrate that measurement methods must be selected according to site conditions, available space, and required accuracy. The flexibility of combining UAV and ground-based photogrammetry contributes to efficient data acquisition at small- to medium-scale construction sites.
6.1.3. Data Processing
The point-cloud data obtained from the TLS were registered and merged using the data processing software FARO SCENE to generate a unified point cloud representing the most reliable geometry of the entire site. During the registration process, the spheres commonly observed across multiple scans were designated as identical reference points.
For the UAV photogrammetry, a predefined capture plan was used to ensure reproducibility. The flight route followed a lawn-mower pattern covering the entire work area, with an actual forward overlap of approximately 80% and a sidelap of approximately 60%. The flight altitude was set to 20–30 m above the ground level, and the flight speed was maintained at 2–3 m/s. The SfM/MVS processing was performed using Agisoft Metashape. Image alignment was conducted with the “Medium” accuracy setting. Dense-cloud generation used the “High” quality setting with mild depth-map filtering. When video-based photogrammetry is used, the generated point cloud is initially placed in a relative coordinate system. Therefore, the six control points selected from the images were assigned absolute coordinates measured by total station (TS) surveying, enabling the construction of a 3D point cloud in an absolute coordinate system suitable for real-world measurements. The number of images directly affects both the acquisition and processing times, and the flight altitude was adjusted to reduce the number of required images.
For validation, the TLS-derived and photogrammetric point clouds were aligned using the point-cloud data processing software CloudCompare, and the differences between the two datasets were computed.
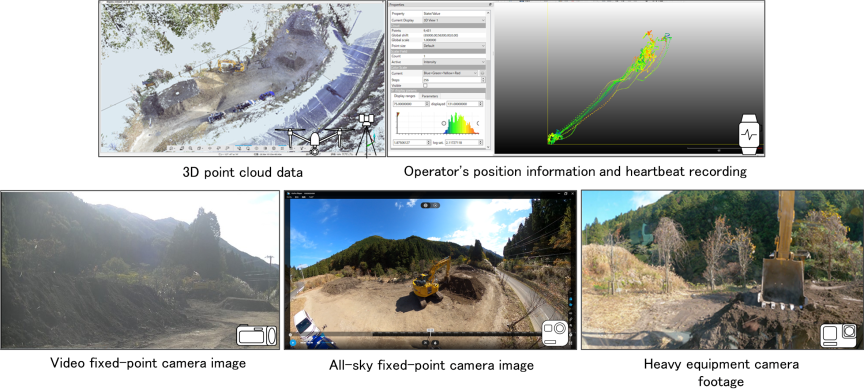
Fig. 8. Acquired data in construction project.
6.1.4. Data Management
The processed data were classified according to a class diagram, and an object diagram was created. The point-cloud data were categorized as 3D terrain data within the construction record class. Pre-construction point-cloud data were labeled as pre-construction terrain data, and post-construction data were labeled as progress terrain data. The acquisition time, measurement location, and construction activities were recorded for each dataset.
Figure 8 presents a list of the acquired data. The total data volume was approximately 50.8 GB of point-cloud data and 68.5 GB of video data. As the data volume becomes enormous when construction information is acquired daily, it is necessary to consider data sharing among construction participants and the use of lightweight mesh data. The total volume of the point clouds and video data collected during the observation period was approximately 120 GB, representing the actual measured data handled in this study. When daily acquisition is performed, data volumes increase rapidly even over short periods, making it necessary to distinguish between short- and long-term retention policies. In this study, raw point-cloud data were retained for short-term verification, whereas weekly downsampled datasets were used as long-term records. Because long-term accumulation depends on the acquisition frequency and retention strategy, this study does not provide numerical estimates but instead discusses data management considerations based on the measured values.
In this study, daily point-cloud data were accumulated on the proposed platform, and daily differencing was performed to visualize changes in terrain and construction activities. These daily updates enabled the supervisors to review progress trends and confirm whether the work proceeded as expected. However, the daily digital twin functions implemented in this study were limited to daily data acquisition, accumulation, and visualization. More advanced daily digital twin capabilities such as automated anomaly detection, automated quantity estimation, and predictive analytics have not yet been implemented. These functions remain important topics for future work and are necessary to achieve a fully operational day-by-day digital twin.
6.1.5. Data Utilization
To quantitatively assess daily construction progress, the required accuracy in this study was set to \(\pm 200\) mm in horizontal and vertical differences, referencing the Ministry of Land, Infrastructure, Transport and Tourism’s guidelines for progress calculation, with TLS point-cloud data used as the reference. Table 1 lists the accuracies of the evaluation results. In all four photogrammetry cases of UAV and high-elevation camera, more than 92% of the point-cloud data satisfied the \(\pm 200\) mm requirement. Points that did not meet the accuracy requirements were affected by vegetation noise, missing data, and photogrammetric errors. Therefore, unnecessary data must be removed, and the number and placement of control points must be adjusted. To evaluate the construction progress, point-cloud differencing was performed between the pre- and post-construction datasets. CloudCompare’s cloud-to-cloud distance function was used by applying a nearest-neighbor search strategy to identify the corresponding points and compute the distances along the normal direction of the reference surface. Before differencing, manual masking was used to remove vegetation and temporary objects. Regions with low or insufficient point densities were excluded from analysis. For interpretation, regions corresponding to construction work areas were selected, and positive and negative distances were classified as embankment and excavation changes, respectively. Temporary objects such as vehicles, material stockpiles, and scaffolding were excluded to avoid misclassification. This study did not directly integrate the BIM/CIM models.
To visualize the construction progress, the computed height differences are displayed using color mapping. In Fig. 9, positive height changes (post \(>\) pre) are shown in red, negative changes are shown in blue, and no change is shown in white. Larger changes appear as darker colors, whereas smaller changes appear lighter. By performing 3D measurements at each progress stage, this method can be effectively used for progress management.
For validation, the volume changes derived from point-cloud differencing were compared with independent measurements obtained from TS surveys and cross-sectional as-built records. The results showed consistent trends, suggesting the reliability of the progress evaluation based on point-cloud differencing.
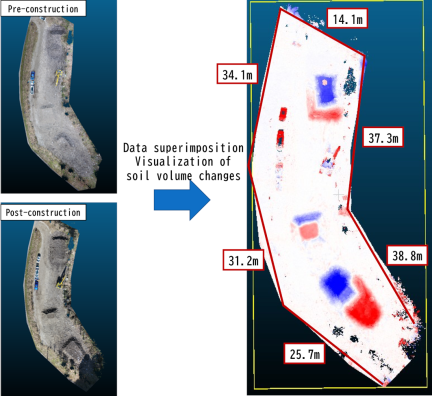
Fig. 9. Visualization of construction progress 8,9.
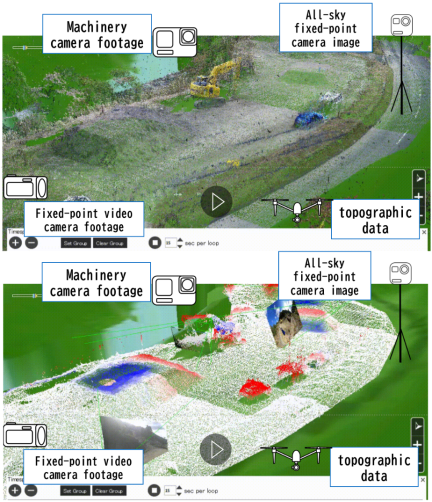
Fig. 10. Grasping the state of construction.
Figure 10 shows the interface in which the videos captured from the machinery-mounted camera and fixed-position camera during the embankment construction work are displayed at their respective camera locations. In daily operations, site supervisors accessed the integrated dataset through a system interface, as shown in Fig. 10, which allowed switching between work areas, browsing daily point-cloud data, and checking the associated video logs. Access permissions were conceptually managed by assigning viewing or editing rights to each contractor, assuming an operational workflow in which authorized personnel would upload or modify data. A video from the machinery-mounted camera was displayed at the position recorded at the start of the measurement. By specifying the camera position, orientation, and height, the video can be played back to understand the spatial relationship between workers and machinery as well as the overall site conditions. For video integration, both the camera pose and time synchronization were manually determined. The position and height of each camera were measured on-site and manually entered into the system. The camera orientation was adjusted by visually matching the field of view of the video with the background point-cloud data. The resulting pose accuracy was within several tens of centimeters, which is sufficient for qualitative spatial interpretation. Time synchronization was also performed manually. The timestamps of the video frames were compared with those of the point-cloud data and the nearest corresponding frames were matched. For the fixed-position camera, the internal system clock was used, resulting in a synchronization tolerance of approximately \(\pm 1\)–2 seconds. Missing frames are handled by interpolating the nearest available timestamps. Because both pose estimation and synchronization involve manual adjustment, the integrated video is intended for qualitative visualization of the spatial relationships among workers, machinery, and site conditions rather than for precise geometric measurement.
6.2. Implementation in Large-Scale Construction Sites
6.2.1. Overview
In this study, unified management is defined as the integration and visualization of measurement data from various construction activities such as road relocation, bridge construction, dam construction, and earthwork on a single data platform. The TLS measurements were conducted daily, with three to five measurement campaigns per year, and continued over a period of four years. Public control points supplemented with temporary markers are used to establish the coordinate system. The statistical data were retained throughout the observation period. The stored sensor logs and video data amounted to several tens of gigabytes, and the total point-cloud volume increased substantially during the actual period. In this study, the data volumes represent the datasets collected through intermittent measurements conducted over a four-year project period. These datasets consist of several terabytes of TLS, UAV, and high-elevation camera data obtained during several measurement sessions each year. Because long-term accumulation varies depending on whether daily or periodic acquisition is adopted, this study did not provide numerical estimates for continuous operation. Instead, we discuss operational considerations based on the data obtained from these actual measurement sessions. This section describes the process of merging point-cloud data acquired and constructed using different measurement devices, and assigning coordinates to the merged datasets. The accuracy of point-cloud data generated for large-scale structures and bridges is evaluated using a required accuracy of \(\pm 100\) mm. Depending on the site conditions, TLS, UAV-mounted cameras, and high-elevation cameras are used. The high-elevation consisted of a GoPro Hero 10 mounted on a 4 m monopod, and videos were recorded at 4K at 60 fps.
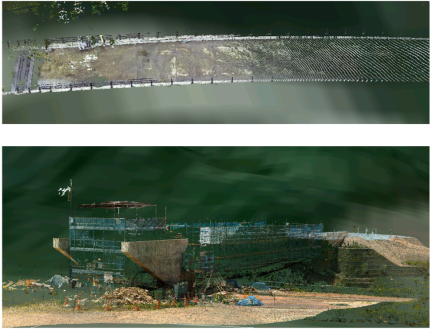
Fig. 11. Point-cloud data of bridge using TLS.
6.2.2. Measurement and Construction of Point-Cloud Data
Figure 11 shows the point-cloud data of the bridge pavement and piers measured using TLS. When measuring the pavement surface using TLS, the instrument spacing was set to 20 m, considering the outdoor environment and limited number of obstacles. However, automatic registration using a software is challenging. This is likely because the area around the target structure was monotonous with many similar views, resulting in a few distinctive surfaces or feature points.
For high-elevation camera surveying, preliminary experiments were conducted to determine the appropriate monopod height, walking route, and image quality settings prior to field measurements. When the target object, such as a pavement surface, was clearly defined, the measurement height was set to 4 m. If the pavement width exceeded the camera’s field of the camera by 4 m, the height was increased to ensure full coverage. Fig. 12 shows the measurement setup. The three walking routes were along the centerline, a round trip along both edges, and a zigzag path. The results confirmed that walking along the centerline produced point-cloud data with the highest point density on the pavement surface (Fig. 12).
When merging point-cloud data obtained from different measurement devices, the coverage and point density of each dataset differ, making feature-point selection difficult. At least three common feature points such as structural edges must be selected for registration. By merging the TLS-based point-cloud data of the bridge pier (Fig. 11) with the high-elevation camera-based point cloud of the bridge deck (Fig. 12), the resulting root mean square was 45 mm. This satisfies the required accuracy of 100 mm and falls within the \(\pm 200\) mm horizontal and vertical tolerance. The primary source of error was the limited number of common feature points because the alignment relied only on one abutment at the end of the bridge. The TLS-based point-cloud data were treated as a reference, and the accuracy of the high-elevation camera-based data was evaluated. The two-point cloud data were superimposed, and the nearest neighbor points were extracted in the \(x\)-, \(y\)-, and \(z\)-directions, as well as in 3D space, to compute point-to-point distances. Under the tested conditions and within the limited evaluation area, approximately 99% of the evaluated points satisfied the \(\pm 100\) mm threshold when compared with the TLS-based reference data. These results indicate that the required accuracy was achieved for this specific case, although the values should be interpreted as indicative rather than generalizable.
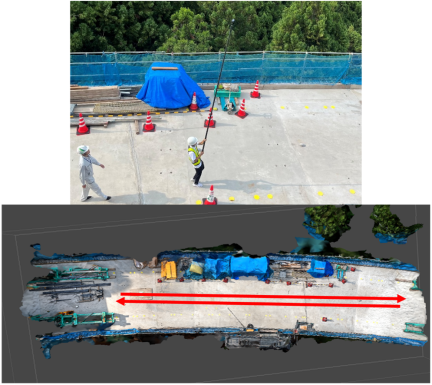
Fig. 12. Measurement and field of view using a high-elevation camera.
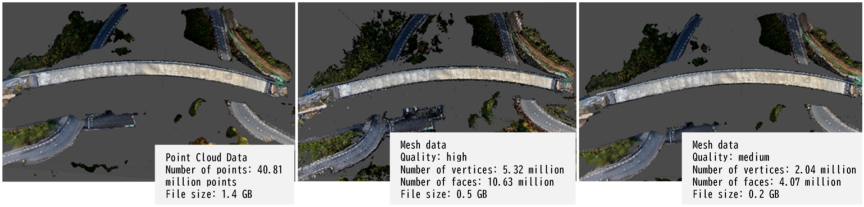
Fig. 13. Comparison with point-cloud data and mesh data 10.
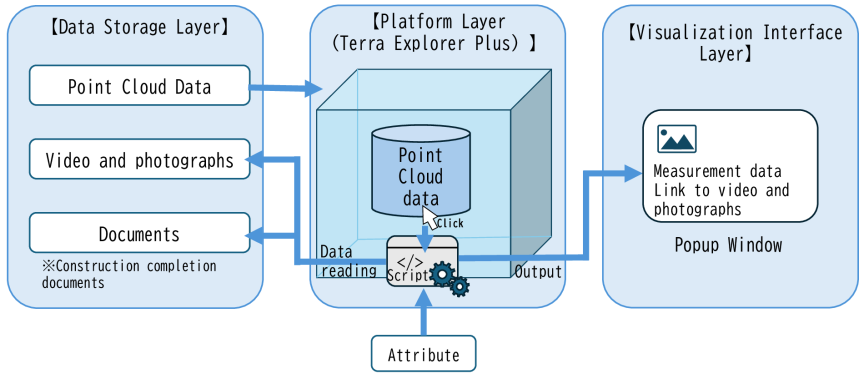
Fig. 14. Conceptual diagram for visualization of point-cloud and other data.
6.2.3. Volume of Data Handled
This study targets large-scale construction sites where structures are extensive and must be measured repeatedly as construction progresses. As a result, the volume of point-cloud data becomes extremely large. During earthwork operations, the terrain changes daily. In bridge and pavement construction, completed components, such as bridge piers or paved surfaces, do not change shape but are simply extended. Consequently, the daily geometric change was considerably smaller than that in the earthwork. Based on this difference, we determined the appropriate measurement frequency for each type of structure. For earthwork, we propose weekly measurements, whereas for bridges and pavements where daily geometric changes are minimal monthly measurements or measurements triggered by visible progress are recommended. Setting appropriate measurement intervals can reduce the total number of measurements required. It should also be noted that when the objective is to monitor construction progress, simply capturing geometric changes is insufficient for understanding the overall progress status. To clarify the characteristics of data volumes at large-scale construction sites, this study reports only the measured values obtained during the observation period. The accumulated datasets consist of several terabytes of TLS and UAV data collected through intermittent measurement sessions conducted at multiple points during the four-year project period. Because large-scale sites require repeated measurements over wide areas, the measured data volumes were substantially larger than those observed at small- to medium-scale sites. As long-term accumulation depends on acquisition frequency, measurement scope, and retention policy, this study does not provide numerical estimates and instead focuses on management considerations derived from the measured datasets.
Raw point-cloud data, videos, and sensor logs were stored daily on a local computer. On a weekly basis, point-cloud data are consolidated into a single dataset, and redundant video segments are trimmed. Monthly archives are transferred to a cloud server or an on-premise NAS for long-term storage. At project completion, only representative datasets such as before/after construction point-cloud data, weekly consolidated data, and incident-related videos were retained.
To reduce the data volume, the use of mesh data has been proposed. By converting the point-cloud data of the bridge constructed into mesh data, we confirmed that the data size could be reduced by approximately 65%–85%. Fig. 13 shows the generated mesh data along with the point-cloud data. However, mesh data are less accurate than point-cloud data. Therefore, we consider it effective to use point-cloud data for up-to-date information and progress visualization, while storing past construction records as mesh data to reduce overall data volume. Video data were encoded using H.265/HEVC, achieving a 40%–50% reduction compared with H.264, while maintaining sufficient visual quality for construction review. The GNSS and biometric data are stored as lightweight CSV logs, typically less than 1 MB per day. These formats were selected to ensure compatibility with existing construction industry software and to support long-term archiving.
6.2.4. Visualization of Construction Progress
This section proposes a system architecture and visualization framework for managing and integrating multi-source data. The system is designed such that point-cloud data acquired at construction sites serve as the entry point for browsing and exploration, enabling users to access related images, videos, documents, and acquisition condition information. Fig. 14 shows a conceptual diagram of the visualization of the point cloud and other data. To achieve this integration, the system architecture was organized into three layers: data storage, integration platform, and visualization interface. The data storage layer stores and manages the various types of data acquired at construction sites as files. In this study, the point clouds and image/video data were stored in an external storage repository. Based on the acquisition and management items defined in the previous section, this layer preserves the original data without deletion or modification, allowing for future extension and reuse. The data storage layer does not directly manage the attribute information; its role is limited to storing raw data files. Attribute information such as measurement date and weather conditions was logically assigned and managed in the integration platform layer. The integration platform layer links the data stored in the data storage layer and integrates them into a digital twin of the construction space. In this study, the 3D GIS software Terra Explorer Plus was used to place and visualize the 3D point-cloud data. Attribute information, such as the measurement date, sensing device, and weather conditions, was assigned to the point-cloud data using scripting functions. Heterogeneous data such as images, videos, and documents are registered as references to external files, allowing users to access them starting from point-cloud data. The visualization interface layer presents the information defined in the integration platform layer to the user. In this study, the attribute information associated with the construction space was linked to the point-cloud data and visualized dynamically according to user interaction. Specifically, the measurement conditions, weather information, related images, videos, and documents were defined as attribute information, and only the necessary information was displayed in a pop-up window when a point-cloud object was selected. This enables users to understand the acquisition conditions and related data from any location in a construction space intuitively.
Two methods are considered for visualizing the construction progress: (1) managing point-cloud data acquired at different times along a time axis to visualize changes in shape, and (2) performing differential analysis on superimposed point-cloud datasets to quantitatively visualize progress differences. To manage the point-cloud data along a time axis, the coordinates obtained during measurement are first assigned to the LAS-format point-cloud data acquired at different times, and the datasets are displayed on a 3D map. Next, the start and end times were assigned to each dataset using a time-setting function, and the time axis was manipulated to visualize the changes in shape. An example of the progress visualization is shown in Fig. 15. In this study, point-cloud data were constructed by assigning position coordinates obtained using GNSS. To accommodate the characteristics of the construction site, several approaches have been employed: changing the camera orientation during measurement, modifying the walking route owing to limited measurement time, using different measurement devices depending on the structure, and acquiring position coordinates using GNSS. In situations where construction is progressing and distinctive features or control points are no longer available, the GNSS allows position coordinates to be obtained at any location using a base station and a rover. The acquired coordinates are then assigned to the generated point-cloud data, resulting in a georeferenced point-cloud dataset. The registration error of the point-cloud data was within the required accuracy of 100 mm. Such an error is considered to have a minimal impact on progress visualization at large-scale construction sites. In the proposed approach, the progress across different structures within a large-scale construction project is visualized on a unified time axis. If the positional deviations remain within the required accuracy, construction managers can reliably track the progression of their work over time.
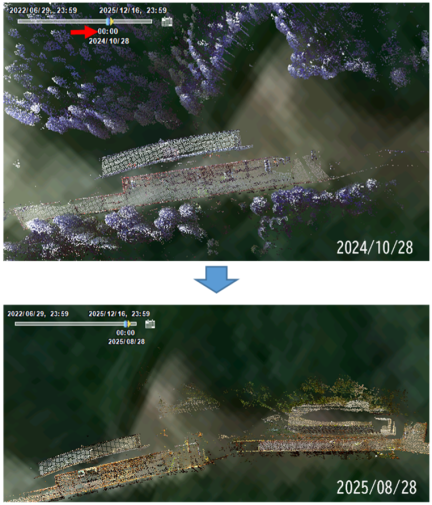
Fig. 15. Temporal navigation using a time slider.
For quantitative visualization through differential analysis, point-to-point distances in the \(z\)-axis direction were calculated between the superimposed point-cloud datasets, similar to the method used for small- to medium-scale sites. Both positive height changes (e.g., embankment construction) and negative height changes (e.g., excavation) are represented.
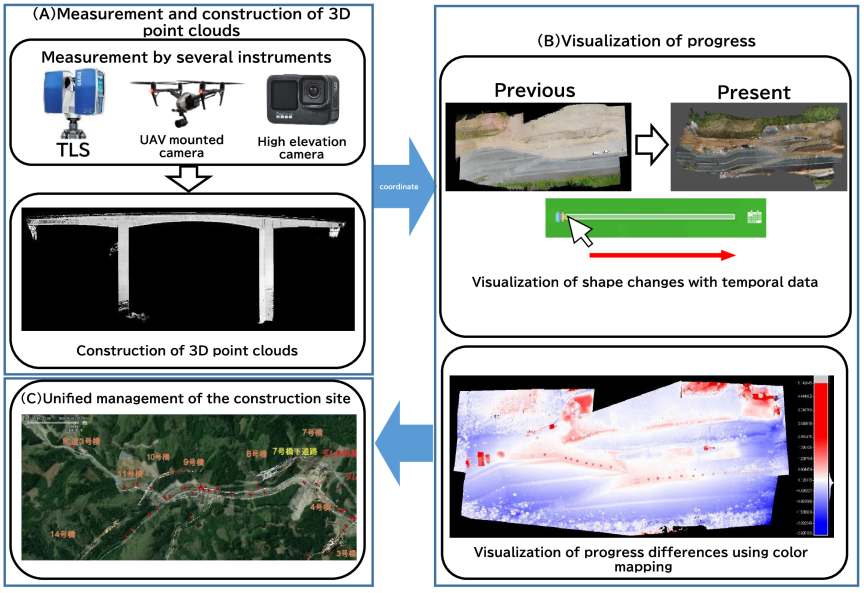
Fig. 16. Unified management in the construction site.
6.2.5. Unified Management of Point-Cloud Data
In large-scale construction projects, the progress of a work area often depends on the status of the other areas. For example, bridge construction may proceed only after road relocation has sufficiently advanced. However, progress information is typically managed independently within each work area, and site managers and contractors cannot easily understand the overall situation. Consequently, progress confirmation requires considerable time, delays subsequent tasks, and reduces operational efficiency. Unified progress sharing across work areas is essential to address this issue.
Figure 16 illustrates the unified management workflow implemented in this study. The inputs to the system included multi-source point-cloud data obtained from TLS, UAV photogrammetry, and cameras, along with absolute coordinates measured by TS/GNSS and timestamps recorded during data acquisition. Each dataset was associated with a work-area identifier and measurement date. In Step A, point-cloud data were generated for each work area using sensing methods appropriate to the site characteristics, such as road relocation, bridge construction, and earthwork. In Step B, the point-cloud data are assigned absolute coordinates and organized along the time axis. The point-cloud data acquired at different times were superimposed, and a differential analysis was performed to quantify the changes. Positive height differences (post \(>\) pre) are shown in red, negative differences are shown in blue, and unchanged areas are shown in white. Work area IDs were assigned to different regions to enable an area-based progress evaluation. In Step C, the point-cloud data from all work areas are displayed together on a single data platform, enabling unified management of the entire construction site. Workflow outputs included daily volume changes, color-mapped progress visualizations, and work area-based progress indicators. In the observed cases, the time required for progress confirmation was reduced from approximately one working day to several hours when using the proposed unified workflow based on informal comparisons with the conventional TLS-based procedure. This reduction reflects specific site conditions and should be regarded as an indicative trend.
Compared with BIM/CIM-based practices and spatial-ID-based digital twin platforms, the point-cloud-centered approach excels in capturing actual site conditions without requiring prior modeling, and is particularly effective for large-scale earthwork and non-structural environments. However, they have limitations in terms of semantic representation, data searchability, and governance, as BIM/CIM platforms provide stronger support. Although semantic attributes were not assigned in this study, the proposed workflow was compatible with spatial ID-based management.
6.3. Discussion
6.3.1. Feasibility of the Use Cases
The feasibility of process management was demonstrated by superimposing daily point-cloud data to visualize construction progress. Point-cloud data acquired by the UAV before construction with assigned absolute coordinates were used as the reference, and the post-construction data were overlaid in CloudCompare. Point-to-point distances between the pre- and post-construction datasets were calculated, and the progress was visualized using color mapping. Furthermore, the embankment volume was computed using the TS and cross-sectional coordinates extracted from the point-cloud data. By selecting and enclosing cross-sectional change points between the embankment and ground surface, the soil volume can be estimated, enabling an approximate calculation of the required soil transport.
For progress monitoring, point-cloud data do not necessarily require absolute coordinates; if the scale is consistent, progress can be quantified through volumetric calculations.
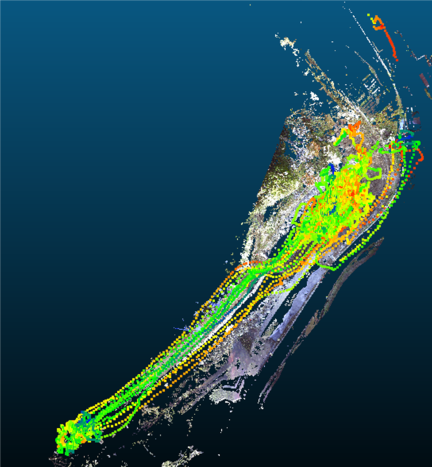
Fig. 17. Visualization of worker position and heart-rate data on point cloud (single-worker feasibility example).
For quality management, time synchronization of the video data was performed to reproduce site conditions. This enabled the verification of past site conditions from multiple viewpoints. Establishing a simplified method for synchronizing multiple videos, as well as methods for synchronizing and visualizing heterogeneous data formats such as video and point-cloud data, remains an important issue. When construction defects occur, the recorded data can be traced back to the relevant period. The construction date of the target location can be identified using daily point-cloud records, and the corresponding video or photographic records can be referenced to determine the cause.
For safety management, point-cloud data representing a single worker’s position and the corresponding heart rate data were collected and visualized by superimposing them onto the base point-cloud data (Fig. 17). Variations in a worker’s physiological condition can be visually examined by changing the point colors according to the recorded heart rate values. This single worker example was implemented to evaluate feasibility, whereas broader integration of biometric information for multiple workers was presented as a conceptual use case and was not implemented in this study.
In this study, heart rate data were used as non-medical, operational indicators to visualize changes in physiological conditions by integrating them with point-cloud data. The objective was not to establish medically validated thresholds or perform a health risk assessment. Instead, the proposed method serves as a supplementary cue to highlight deviations from a worker’s physiological state, supporting situational awareness rather than a medical diagnosis. For practical deployment in safety management, explicit thresholds for heart rate-based risk evaluations are required. Such thresholds must consider individual variability, environmental conditions, and task-specific workload, and would necessitate additional data collection across multiple sites as well as collaboration with occupational health experts. These aspects are beyond the scope of this study and are identified as important directions for future research aimed at developing more robust and generalizable safety indicators.
Although point-cloud data serve as daily records of construction progress, numerical or color-based representations of differences are essential for a 3D understanding of the progress. Vital data can be visualized as point-cloud data, and display methods can be adapted for specific purposes. However, challenges remain in setting thresholds for detecting workload or physical condition changes and in managing the time axis to display worker positions in real time.
Video data are useful for recording site conditions; however, effective methods for reviewing and displaying such data are required. This study acquired heterogeneous data formats for point clouds, vitals, and video data. To construct a digital twin, a method for reviewing different file formats within a single software environment must be established. In addition, real-time visualization of camera positions on point-cloud data is required to reproduce site conditions in detail within a digital environment.
In construction management, daily 3D terrain datasets are employed to quantify short-interval progress. However, the labor demands associated with terrestrial laser scanning and comparable measurement instruments currently constrain the practical frequency of data acquisition. Systematic daily recording enables accurate representation of site conditions within the digital environment and facilitates post-construction comparison between planned and actual schedules, thereby supporting the data-driven refinement of future construction planning. Because these records are accumulated throughout the execution phase, periodic verification allows for early identification and correction of potential construction deficiencies prior to project completion. Moreover, although milestone definition for progress-based partial payments remains insufficiently standardized, daily 3D terrain acquisition enables direct comparison between the as-built state of each construction day and the design-intended completion geometry, thereby supporting higher-frequency and more objective computation of earned progress.
In this study, the data were acquired according to the definitions shown in Fig. 4. Future work will include developing a system for storing and managing diverse acquired, processed, and visualized data in a database, in accordance with class diagrams. Large-scale construction projects can span several years, resulting in substantial data volumes. Therefore, a practical approach is to share images and weekly point-cloud data online among stakeholders, whereas daily data are stored in the site office, with metadata indicating their location and a summary accessible to stakeholders.
6.3.2. Visualization of Progress
Visualization of progress enables workers and managers to understand the construction progress and the time elapsed since its commencement. In this study, daily point-cloud data were superimposed to visualize changes in terrain and construction activities. Because point-cloud data were acquired from different positions and times, manual alignment was required to overlay them. This process requires operator judgment and alignment errors may occur. Manual alignment of point-cloud data remains a significant operational constraint in the current workflow. In this study, all the alignment tasks were performed manually by a single operator, typically requiring several minutes per dataset under the tested conditions. As the procedure was conducted by only one operator, operator-to-operator variability and skill dependency were not evaluated, and the reported workload should not be interpreted as generalizable. Although the aligned datasets exhibited visual consistency, no quantitative analysis was conducted to assess how the alignment errors propagated to point-cloud differentiation or volume estimation. Misalignment may lead to a local over- or underestimation of the differencing results, representing an important limitation of the current workflow. For applications requiring higher precision as-built verification or quantity surveying, the quantitative evaluation of alignment error propagation and the introduction of automated registration techniques are necessary. Furthermore, this study did not perform a quantitative comparison of the workload or efficiency relative to conventional progress confirmation practices. Therefore, the operational benefits observed in the field tests should be regarded as preliminary observations. A systematic evaluation across multiple construction sites is required to rigorously assess the reproducibility and effectiveness of the proposed workflow.
At an altitude of 20 m for the UAV and 8 m for the fixed camera, 7.1% and 4.3% of the evaluated points, respectively, did not satisfy the required accuracy. This discrepancy is attributed to the noise and data voids generated during the photogrammetric reconstruction of the point-cloud data. Multiple walking passes around the measurement target and adjustments to the camera angle are necessary to avoid occlusions caused by structures and construction machinery. For earthwork volume evaluation, the cross-sectional coordinates derived from the point-cloud data obtained by UAV photogrammetry at a flight altitude of 30 m were compared with the TS measurements. Previous studies have reported that photogrammetric point-cloud data often exhibit geometric inaccuracies at cross-sectional change points. Consistent with these findings, errors were observed at the shoulder and toe of the embankment when compared to the TS measurements. These discrepancies are considered to have influenced the computed construction progress and earned volume, resulting in the volumetric estimates.
By integrating point-cloud data, synchronized videos, and worker movement locations, supervisors can remotely review site conditions without physically visiting each work area. The worker’s daily movement trajectory can be visualized by overlaying the worker position data onto the site’s point-cloud data. Continuous linear paths indicate frequently used routes, whereas areas with overlapping colors suggest locations where intensive work was performed, enabling the identification of the spatial distribution of daily work activities. From the perspective of quantifying workload, heart rate fluctuations do not necessarily correspond directly to physical work, making the definition of workload challenging. To provide feedback to workers using biometric data, the workload can be computed from two types of information: daily travel distance and heart rate measurements.
6.3.3. Unified Data Management in the Construction Site
In this study, the unified management of point-cloud data was defined as the ability to display measurement data from multiple construction sites on a single data platform, thereby enabling site managers and supervisors to understand progress across different work areas. We identified two essential functions required for such unified management: the visualization of point-cloud data with assigned coordinates and the management of data along a time axis. Although point-cloud conversion typically requires considerable time, effort, and specialized software, the measurement, data construction, and unified management methods proposed in this study can be applied without these conversion processes if equivalent functions become available in other software environments. Moreover, customizing these functions using open source GIS software can lead to a highly versatile system that does not rely on proprietary tools. A prototype system was developed based on discussions with construction managers at the field site. Practitioner-based evaluations are planned for future studies.
For effective unified management, it is important to minimize the time between data acquisition and information sharing among stakeholders. In our field implementation, measurements using the TLS, high-elevation cameras, and UAV-mounted cameras required 10 min per location, or approximately 30 min, including setup and teardown. The video data required several hours of processing to generate point-cloud data using SfM/MVS, and the point-cloud data obtained from different measurement devices had to be merged. All processing steps can be completed within a single day, allowing the processed data to be shared the following day, although further automation of SfM/MVS processing would improve operational efficiency.
The data were accessed and shared under real-world site conditions using a common interface, as shown in Fig. 6. Using a common interface, the metadata and file structures were standardized. Site managers can view weekly point-cloud data and compressed videos through a web-based viewer without downloading large raw files, whereas contractors responsible for specific work areas are granted access only to the datasets relevant to their tasks. This approach reduces network load and ensures appropriate data governance.
Measurement experiments revealed that the time required for data acquisition constitutes a major operational constraint. The cost comparison presented in this section is based on typical deployment conditions observed in the field tests. For UAV photogrammetry, the assumed costs include periodic flights conducted by trained operators and the associated data processing workloads. For TLS, the comparison reflects the expensive equipment cost and longer on-site setup time per scan. For high-elevation cameras, the analysis assumes mobile measurement with low equipment and daily operational costs but requires daily measurements at several sites, manual SfM/MVS operation, and limited measurement accuracy. TLS requires approximately 10–15 minutes per scan position. At the embankment construction site, 10–15 scan positions were required to cover the entire area. Consequently, the total acquisition time was approximately 100–255 minutes, indicating that daily progress measurements impose a substantial burden on site operations. By recording the daily progress as terrain data or videos, construction activities can be monitored daily or weekly. However, acquiring terrain data requires substantial time and effort, which increases the operational burden on site personnel. To enable high-frequency documentation of site conditions in accordance with progress while considering the time cost of data acquisition, this study proposes a method in which point-cloud data are generated from daily video recordings of the site terrain using SfM/MVS processing. For site condition recordings, a method that enables daily data acquisition with minimal effort is required. To address this need, this study proposes generating point-cloud data from helmet-mounted camera footage captured by on-site workers. Helmet-mounted cameras present two inherent limitations: (i) footage is not captured for the purpose of 3D reconstruction, which requires scenes in which the terrain is continuously visible, and (ii) camera motion is unstable. Based on these characteristics, the requirements for generating 3D point clouds from helmet-camera footage are defined as follows: (i) Requirements for scenes with continuously captured terrain: Because the footage is not recorded specifically for 3D reconstruction, segments in which the terrain is continuously visible must be extracted. By setting the camera to a 4K wide-angle mode and allowing workers to move throughout the construction site, the footage achieves high spatial coverage, allowing the selection of segments that satisfy the continuity requirement. Accordingly, scenes lacking continuity, such as those with abrupt changes in viewpoint or those recorded during equipment operation where the terrain was not visible, were excluded. (ii) Compensation for unstable camera motion: Because the camera is directly mounted on the worker’s helmet, it is constantly in motion due to walking, turning, and task execution, resulting in short visibility durations for any given location. To increase the overlap of SfM processing by ensuring multiple observations at the same location, the frame extraction interval was set to 0.5 seconds.
This study focused on short-term data acquisition; long-term daily data accumulation was not conducted. Based on the amount of data obtained during short-term operations, it is expected that continuous daily acquisition over an extended period will require more efficient data management strategies to handle the increasing data volume. Several data lighting approaches were considered, but the only method tested in this study was the mesh conversion of the point-cloud data. While meshing can substantially reduce data size, it may introduce geometric errors on the order of \(\pm 20\)–50 mm depending on the application. Such errors are acceptable for qualitative progress visualization but are not suitable for high-precision as-built verification. Other lightweight techniques such as LAZ compression, temporal subsampling, and region-selective management that preserve high-density data only in critical areas were examined, but were not implemented or tested in this study. The evaluation of the applicability and accuracy of these methods remains an important topic for future research.
For long-term operations, the governance of data sharing within a common data environment is essential, including access control, update responsibilities, and version management. Although some of these elements were tested on a trial basis, a comprehensive governance design for long-term deployment remains for future research.
7. Conclusion
This paper proposed a construction information system using point-cloud data to support the development of a construction site digital twin. Through applications in progress, quality, and safety management, the system demonstrated its potential to visualize progress, reproduce past site conditions, and assess worker safety under the tested conditions.
Field experiments at small- to medium-scale sites confirmed that photogrammetry-based point-cloud data can achieve practical accuracy for progress monitoring, whereas large-scale site experiments showed that the unified management of point-cloud data from multiple work areas is feasible using coordinate assignment and time-axis management. Challenges remain in synchronizing heterogeneous data formats, reducing the processing time, and establishing real-time visualization methods.
Several boundary conditions limit the applicability of the proposed method: the scale of the construction site, which affects the feasibility of daily 3D data acquisition and may require multi-session measurements and dataset merging for large structures; environmental factors such as weather, lighting, and GNSS signal obstruction, which influence data quality and georeferencing accuracy; and operational constraints such as time required for TLS measurements, data volume generated during long-term operation, and the need for trained personnel to process and validate point-cloud data.
Future studies should formalize these conditions to establish clearer applicability criteria and ensure reproducibility across diverse construction environments. To obtain 3D data for each work area and large structures within a large-scale construction site, and to understand the progress conditions, multiple measurement sessions are required, and the resulting datasets must be merged. Because this merging process does not occur in small- to medium-scale sites, there is a possibility that merging errors will reduce the accuracy of the 3D data. Therefore, appropriate measurement and data-construction methods for large-scale construction sites must be examined. The operational benefits observed in this study, such as improved understanding of progress and timely information sharing, should be interpreted as preliminary observations rather than generalizable findings, as no quantitative comparison with current progress confirmation practices was conducted. A systematic evaluation of the workload, efficiency, and error propagation across multiple sites is required to rigorously assess the effectiveness of the proposed workflow.
Future work will involve applying this system to multiple construction sites to further evaluate its effectiveness. To manage the large volume of data acquired daily, we will examine the mechanisms for sharing weekly point-cloud data and images extracted from videos among project stakeholders. In addition, methods for visualizing site conditions using mesh data generated from point-cloud data will be investigated to support efficient long-term data accumulation and utilization. These developments will contribute to advancing the practical realization of a construction site digital twin.
Acknowledgments
This study was partially supported by JSPS KAKENHI Grant Number 23K03997 and the Research Promotion Fund for Advanced Studies of the Graduate School of Science and Engineering, Kansai University. The authors express their sincere appreciation for this support.
- [1] H-C. Nguyen and B-R. Lee, “3D model reconstruction system development based on laser-vision technology,” Int. J. Automation Technol., Vol.10, No.5, pp. 813-820, 2016. https://doi.org/10.20965/ijat.2016.p0813
- [2] J. Su, R. Miyazaki, T. Tamaki, and K. Kaneda, “3D modeling of lane marks using a combination of images and mobile mapping data,” Int. J. Automation Technol., Vol.12, No.3, pp. 386-394, 2018. https://doi.org/10.20965/ijat.2018.p0386
- [3] F. Tanaka, M. Tsuchida, and M. Onosato, “Associating 2D sketch information with 3D CAD models for VR/AR viewing during bridge maintenance process,” Int. J. Automation Technol., Vol.13, No.4, pp. 482-489, 2019. https://doi.org/10.20965/ijat.2019.p0482
- [4] N. Kochi, S. Isobe, A. Hayashi, K. Kodama, and T. Tanabata, “Introduction of all-around 3D modeling methods for investigation of plants,” Int. J. Automation Technol., Vol.15, No.3, pp. 301-312, 2021. https://doi.org/10.20965/ijat.2021.p0301
- [5] K. Otani, T. Nagumo, and H. Masuda, “Data augmentation for deep learning training with virtual point clouds generated from CAD models,” Int. J. Automation Technol., Vol.19, No.6, pp. 1048-1057, 2025. https://doi.org/10.20965/ijat.2025.p1048
- [6] H. Date et al., “Efficient registration of laser-scanned point clouds of bridges using linear features,” Int. J. Automation Technol., Vol.12, No.3, pp. 328-338, 2018. https://doi.org/10.20965/ijat.2018.p0328
- [7] T. T. Ho et al., “Robustness of structure from motion accuracy/precision against the non-optimality in analysis settings: Case study in constant-pitch flight design,” Int. J. Automation Technol., Vol.18, No.5, pp. 621-631, 2024. https://doi.org/10.20965/ijat.2024.p0621
- [8] A. Yamaguchi, K. Harada, and S. Kubota, “Visualization of construction progress and information system concept using three-dimensional point cloud data,” Artificial Intelligence and Data Science, Vol.3, No.J2, pp. 277-286, 2022 (in Japanese). https://doi.org/10.11532/jsceiii.3.J2_277
- [9] A. Yamaguchi, T. Tanaka, and S. Kubota, “Digital twin of construction site based on three-dimensional point cloud data,” Japanese J. of JSCE, Vol.79, No.22, Article No.22-22044, 2023 (in Japanese). https://doi.org/10.2208/jscejj.22-22044
- [10] S. Kubota, T. Hayakawa, A. Yamaguchi, and Y. Yasumuro, “Visualization and centralized management of progress using 3D data at large-scale construction sites,” Artificial Intelligence and Data Science, Vol.4, No.3, pp. 786-793, 2023 (in Japanese). https://doi.org/10.11532/jsceiii.4.3_786
- [11] S. Kubota and A. Yamaguchi, “Development of a construction-information system by measuring, processing, and utilizing 3D data toward creating a digital twin,” Proc. of the 42nd Int. Symp. on Automation and Robotics in Construction, pp. 665-673, 2025. https://doi.org/10.22260/ISARC2025/0087
- [12] C. Ye et al., “A digital twin of bridges for structural health monitoring,” Proc. of the 12th Int. Workshop on Structural Health Monitoring, 2019. https://doi.org/10.12783/shm2019/32287
- [13] J. Fujii, R. Yoshida, and M. Amakata, “Proposal for DX in urban river management using digital twin,” Artificial Intelligence and Data Science, Vol.2, No.J2, pp. 495-502, 2021 (in Japanese). https://doi.org/10.11532/jsceiii.2.J2_495
- [14] buildingSMART International. https://www.buildingsmart.org [Accessed December 26, 2025]
- [15] buildingSMART International, “Industry Foundation Classes (IFC).” https://www.buildingsmart.org/standards/bsi-standards/industry-foundation-classes/ [Accessed December 26, 2025]
- [16] T. Suzuki, S. Shiozawa, A. Yamaba, and Y. Amano, “Forest data collection by UAV lidar-based 3D mapping: Segmentation of individual tree information from 3D point clouds,” Int. J. Automation Technol., Vol.15, No.3, pp. 313-323, 2021. https://doi.org/10.20965/ijat.2021.p0313
- [17] S. Nishiwaki, H. Kondo, S. Yoshida, and T. Emaru, “Proposal of UAV-SLAM-based 3D point cloud map generation method for orchards measurements,” J. Robot. Mechatron., Vol.36, No.5, pp. 1001-1009, 2024. https://doi.org/10.20965/jrm.2024.p1001
- [18] K. Ohno, H. Date, and S. Kanai, “Study on real-time point cloud superimposition on camera image to assist environmental three-dimensional laser scanning,” Int. J. Automation Technol., Vol.15, No.3, pp. 324-333, 2021. https://doi.org/10.20965/ijat.2021.p0324
- [19] H. C. Yuan and S. Kubota, “Updating and utilizing 3D point cloud data of road structures using multiple measurement devices,” Proc. of the 20th Int. Conf. on Computing in Civil and Building Engineering, Vol.1, pp. 662-673, 2025. https://doi.org/10.1007/978-3-031-84208-5_49
- [20] M. Soilán, D. González-Aguilera, A. del-Campo-Sánchez, D. Hernández-López, and S. Del Pozo, “Roar marking degradation analysis using 3D point cloud data acquired with a low-cost Mobile Mapping System,” Automation in Construction, Vol.141, Article No.104446, 2022. https://doi.org/10.1016/j.autcon.2022.104446
- [21] H. J. Wang, J. P. Zhang, K. W. Chau, and M. Anson, “4D dynamic management for construction planning and resource utilization,” Automation in Construction, Vol.13, No.5, pp. 575-589, 2004. https://doi.org/10.1016/j.autcon.2004.04.003
- [22] Z. Ma, Q. Shen, and J. Zhang, “Application of 4D for dynamic site layout and management of construction projects,” Automation in Construction, Vol.14, No.3, pp. 369-381, 2005. https://doi.org/10.1016/j.autcon.2004.08.011
- [23] K. Kanzaki, “Utilization of the three-dimensional model to a construction production system,” J. of Japan Society of Civil Engineers, Ser. F4 (Construction and Management), Vol.73, No.4, pp. I_55-I_63, 2017 (in Japanese). https://doi.org/10.2208/jscejcm.73.I_55
- [24] K. Nakamura, Y. Umehara, M. Nakahara, and R. Imai, “4D spatial–temporal information infrastructure for digital twin environments using spatial IDs,” Computer-Aided Civil and Infrastructure Engineering, Vol.40, No.30, pp. 6184-6200, 2025. https://doi.org/10.1111/mice.70146
- [25] G. Garcés, “Advances in human-robot collaboration (HRC) in Construction 5.0 for building construction: A bibliometric and systematic literature review,” J. of Information Technology in Construction, Vol.30, pp. 1244-1276, 2025. https://doi.org/10.36680/j.itcon.2025.050
- [26] European Telecommunications Standards Institute, “Intelligent transport systems (ITS); Vehicular communications; Basic set of applications; Local dynamic map (LDM); Rationale for and guidance on standardization (ETSI TR 102 863 V1.1.1),” 2011.
- [27] Special Interest Group on Information Systems, Information Processing Society of Japan, “Information systems,” Digital dictionary—Basic knowledge of important terms (2nd edition), 2019. https://ipsj-is.jp/isdic/1095 [Accessed December 26, 2025]
This article is published under a Creative Commons Attribution-NoDerivatives 4.0 Internationa License.