Research Paper:
Semantic Segmentation of TLS Colored Point Cloud via Cube Map Projection with RGB Image-Assisted Learning
Tomohiro Mizoguchi†

Sanyo-Onoda City University
1-1-1 Daigakudori, Sanyo-Onoda, Yamaguchi 756-0884, Japan
†Corresponding author

In recent years, a wide variety of three-dimensional (3D) scanning devices have been developed, allowing users to select appropriate sensing systems depending on their objectives and operational constraints. Among these devices, terrestrial laser scanners (TLS) offer superior scanning quality and accuracy and continue to play an important role in 3D sensing. Within TLS point cloud processing, object recognition and semantic segmentation are regarded as particularly important tasks. Numerous methods have been proposed for this purpose, and in recent years, approaches based on deep learning have attracted considerable attention. However, point cloud data are inherently irregular, unstructured, and unordered, which can make it challenging for existing methods to fully exploit their spatial information and consistently achieve satisfactory performance. In this study, we focus on TLS point clouds with RGB information and propose a semantic segmentation framework based on cube map projection. In the proposed framework, the 3D point cloud is first projected into a cube map representation to generate images corresponding to each face of the cube. Semantic segmentation is then applied to the generated images using mature two-dimensional (2D) convolutional neural networks (CNNs). The resulting semantic labels are subsequently reprojected onto the original point cloud, thereby achieving semantic segmentation of the 3D point cloud. The first advantage of the proposed framework is that it enables the application of well-established 2D CNN-based segmentation methods to the inherently challenging task of 3D point cloud segmentation. The second advantage is that RGB images, which are relatively easy to acquire and annotate, can be used as training data instead of 3D point clouds. The effectiveness of the proposed framework is validated through a series of experiments and evaluations conducted on TLS point clouds acquired in forest environments.
1. Introduction
High-density and high-precision reconstruction of real-world environments as point clouds in computational space has become an important objective in many fields. To address this need, a wide variety of three-dimensional (3D) scanners have emerged in recent years, ranging from high-cost, high-quality systems to low-cost and easily deployable devices, and they have been widely adopted across diverse applications. This technological diversification enables users to select appropriate scanning methods according to specific purposes, required accuracy, and operational constraints.
Representative 3D scanning technologies include terrestrial laser scanners (TLS), mobile laser scanners (MLS), unmanned aerial vehicle (UAV)-borne laser scanning systems (ULS), as well as compact LiDAR devices integrated into tablet computers and head-mounted displays (e.g., iPad and HoloLens), among others. In MLS systems, laser scanners are handheld or mounted on vehicles or robots, allowing efficient and continuous acquisition of surrounding environments while moving. Furthermore, when such systems are deployed on UAVs, they enable large area scanning from an aerial perspective and facilitate data acquisition in locations that are difficult to access from the ground. These mobile scanning systems have been widely utilized for buildings 1, civil infrastructure 2, urban environments 3, forests 4, and river embankments 5. In contrast, compact devices such as iPads and HoloLens are useful due to their low cost and ability to provide rapid spatial understanding, despite their limited scanning range. Such devices have been increasingly applied to indoor environments 6,7, forests 8, and cultural heritage 9.
By comparison, TLS systems are typically operated on tripods, which necessitates repositioning and reinstallation of the equipment at multiple scanning locations. As a result, TLS-based surveys tend to be relatively time-consuming. However, TLS can acquire point clouds with superior scanning accuracy and quality compared to other scanning modalities. For this reason, TLS continues to play an important role in applications where high-precision and data quality are required. Representative examples include scaling evaluation of concrete structures 10, tree species classification based on bark characteristics 11, 3D modeling of production facilities 12, and extraction of small ceiling-mounted facilities 13. Moreover, many modern TLS systems are equipped with integrated cameras, making it common to acquire point clouds enriched with color information. This enables analysis and recognition processes that exploit not only geometric information but also visual features, thereby further expanding the range of practical applications of TLS point clouds.
A common challenge in the practical use of TLS-acquired point clouds is the accurate identification and separation of target objects from the numerous elements contained within the data. For example, in forest point clouds, extracting individual trees constitutes a critical task. Similar challenges arise in many application domains where TLS is employed. Therefore, techniques that enable accurate recognition and extraction of objects from point clouds are of crucial importance for the practical utilization of TLS data.
1.1. Related Works
One effective approach to addressing these challenges is object recognition in point clouds using deep learning techniques 14. Representative methods include PointNet 15 and its extension, PointNet\(++\) 16. These methods have been applied to object recognition and semantic segmentation in point clouds, and have demonstrated promising performance. However, point cloud data are inherently irregular, unstructured, and unordered, which makes them difficult to process. Compared with two-dimensional (2D) convolutional neural networks (CNNs) designed for image data, point cloud processing techniques are still considered to be less mature 17. In addition, unlike image-based tasks, it is difficult to obtain sufficiently large-scale annotated datasets for point clouds, and constructing such datasets often requires substantial time and human effort. Against this background, an effective strategy for object recognition in point clouds is to first represent point clouds as images, perform object detection or semantic segmentation on the images using 2D CNN, and then project the results back onto the original point clouds.
Structure from Motion and Multi-View Stereo are widely used techniques for reconstructing 3D models from multiple images, particularly in surveying applications, as cameras can be easily mounted on UAVs 18,19. These methods provide relative camera positions and orientations for each image with respect to the reconstructed 3D model, enabling straightforward correspondence between images and 3D data. Leveraging this property, several studies have reported approaches in which semantic segmentation is first performed on images and subsequently transferred to point clouds to achieve 3D semantic segmentation 20,21.
Similarly, several studies have investigated methods that convert laser-scanned point clouds into images and apply 2D CNNs for object recognition and semantic segmentation. For example, Windrim and Bryson 22 proposed a method targeting UAV-based LiDAR point clouds of trees. In their approach, ground points are first removed, and the remaining points are projected onto the \(xy\)-plane to generate orthographic images in which pixel values represent point density. Tree detection is then performed on these images. While this method is effective for point clouds acquired from an aerial perspective, it is not well suited for TLS point clouds captured from ground level, where side surfaces of objects are observed and significant information loss can occur due to 2D projection. In contrast, Boulch et al. 23 proposed a method that generates multiple RGB and depth images from colored point clouds using arbitrary viewpoints. Semantic segmentation is applied to each image, and the resulting pixel-wise class labels are transferred back to the point cloud to achieve 3D semantic segmentation. However, this approach tends to suffer from degraded segmentation accuracy in regions where the point cloud contains missing data, as such gaps are also reflected in the generated images. Moreover, because the images are rendered from meshes generated from point clouds, image quality may deteriorate in interpolated regions between points. Sanchez Castillo et al. 17 focused on the fact that TLS point clouds can be represented in polar coordinates and proposed a method that projects point clouds onto planar images using gnomonic projection, followed by semantic segmentation with 2D CNNs. An advantage of this approach is that the projection plane can be oriented arbitrarily, allowing the generation of images with properties equivalent to those of conventional camera images. Consequently, mature 2D CNN architectures can be directly applied. The effectiveness of the method has been demonstrated through experiments conducted in indoor environments.
1.2. Research Purpose and Overview of the Proposed Approach
In this study, we propose a framework for semantic segmentation of 3D point clouds by converting TLS-acquired point clouds into images based on cube map projection and applying semantic segmentation designed for image processing. An overview of the proposed framework is illustrated in Fig. 1. In the proposed approach, a point cloud acquired by a TLS is first taken as input and converted into a cube map representation through central perspective projection, generating RGB images corresponding to each face of the cube. Semantic segmentation is then applied to each image using mature 2D CNNs. The resulting semantic labels are subsequently reprojected onto the original point cloud, thereby achieving semantic segmentation of the 3D point cloud. This framework enables the direct utilization of well-established 2D CNNs for point cloud processing. In addition, it offers the advantage that training data can be prepared more easily using RGB images captured by conventional cameras, compared with conventional point cloud-based approaches.
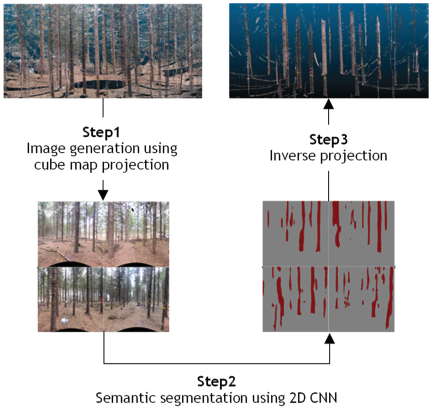
Fig. 1. Overview of our proposed method.
1.3. Rationale for Using Cube Map Projection
In this section, we explain the rationale for selecting cube map projection as the image representation for CNN-based semantic segmentation.
Point clouds acquired by TLS are obtained by emitting laser beams at fixed angular intervals in both the horizontal and vertical directions and measuring the distances to target objects. Consequently, the coordinates of each point can be represented in a polar coordinate system defined by azimuth and polar angles. One commonly used approach for converting such point cloud data into images is the equirectangular projection. In this method, the azimuth and polar angles are mapped to the horizontal and vertical axes of a Cartesian image, respectively, by unfolding the spherical surface onto a plane. However, this projection method suffers from severe geometric distortions near the polar regions, making it unsuitable for direct input to CNNs. An example of an equirectangular projection image is shown in Fig. 2. Since the TLS point clouds used in this study have a limited vertical scanning range and do not cover the zenith direction, the severe distortions near the polar regions are difficult to observe directly. Therefore, for illustrative purposes, we present an equirectangular projection image generated from a TLS point cloud acquired beneath a road bridge using a different laser scanner capable of capturing the full vertical field of view. As shown in Fig. 2(a), the bridge structure originally exhibits straight geometric features. In contrast, in the equirectangular projection image shown in Fig. 2(b), the structure appears significantly curved, particularly near the polar regions, clearly indicating the presence of severe geometric distortion. Such distortion causes large variations in object shapes depending on their positions in the image, making stable feature extraction difficult.
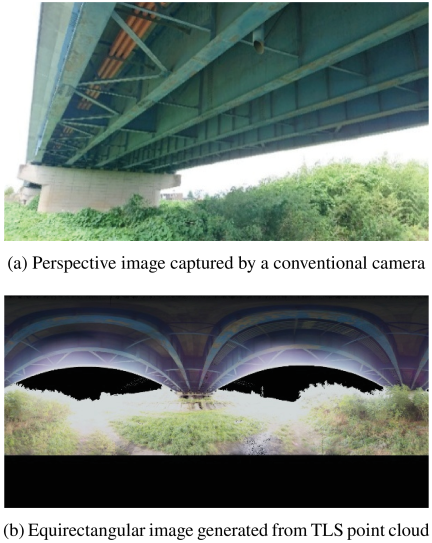
Fig. 2. Comparison of a perspective image and an equirectangular projection image.
In this study, the encoder of the semantic segmentation network is initialized with a CNN model pretrained on a large-scale natural image dataset and trained through fine-tuning. Such pretrained models implicitly assume image characteristics similar to those of conventional perspective camera images. When strong geometric distortions are present, the transferred feature representations may become less effective. Therefore, projection methods that produce images with distortion characteristics close to those of standard camera images are desirable. For example, in equirectangular projection, the apparent shape of the same object varies significantly depending on its position in the image, which can hinder stable feature extraction and degrade CNN-based recognition performance.
As an alternative image representation for point clouds, cube map projection can be employed. Cube map projection generates images by projecting points on a unit sphere onto the six faces of a surrounding cube using central perspective projection, and it has been widely used in omnidirectional image processing 24. Since TLS point clouds can be expressed in polar coordinates, they can be projected onto a unit sphere, making cube map-based image generation applicable in this study. Moreover, the images obtained for each face of the cube exhibit projection characteristics equivalent to those of conventional camera images, allowing mature 2D CNNs to be directly applied to each image.
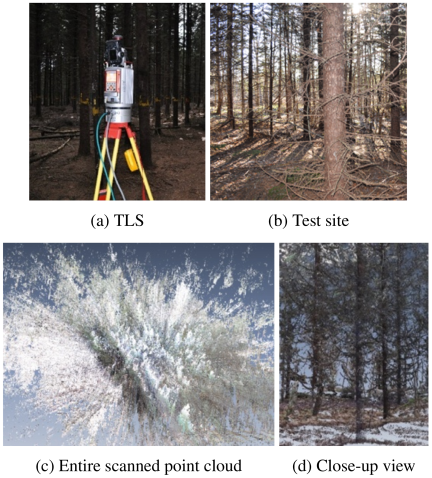
Fig. 3. Laser scanner and point cloud.
Both gnomonic projection 17 and cube map projection map points on a sphere onto planar images using central perspective projection. Gnomonic projection employs a single projection plane and may introduce significant distortions near image boundaries when an excessively large field of view is used, thereby requiring careful control of the effective field of view in practical applications. In contrast, cube map projection decomposes the spherical surface into six planar faces, each of which can be regarded as a local gnomonic projection with a limited field of view. By restricting the field of view on each face, cube map projection reduces distortion and provides image representations that are more stable and better suited for 2D CNNs. In practice, the field of view of each face is fixed to 90°, which limits boundary distortions without requiring manual tuning of the field of view. From this perspective, cube map projection can be considered a practical alternative to gnomonic projection for wide-field spherical data.
1.4. Test Site and 3D Scanning
The point cloud data used in this study consist of two datasets acquired using a TLS in a forest, as shown in Fig. 3. A RIEGL VZ-400 laser scanner was employed for data acquisition. Each point cloud contains approximately 20 million points. The point clouds were acquired with the scanner position set as the origin, using a fixed angular resolution of 0.04° in both the horizontal and vertical directions. The scanning range covers 360° in the horizontal direction and 100° in the vertical direction, from \(+60°\) to \(-40°\). The vertical axis (\(z\)-axis) was aligned with the gravity direction during data acquisition, while the horizontal orientation depends on the internal coordinate system of the scanner.
In addition, camera images were used as training data. The image data consisted of images of coniferous trees, such as cedar, cypress, and pine, captured in multiple forest environments. Examples of the image data are shown in Fig. 4.
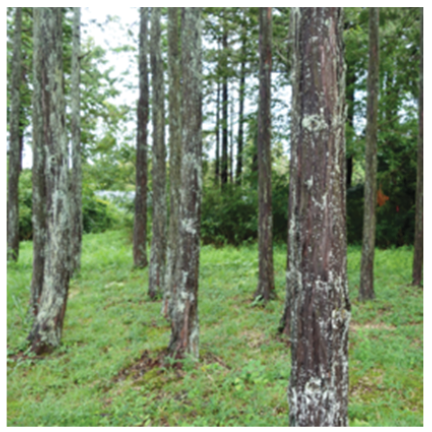
Fig. 4. An example of images for training.
2. Our Proposed Method
As illustrated in the processing flow shown in Fig. 1, the proposed method consists of three main steps: (1) conversion of the point cloud into images using cube map projection, (2) semantic segmentation performed on the generated images, and (3) reprojection of the segmentation results onto the original point cloud. The details of each step are described below.
2.1. Image Generation Based on Cube Map Projection
2.1.1. Projection of Point Clouds onto a Unit Sphere
First, for each point \((x_i,y_i,z_i)\) in the point cloud, the scanning distance \(r_i\), azimuth angle \(\theta_i\), and polar angle \(\varphi_i\) from the scanner origin are computed based on the laser emission direction as defined in Eqs. \(\eqref{eq:1}\)–\(\eqref{eq:3}\). The point coordinates are then converted into a polar coordinate representation \((r_i,\theta_i,\varphi_i)\).
Subsequently, the scanning distance is normalized by setting \(r_i=1\), and each point is mapped onto the unit sphere, as illustrated in Fig. 5(a). Note that, depending on the TLS model, the above polar coordinate information may be directly included in the output files. In such cases, the aforementioned computations can be omitted.
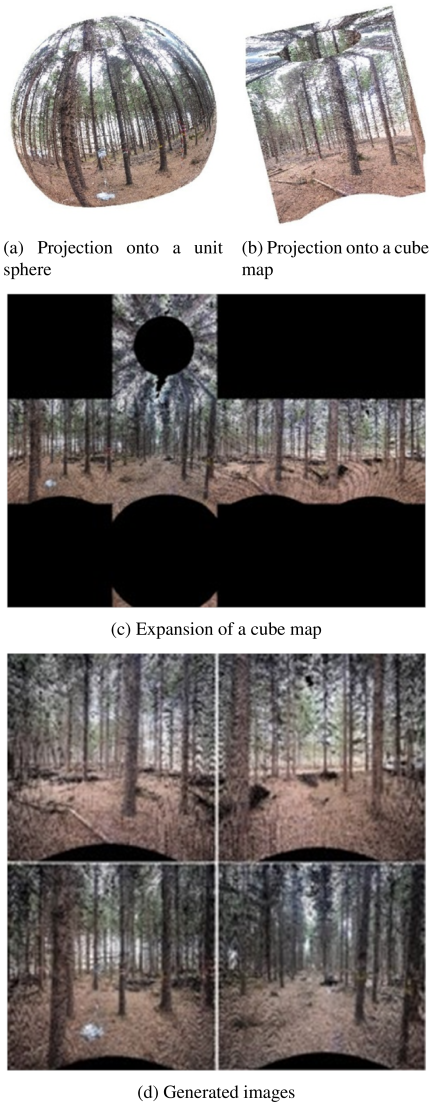
Fig. 5. Cube map projection.
2.1.2. Cube Map Projection
Next, each point on the unit sphere is projected onto a cube map. A cube map represents omnidirectional information using six square images. Since the cube is defined as a cube that circumscribes the unit sphere, each face of the cube is a square with a side length of 2.
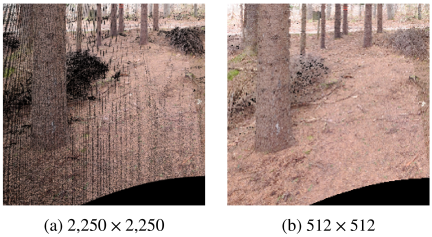
Fig. 6. Image size reduction.
To perform cube map projection, the cube face onto which each point is projected must first be determined. This can be formulated as the problem of identifying the face of the cube, centered at the origin, that is intersected by the ray connecting the origin and each scanned point. Accordingly, let the 3D coordinates of each point on the unit sphere be denoted as \((x_i^s,y_i^s,z_i^s)\). Then, the maximum absolute value \(m\) among the coordinate components is computed using Eq. \(\eqref{eq:4}\).
Next, each coordinate is normalized by \(m\) as defined in Eqs. \(\eqref{eq:5}\)–\(\eqref{eq:7}\), yielding the normalized coordinates \((x_i^c,y_i^c,z_i^c)\).
After the projection face has been determined, the 2D coordinates \((u_i,v_i)\) on the projection face are computed using Eqs. \(\eqref{eq:5}\)–\(\eqref{eq:7}\). For example, when the projection face is the \(+X\) face, the 2D coordinates are given by \((u_i,v_i)=(y_i^c,z_i^c)\). Based on these coordinates, each projection face is converted into an image. The result of projecting the point cloud onto the cube map is illustrated in Fig. 5(b). Fig. 5(c) shows the images generated by unfolding the cube map. Since the upward- and downward-facing vertical faces contain relatively few scanned points and large regions without color information, these faces were not used in this study. Instead, only the four horizontal faces shown in Fig. 5(d) were utilized.
2.1.3. Image Size
As shown in Fig. 6(a), the generated images contained empty pixels where no points were assigned, appearing as vertical stripe-like patterns. In addition, multiple points were sometimes mapped to the same pixel. In Fig. 6(a), empty pixels are displayed in black. Since such empty pixels act as noise and may adversely affect subsequent tree stem detection, the images were down sampled to a resolution of \(512\times 512\) pixels. When multiple points were assigned to a single pixel, the point with the shortest distance from the scanner was selected. The down sampled images are shown in Fig. 6(b). Compared with Fig. 6(a), a noticeable reduction in empty pixels can be observed in the resulting images.
2.2. Semantic Segmentation Using U-Net
Next, semantic segmentation is performed on the generated images using deep learning techniques. Although various methods have been proposed for image-based semantic segmentation, this study adopts U-Net 25. U-Net consists of an encoder that extracts feature representations and a decoder that performs region prediction through up sampling. Feature maps from the encoder at the same resolution level are concatenated with the corresponding decoder feature maps along the channel dimension via skip connections. This architecture enables the simultaneous utilization of high-level semantic information and low-level spatial information, allowing for precise semantic segmentation. In this study, considering the limited number of available training images, the encoder part of U-Net was replaced with a VGG16 network 26 pretrained on the ImageNet dataset 27, and the network was trained by fine-tuning this pretrained model. Accordingly, the input images are resized to \(224\times 224\) pixels during training. Although both U-Net and VGG16 are relatively classical architectures, they were selected because they provide stable performance and sufficient accuracy. Therefore, these models are considered appropriate and reasonable for verifying the effectiveness of the proposed approach.
2.3. Reprojection of Segmentation Results
Finally, the segmentation results obtained on the images are transferred to the point cloud data. In this process, the segmentation label assigned to each pixel in the image is propagated to all corresponding points in the point cloud. As a result, when multiple points correspond to a single pixel, the same label is assigned to all of those points.
3. Experimental Results
3.1. Data Set
Annotations were performed to generate training data and to create ground truth data for validation. The annotation targets were limited to coniferous trees that grow vertically, and the detection range was restricted to within approximately 15 m from the scanner position. Based on these criteria, all coniferous trees located within the defined range were manually annotated by visual inspection.
Because enough images for training could not be obtained, data augmentation was applied to the training dataset. To evaluate the effectiveness of data augmentation, two datasets were prepared: Dataset 1, consisting of 150 images without data augmentation, and Dataset 2, in which the number of images was increased to 900 through data augmentation. The segmentation results obtained using these two datasets were compared. Data augmentation was performed by applying a combination of gamma correction-based brightness and saturation transformations, as well as horizontal flipping, resulting in a sixfold increase in the number of training images. The gamma value \(\gamma\) used for gamma correction ranged from 0.6 to 3.0. Examples of the data augmentation are shown in Fig. 7, illustrating cases with the minimum and maximum gamma values of 0.6 and 3.0, respectively.
For the evaluation of semantic segmentation performance, a total of eight images generated from two TLS point clouds acquired at two different locations were used.
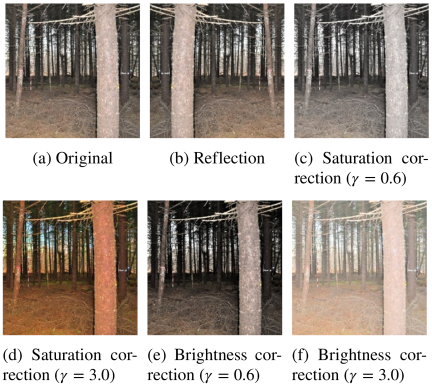
Fig. 7. Data augmentation.
3.2. Evaluation of Detected Tree Stems
First, the performance of tree stem detection based on semantic segmentation was evaluated through visual comparison with the ground truth images. Examples of the tree stem detection results are shown in Fig. 8. In this study, Precision, Recall, and F1 score, which are commonly used evaluation metrics, were adopted. In the evaluation, True Positive (TP) represents the number of tree stems that were correctly detected among those actually present. False Negative (FN) denotes the number of tree stems for which no label was assigned to any point, despite their presence in the ground truth. False Positive (FP) refers to the number of incorrectly extracted regions that do not correspond to ground-truth tree stems, including trees located outside the detection range as well as artificial objects such as poles within the target area. The evaluation results are summarized in Table 1.
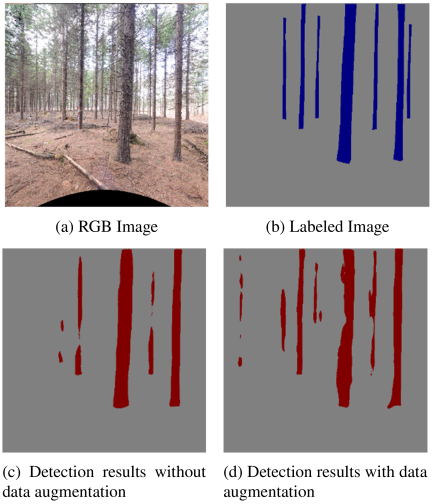
Fig. 8. Results of stem detection with and without data augmentation.
The two point clouds used in the experiments contained a total of 62 trees. Among them, 35 trees were detected using Dataset 1, while 52 trees were detected using Dataset 2. A comparison between the two datasets indicates that Dataset 2 achieved a higher number of TP detections and a lower number of FN cases. Meanwhile, FP remained at a low level for both datasets. Precision showed nearly identical values for the two datasets, indicating stable detection accuracy. In contrast, Recall improved substantially from 0.56 for Dataset 1 to 0.84 for Dataset 2. As a result, the F1 score was also higher for Dataset 2. These results confirm that data augmentation effectively improves tree stem detection performance.
Nevertheless, a certain number of trees remained undetected, which constitutes a remaining challenge. In addition, for trees with small diameters, cases were observed in which only partial regions of the tree stems were detected. Among the trees classified as TP, those for which less than 60% of the points corresponding to the ground truth were correctly labeled amounted to 18 trees for Dataset 1 and 23 trees for Dataset 2, indicating that approximately half of the detected trees were only partially segmented in both datasets. Furthermore, in cases where trees were arranged with depth-wise overlap from the scanner’s viewpoint, multiple trees were sometimes incorrectly detected as a single tree. To address these issues, future work should focus on enriching the training data, introducing more advanced semantic segmentation methods, and developing approaches that exploit depth information to distinguish overlapping tree stems.
Table 1. Evaluation of stem detection performance.

Table 2. Evaluation of IoU.

3.3. Evaluation Based on Intersection over Union
Intersection over Union (IoU), a commonly used evaluation metric, was employed to assess the performance of semantic segmentation. IoU is widely used in object detection tasks and quantitatively measures the degree of overlap between predicted regions and ground-truth regions.
The evaluation results are summarized in Table 2. In this study, IoU was computed for each of the eight images used in the experiments. In addition, the effect of data augmentation on detection performance was also examined. When Dataset 1 and Dataset 2 were used, the IoU values across the eight images ranged from 0.10 to 0.66 and from 0.34 to 0.64, respectively, indicating a certain degree of variation. Furthermore, IoU improvement due to data augmentation was observed in five out of the eight images, demonstrating the effectiveness of data augmentation. In contrast, a decrease in IoU was observed for the remaining three images. However, this reduction does not necessarily indicate degraded detection performance. In the present study, data augmentation increased the number of detected trees, which also led to an increase in false detections outside the target range. As a result, IoU values decreased relatively, despite an overall improvement in detection coverage.
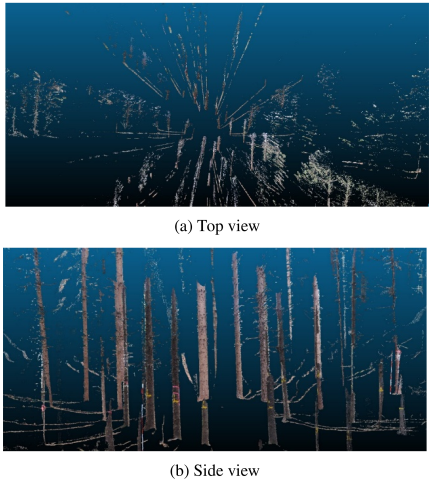
Fig. 9. Visual evaluation of segmentation result.
3.4. Visual Evaluation of Label Reprojection Results
Next, a visual evaluation was conducted on the results obtained by projecting the detection outcomes back onto the point cloud data. Fig. 9 shows a portion of the point cloud in which only the detected tree stems are extracted. For both point cloud datasets, the detection results obtained using each dataset were examined. The results indicate that the tree stems detected by U-Net were generally labeled correctly.
On the other hand, incorrect labeling of non-tree-stem points was frequently observed in background regions near the boundaries of tree stems in the images, as well as on the ground surface. This is mainly because it is difficult to assign labels exclusively to tree stems on the down sampled images, leading to the inclusion of surrounding ground and background regions in the detected areas. To address this issue, incorporating additional preprocessing steps, such as removing ground points prior to image generation and semantic segmentation, would be an effective approach to reducing false detections.
3.5. Discussion
The cube map projection results vary depending on the installation orientation of the TLS. This is similar to conventional camera images, in which the appearance of the same object changes depending on the viewing direction. However, such orientation differences generally have a limited impact on recognition performance, and in our experiments, no significant degradation in accuracy is expected due to differences in the TLS installation direction. Therefore, the influence of TLS orientation on the proposed method is considered to be minor. It should be noted that objects that span across two adjacent cube faces may be split during projection, which can make recognition more difficult. To address this issue, an effective approach would be to additionally generate cube map images with a half-cycle rotated orientation and use them in combination.
Although this study focused on validating the effectiveness of the proposed projection-based framework, quantitative comparison with deep learning methods specifically designed for 3D point cloud segmentation, such as PointNet 15, PointNet\(++\) 16, and their extensions, remains an important future research direction. Establishing fair evaluation settings that consider the large-scale nature and density variations of forest TLS point clouds will be essential for comprehensive performance comparison.
4. Conclusion and Future Works
In this study, we proposed a framework for semantic segmentation of TLS point clouds based on cube map-based image generation, which enables the use of CNNs originally designed for image processing. The effectiveness of the proposed framework was validated through a series of experiments. The results demonstrate that cube map projection allows the generation of images from TLS point clouds with low distortion, comparable to conventional camera images. This property enables the direct application of high-performance 2D CNN-based semantic segmentation methods to point cloud data. Furthermore, by reprojecting the segmentation results obtained on the images back onto the point clouds, semantic segmentation of 3D point clouds can be successfully achieved. These findings indicate that the proposed approach is an effective solution for object recognition in TLS point clouds, for which acquiring large-scale training datasets is often difficult.
As future work, experiments and evaluations involving multiple semantic classes should be conducted. In this study, semantic segmentation was limited to two classes, tree stems and background, using TLS point clouds acquired in coniferous forests, and the effectiveness of the proposed framework was confirmed to a certain extent. Future studies should extend the framework to multi-class segmentation and evaluate its general applicability through experiments in diverse indoor and outdoor environments. In addition, the effectiveness of incorporating additional information, such as depth images and laser reflection intensity, which was not examined in this study, will be investigated in future work.
- [1] T. Mizoguchi, “Detection of building equipment from mobile laser scanning point clouds using reflection intensity correction for detailed BIM generation,” Sensors, Vol.25, No.22, Article No.6937, 2025. https://doi.org/10.3390/s25226937
- [2] R. Blaskow and H. G. Maas, “Structural health monitoring of bridge with personal laser scanning: Segment-based analysis of systematic point cloud deformations,” ISPRS Ann. Photogramm. Remote Sens. Spat. Inf. Sci., Vol.X-2-2024, pp. 9-16, 2024. https://doi.org/10.5194/isprs-annals-x-2-2024-9-2024
- [3] K. Ishikawa, D. Kubo, and Y. Amano, “Curb detection and accessibility evaluation from low-density mobile mapping point cloud data,” Int. J. Automation Technol., Vol.12, No.3, pp. 376-385, 2018. https://doi.org/10.20965/ijat.2018.p0376
- [4] J. R. Kellner et al., “New opportunities for forest remote sensing through ultra-high-density drone lidar,” Surv. Geophys., Vol.40, pp. 959-977, 2019. https://doi.org/10.1007/s10712-019-09529-9
- [5] N. Miura, T. F. Koyanagi, S. Yamada, and S. Yokota, “Classification of grass and forb species on riverdike using UAV LiDAR-based structural indices,” Int. J. Automation Technol., Vol.15, No.3, pp. 268-273, 2021. https://doi.org/10.20965/ijat.2021.p0268
- [6] K. Khoshelham, H. Tran, and D. Acharya, “Indoor mapping eyewear: Geometric evaluation of spatial mapping capability of hololens,” Int. Arch. Photogramm. Remote Sens. Spat. Inf. Sci., Vol.XLII-2/W13, pp. 805-810, 2019. https://doi.org/10.5194/isprs-archives-xlii-2-w13-805-2019
- [7] M. Weinmann et al., “3D indoor mapping with the microsoft hololens: Qualitative and quantitative evaluation by means of geometric features,” ISPRS Ann. Photogramm. Remote Sens. Spat. Inf. Sci., Vol.V-1-2020, pp. 165-172, 2020. https://doi.org/10.5194/isprs-annals-v-1-2020-165-2020
- [8] C. Gollob, T. Ritter, R. Kraßnitzer, A. Tockner, and A. Nothdurft, “Measurement of forest inventory parameters with Apple iPad Pro and integrated LiDAR technology,” Remote Sens., Vol.13, No.16, Article No.3129, 2021. https://doi.org/10.3390/rs13163129
- [9] L. T. Losè, A. Spreafico, F. Chiabrando, and F. Giulio Tonolo, “Apple LiDAR sensor for 3D surveying: Tests and results in the cultural heritage domain,” Remote Sens., Vol.14, No.17, Article No.4157, 2022. https://doi.org/10.3390/rs14174157
- [10] T. Mizoguchi et al., “Quantitative scaling evaluation of concrete structures based on terrestrial laser scanning,” Autom. Constr., Vol.35, pp. 263-274, 2013. https://doi.org/10.1016/j.autcon.2013.05.022
- [11] T. Mizoguchi, A. Ishii, and H. Nakamura, “Individual tree species classification based on terrestrial laser scanning using curvature estimation and convolutional neural network,” Int. Arch. Photogramm. Remote Sens. Spat. Inf. Sci., Vol.XLII-2/W13, pp. 1077-1082, 2019. https://doi.org/10.5194/isprs-archives-xlii-2-w13-1077-2019
- [12] Y. Midorikawa and H. Masuda, “Extraction of rotational surfaces and generalized cylinders from point-clouds using section curves,” Int. J. Automation Technol., Vol.12, No.6, pp. 901-910, 2018. https://doi.org/10.20965/ijat.2018.p0901
- [13] R. Akiyama, H. Date, S. Kanai, and K. Yasutake, “Ceiling equipment extraction from TLS point clouds for reflected ceiling plan creation,” Int. J. Automation Technol., Vol.18, No.5, pp. 603-612, 2024. https://doi.org/10.20965/ijat.2024.p0603
- [14] D. Griffiths and J. Boehm, “A review on deep learning techniques for 3D sensed data classification,” Remote Sens., Vol.11, Issue 12, Article No.1499, 2019. https://doi.org/10.3390/rs11121499
- [15] R. Q. Charles, H. Su, M. Kaichun, and L. J. Guibas, “PointNet: Deep learning on point sets for 3D classification and segmentation,” 2017 IEEE Conf. Comput. Vis. Pattern Recognit. (CVPR), pp. 77-85, 2017. https://doi.org/10.1109/cvpr.2017.16
- [16] C. R. Qi, L. Yi, H. Su, and L. J. Guibas, “PointNet++: Deep hierarchical feature learning on point sets in a metric space,” Proc. 31st Int. Conf. Neural Inf. Process. Syst., pp. 5105-5114, 2017.
- [17] E. Sanchez Castillo, D. Griffiths, and J. Boehm, “Semantic segmentation of terrestrial lidar data using co-registered RGB data,” Int. Arch. Photogramm. Remote Sens. Spat. Inf. Sci., Vol.XLIII-B2-2021, pp. 223-229, 2021. https://doi.org/10.5194/isprs-archives-xliii-b2-2021-223-2021
- [18] F. Remondino, “Heritage recording and 3D modeling with photogrammetry and 3D scanning,” Remote Sens., Vol.3, Issue 6, pp. 1104-1138, 2011. https://doi.org/10.3390/rs3061104
- [19] M. Pepe, V. S. Alfio, and D. Costantino, “UAV platforms and the SfM-MVS approach in the 3D surveys and modelling: A review in the cultural heritage field,” Appl. Sci., Vol.12, Issue 24, Article No.12886, 2022. https://doi.org/10.3390/app122412886
- [20] N. Saovana, N. Yabuki, and T. Fukuda, “Automated point cloud classification using an image-based instance segmentation for structure from motion,” Autom. Constr., Vol.129, Article No.103804, 2021. https://doi.org/10.1016/j.autcon.2021.103804
- [21] E. Pellis et al., “2D to 3D label propagation for the semantic segmentation of heritage building point clouds,” Int. Arch. Photogramm. Remote Sens. Spat. Inf. Sci., Vol.XLIII-B2-2022, pp. 861-867, 2022. https://doi.org/10.5194/isprs-archives-xliii-b2-2022-861-2022
- [22] L. Windrim and M. Bryson, “Forest tree detection and segmentation using high resolution airborne LiDAR,” IEEE/RSJ Int. Conf. Intell. Robots Syst. (IROS), pp. 3898-3904, 2019. https://doi.org/10.1109/iros40897.2019.8967885
- [23] A. Boulch, J. Guerry, B. L. Saux, and N. Audebert, “SnapNet: 3D point cloud semantic labeling with 2D deep segmentation networks,” Comput. Graph., Vol.71, pp. 189-198, 2018. https://doi.org/10.1016/j.cag.2017.11.010
- [24] Y. Wen et al., “Semantic BIM enrichment for firefighting assets: Fire-ART dataset and panoramic image-based 3D reconstruction,” ISPRS J. Photogramm. Remote Sens., Vol.231, pp. 679-703, 2026. https://doi.org/10.1016/j.isprsjprs.2025.11.015
- [25] O. Ronneberger, P. Fischer and T. Brox, “U-Net: Convolutional networks for biomedical image segmentation,” Proc. 18th Int. Conf. Med. Image Comput. and Comput.-Assist. Interv. (MICCAI), Part 3, pp. 234-241, 2015. https://doi.org/10.1007/978-3-319-24574-4_28
- [26] K. Simonyan and A. Zisserman, “Very deep convolutional networks for large-scale image recognition,” Int. Conf. Learn. Represent., 2014.
- [27] J. Deng et al., “ImageNet: A large-scale hierarchical image database,” 2009 IEEE Conf. Comput. Vis. Pattern Recognit., pp. 248-255, 2009. https://doi.org/10.1109/cvpr.2009.5206848
This article is published under a Creative Commons Attribution-NoDerivatives 4.0 Internationa License.