
Paper:
Large-Scale Analysis of Intra-and Inter-Particle Distributions of SERS Enhancement Factor
Takeru Sasaki*, Taito Ikeuchi**
 , Wataru Yamamoto*, Saki Kozawa**
, Naotomo Tottori***
, Ryosuke Oketani*
, Yoko Yamanishi***
, Miho Tagawa**
, and Kotaro Hiramatsu*
*Department of Chemistry, Faculty of Science, Kyushu University
744 Motooka, Nishi-ku, Fukuoka, Fukuoka 819-0395, Japan
**Department of Materials Science and Engineering, Nagoya University
Furo-cho, Chikusa-ku, Nagoya, Aichi 464-8603, Japan
***Department of Mechanical Engineering, Faculty of Engineering, Kyushu University
744 Motooka, Nishi-ku, Fukuoka, Fukuoka 819-0395, Japan

Surface-enhanced Raman scattering (SERS) can be a powerful tool for live-cell molecular imaging, yet its quantitative reliability is often limited by signal fluctuations arising from stochastic hotspot formation. We performed a large-scale statistical analysis of the SERS enhancement factor using DNA-gold nanoparticle (DNA-AuNP) crystals as a particle-like SERS substrates. Using a home-built confocal Raman microscope, we conducted hyperspectral SERS imaging of 190 individual particles using Rhodamine 6G as a probe molecule. Multivariate curve resolution alternating least squares (MCR-ALS), applied to masked particle regions, successfully decomposed the intra-particle signals into three distinct spectral components: vertical and horizontal molecular adsorption geometries, and a metallic lattice vibration component. Our statistical analysis revealed that while absolute SERS intensities showed significant variation, particularly in the vertical orientation (CV=2.264), the horizontal orientation exhibited lower variability (CV=0.767). Furthermore, the intensity ratio between these components (C1/C2) yielded a CV of 1.907, providing a quantitative benchmark for spectral profile consistency. Furthermore, a spatial correlation between the metallic lattice signal and the specific vertical orientation was observed. These results demonstrate that DNA-AuNP crystals provide a uniform surface chemistry and a consistent distribution of enhancement sites. We propose that monitoring these low-frequency metallic lattice vibrations during the fabrication process could provide a real-time feedback mechanism to further improve the reproducibility of SERS sensors. This study establishes a robust framework for the evaluation of SERS-active substrates, paving the way for quantitative molecular sensing in complex biological environments.
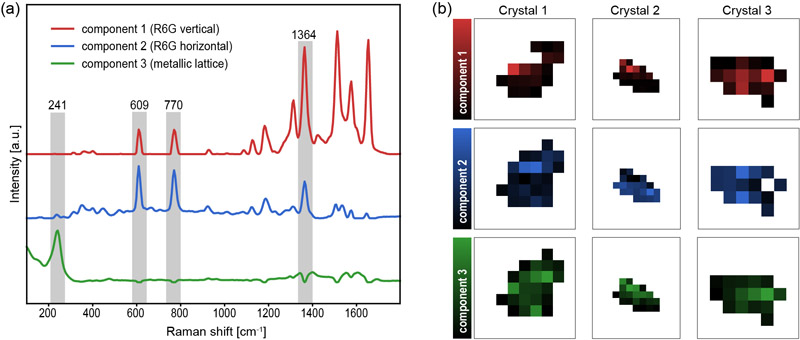
Visualization of multiple SERS components
- [1] G. van Meer, D. R. Voelker, and G. W. Feigenson, “Membrane lipids: Where they are and how they behave,” Nature Reviews Molecular Cell Biology, Vol.9, No.2, pp. 112-124, 2008. https://doi.org/10.1038/nrm2330
- [2] R. Zenobi, “Single-cell metabolomics: analytical and biological perspectives,” Science, Vol.342, No.6163, Article No.1243259, 2013. https://doi.org/10.1126/science.1243259
- [3] E. Lundberg and G. H. H. Borner, “Spatial proteomics: A powerful discovery tool for cell biology,” Nature Reviews Molecular Cell Biology, Vol.20, No.5, pp. 285-302, 2019. https://doi.org/10.1038/s41580-018-0094-y
- [4] L. D. Lavis and R. T. Raines, “Bright ideas for chemical biology,” ACS Chemical Biology, Vol.3, No.3, pp. 142-155, 2008. https://doi.org/10.1021/cb700248m
- [5] S. J. Sahl, S. W. Hell, and S. Jakobs, “Fluorescence nanoscopy in cell biology,” Nature Reviews Molecular Cell Biology, Vol.18, No.11, pp. 685-701, 2017. https://doi.org/10.1038/nrm.2017.71
- [6] E. A. Specht, E. Braselmann, and A. E. Palmer, “A critical and comparative review of fluorescent tools for live-cell imaging,” Annual Review of Physiology, Vol.79, pp. 93-117, 2017. https://doi.org/10.1146/annurev-physiol-022516-034055
- [7] A. F. Palonpon, M. Sodeoka, and K. Fujita, “Molecular imaging of live cells by Raman microscopy,” Current Opinion in Chemical Biology, Vol.17, No.4, pp. 708-715, 2013. https://doi.org/10.1016/j.cbpa.2013.05.021
- [8] R. R. Jones, D. C. Hooper, L. Zhang, D. Wolverson, and V. K. Valev, “Raman techniques: Fundamentals and frontiers,” Nanoscale Research Letters, Vol.14, No.1, Article No.231, 2019. https://doi.org/10.1186/s11671-019-3039-2
- [9] J. Langer et al., “Present and future of surface-enhanced Raman scattering,” ACS Nano, Vol.14, No.1, pp. 28-117, 2020. https://doi.org/10.1021/acsnano.9b04224
- [10] K. V. Serebrennikova, N. S. Komova, A. V. Zherdev, and B. B. Dzantiev, “SERS sensors with bio-derived substrates under the way to agricultural monitoring of pesticide residues,” Biosensors (Basel), Vol.14, No.12, Article No.573, 2024. https://doi.org/10.3390/bios14120573
- [11] J. Ando, K. Fujita, N. I. Smith, and S. Kawata, “Dynamic SERS imaging of cellular transport pathways with endocytosed gold nanoparticles,” Nano Letters, Vol.11, No.12, pp. 5344-5348, 2011. https://doi.org/10.1021/nl202877r
- [12] J. Taylor, A. Huefner, L. Li, J. Wingfield, and S. Mahajan, “Nanoparticles and intracellular applications of surface-enhanced Raman spectroscopy,” Analyst, Vol.141, No.17, pp. 5037-5055, 2016. https://doi.org/10.1039/C6AN01003B
- [13] K. Koike, K. Bando, J. Ando, H. Yamakoshi, N. Terayama, K. Dodo, N. I. Smith, M. Sodeoka, and K. Fujita, “Quantitative drug dynamics visualized by alkyne-tagged plasmonic-enhanced Raman microscopy,” ACS Nano, Vol.14, No.11, pp. 15032-15041, 2020. https://doi.org/10.1021/acsnano.0c05010
- [14] H. Sumi, N. Ohta, H. Sekiguchi, S. Harada, T. Ujihara, K. Tsukamoto, and M. Tagawa, “Designing a high-crystallinity nano-gapped particle superlattice via DNA-guided colloidal crystallization and dehydration,” Crystal Growth and Design, Vol.22, No.6, pp. 3708-3718, 2022. https://doi.org/10.1021/acs.cgd.2c00075
- [15] N. Tottori, M. Tagawa, A. Takao, L. Zhang, M. Yokomori, S. Sakuma, and Y. Yamanishi, “Thermally regulated droplet microfluidics enables uniform, size-controllable DNA-nanoparticle superlattices,” Small, Vol.22, No.54, Article No.e74787, 2026. https://doi.org/10.1002/smll.74787
- [16] T. Ikeuchi, S. Kozawa, H. Niinomi, X. Li, S. Ogawa, M. Kuwahara, T. Oshikiri, K. Hiramatsu, and M. Tagawa, “DNA-programmed core–shell nanoparticle superlattice crystals with nanogaps for SERS sensing,” ACS Applied Optical Materials, Vol.4, No.7, pp. 2028-2039, 2026. https://doi.org/10.1021/acsaom.6c00173
- [17] P. Hildebrandt and M. Stockburger, “Surface-enhanced resonance Raman spectroscopy of Rhodamine 6G adsorbed on colloidal silver,” J. of Physical Chemistry, Vol.88, No.24, pp. 5935-5944, 1984. https://doi.org/10.1021/j150668a038
This article is published under a Creative Commons Attribution-NoDerivatives 4.0 Internationa License.