
Paper:
Large-Scale Analysis of Intra-and Inter-Particle Distributions of SERS Enhancement Factor
Takeru Sasaki*, Taito Ikeuchi**
 , Wataru Yamamoto*, Saki Kozawa**
, Naotomo Tottori***
, Ryosuke Oketani*
, Yoko Yamanishi***
, Miho Tagawa**
, and Kotaro Hiramatsu*
*Department of Chemistry, Faculty of Science, Kyushu University
744 Motooka, Nishi-ku, Fukuoka, Fukuoka 819-0395, Japan
**Department of Materials Science and Engineering, Nagoya University
Furo-cho, Chikusa-ku, Nagoya, Aichi 464-8603, Japan
***Department of Mechanical Engineering, Faculty of Engineering, Kyushu University
744 Motooka, Nishi-ku, Fukuoka, Fukuoka 819-0395, Japan

Surface-enhanced Raman scattering (SERS) can be a powerful tool for live-cell molecular imaging, yet its quantitative reliability is often limited by signal fluctuations arising from stochastic hotspot formation. We performed a large-scale statistical analysis of the SERS enhancement factor using DNA-gold nanoparticle (DNA-AuNP) crystals as a particle-like SERS substrates. Using a home-built confocal Raman microscope, we conducted hyperspectral SERS imaging of 190 individual particles using Rhodamine 6G as a probe molecule. Multivariate curve resolution alternating least squares (MCR-ALS), applied to masked particle regions, successfully decomposed the intra-particle signals into three distinct spectral components: vertical and horizontal molecular adsorption geometries, and a metallic lattice vibration component. Our statistical analysis revealed that while absolute SERS intensities showed significant variation, particularly in the vertical orientation (CV=2.264), the horizontal orientation exhibited lower variability (CV=0.767). Furthermore, the intensity ratio between these components (C1/C2) yielded a CV of 1.907, providing a quantitative benchmark for spectral profile consistency. Furthermore, a spatial correlation between the metallic lattice signal and the specific vertical orientation was observed. These results demonstrate that DNA-AuNP crystals provide a uniform surface chemistry and a consistent distribution of enhancement sites. We propose that monitoring these low-frequency metallic lattice vibrations during the fabrication process could provide a real-time feedback mechanism to further improve the reproducibility of SERS sensors. This study establishes a robust framework for the evaluation of SERS-active substrates, paving the way for quantitative molecular sensing in complex biological environments.
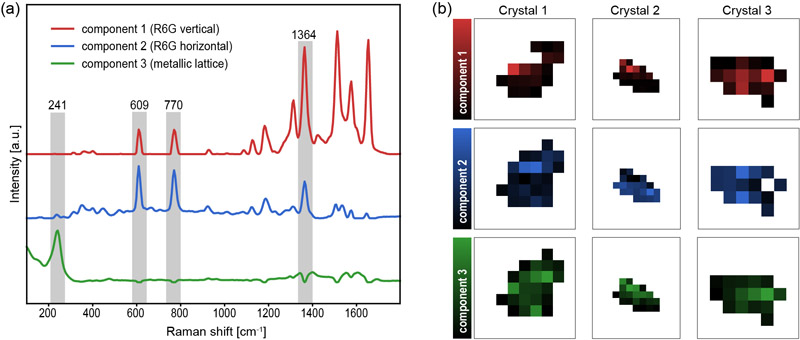
Visualization of multiple SERS components
1. Introduction
Live-cell molecular imaging is essential for understanding cellular function because cellular functions depend on the spatial organization and dynamic rearrangement of intracellular molecules. Signal transduction, metabolic regulation, and pathological progression, which represent core cellular activities, arise from the coordinated behavior of proteins, lipids, nucleic acids, and small-molecule metabolites 1,2,3. Fluorescence microscopy provides high sensitivity and molecular selectivity but requires exogenous labels, limiting direct detection of endogenous small molecules and potentially perturbing cellular states 4,5,6. Raman microscopy enables label-free molecular identification through intrinsic vibrational signatures, but its low scattering cross-section limits the detection of low-abundance species 7,8. Surface-enhanced Raman scattering (SERS) addresses this by amplifying signals through localized surface plasmon resonances in metallic nanostructures 9,10.
In pursuit of intracellular sensing, particle-based SERS substrates (e.g., gold/silver nanoparticles or superlattices) have been developed to function as local chemical probes 11,12,13. However, the quantitative reliability and reproducibility of these signals remain a major challenge. Because electromagnetic enhancement varies steeply with nanoscale geometry, the stochastic formation of hotspots leads to substantial signal fluctuations across different particles and environments. This instability is particularly pronounced in particle-based substrates compared to planar ones. Furthermore, the reproducibility of SERS signals is typically evaluated based on absolute intensities, which is insufficient for a rigorous assessment of quantitative reliability 9. Therefore, establishing a standardized, large-scale evaluation framework is essential for transitioning SERS from a qualitative analytical tool to a robust intracellular sensing platform by quantitatively characterizing probe performance before deployment in complex biological environments.
In this study, we establish a platform for the quantitative evaluation of particle-type SERS probes, using DNA-gold nanoparticle (DNA-AuNP) crystals as a proof-of-principle model. While DNA-AuNP crystals are designed for high crystallinity, their performance as SERS substrates still exhibits inherent variability. The primary objective of this work is not to demonstrate perfect reproducibility, but to provide a robust methodology to quantify exactly how much these signals vary in terms of both absolute magnitude and spectral consistency. Specifically, we performed hyperspectral SERS imaging of 190 individual particle-like substrates to statistically quantify their enhancement performance. By employing multivariate curve resolution (MCR) to extract characteristic spectral components, we visualize the spatial distribution of signal intensities and hotspots for each particle. By calculating the coefficient of variation (CV) for these MCR components, we provide a rigorous benchmark for SERS substrate performance. This study demonstrates that even when absolute intensities fluctuate, the quantitative assessment of spectral profiles provides a pathway for reliable molecular sensing. Our platform establishes a necessary foundation for the rational design and quality control of next-generation SERS probes for live-cell applications.
2. Materials and Methods
2.1. Synthesis of DNA-AuNP Crystals
DNA-AuNP crystals were synthesized adapting procedures from previous reports 14. First, 20 nm AuNPs (Nanopartz) were functionalized with thiolated DNA strands (Nihon Gene Research Laboratories; DNA #1: 5\('\)-TCAACTATTCCTACCTACAAAAAAAA-SH-3\('\); DNA #2: 5\('\)-TCCACTCATACTCAGCAAAAAAAAAA-SH-3\('\)) in borate buffer by gradually adding 5 M NaCl, followed by centrifugation to remove excess unmodified DNA. For crystallization, this DNA-AuNP mixture and a linker DNA solution (Linker #3: 5\('\)-GTAGGTAGGAATAGTTGAATTCCTT-3\('\); Linker #4: 5\('\)-TTGCTGAGTATGAGTGGAAAAGGAA-3\('\)) containing 1.0 M NaCl were mixed at a \(1:1\) flow rate ratio in a microfluidic device. Droplets were formed using an oil phase composed of 93 wt% isopropyl palmitate and 7 wt% ABIL EM180, yielding a final NaCl concentration of 0.5 M. Approximately 40 μL of the droplet solution was collected and slowly cooled from 65°C to 25°C at a rate of 0.1°C/10 min 15.
To generate SERS hotspots, retrieved crystals were incubated with 0.75 mM AgNO\(_3\), L-sodium ascorbate, and polyvinylpyrrolidone (all from Sigma-Aldrich) in \(1/15\) M phosphate buffer containing 0.5 M NaCl at 40°C for 12 hours while mixing at 2000 rpm. Finally, the crystals were washed with 0.5 M NaClO\(_4\), contracted by adding 0.5 M AgNO\(_3\) without a reducing agent at room temperature, and subsequently washed with Milli-Q water 16.
2.2. Raman Microscopy
To evaluate the SERS performance of the prepared crystals, hyperspectral mapping was performed using a home-built confocal Raman microscope (Fig. 1). The excitation source was a 532 nm continuous-wave laser (Sapphire SF NX 532-150 CDRH, Coherent, USA). The laser beam was directed through a 2-axis scanning mirror (6210 Galvano Scanner, Cambridge Technology, USA) for spatial mapping and focused onto the sample using a 20\(\times\) objective lens (NA 0.95; CFI Plan Apochromat LWWD Lambda S 20XC WI, Nikon, Japan). For sample observation, the system incorporated a high-power LED (SOLIS-1D, Thorlabs, USA) and a CMOS camera (CS165MU1/M-Zelux, Thorlabs, USA), coupled via a 490 nm short-pass dichroic mirror (DMSP490R, Thorlabs, USA).
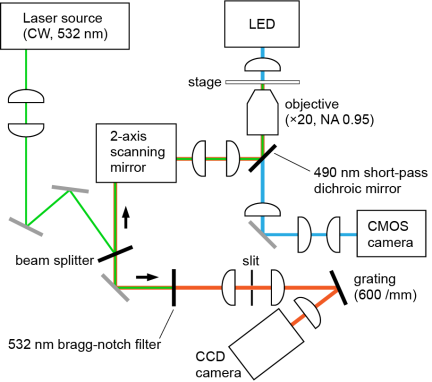
Fig. 1. Optical setup of the home-built confocal Raman microscope system.
Raman signals were collected in a backscattering geometry through the same objective and scanning mirror. A 532 nm Bragg-notch filter (SureBlock, Coherent, USA) was used to reject the excitation light. The scattered light was passed through a slit, dispersed by a home-built spectrometer equipped with a 600 lines/mm reflective diffraction grating (GR25-0605, Thorlabs, USA), and detected with a CCD camera (DU401A-BVF, Andor Technology, UK). The spectral dispersion was 6.1 cm\(^{-1}\) per pixel. The excitation power at the sample plane was set to 1.0 mW, and the exposure time was fixed at 100 ms per spectrum. Wavenumber calibration was performed using the Raman spectrum of polystyrene beads.
2.3. Sample Preparation for SERS Measurement
To evaluate the SERS performance of the synthesized substrates, Rhodamine 6G (R6G; Tokyo Chemical Industry, Japan) was employed as a probe molecule. R6G was selected as a benchmark molecule for SERS evaluation due to its large resonance Raman cross-section and well-characterized spectral features. R6G was dissolved in deionized water and subsequently mixed with the DNA-AuNP crystal suspension to achieve a final concentration of 1.0 μM. A small volume of this mixture was mounted between a coverslip and a microscope slide. The edges of the coverslip were sealed with nail polish to prevent solvent evaporation and to maintain constant sample conditions during the prolonged mapping process. The prepared slide was then placed on the stage of the home-built confocal Raman microscope (Fig. 1).
2.4. Dataset and Analysis
A total of five Raman hyperspectral images were acquired, containing 190 individual DNA-AuNP particles. These particles were sampled with a bias toward the target diameter of 1–2 μm to focus the analysis on the intended morphology. Mapping was performed with a step size of 200 nm and an estimated laser spot size of 286 nm. The total acquisition time for these five images was approximately 3 hours, averaging approximately 1 min per particle.
All spectral data were processed using a Python-based program. Fluorescence backgrounds were removed from all raw spectra using a rolling-ball algorithm. For intra-particle analysis of hyperspectral data, noise reduction was performed using singular value decomposition prior to the application of a three-component multivariate curve resolution-alternating least squares (MCR-ALS) model, where each pixel was reconstructed by these three components to retrieve pure component spectra and their distribution maps. The data processing workflow was completed within 5 min. For inter-particle analysis, the background-subtracted spectra were directly averaged to evaluate the overall spectral characteristics across multiple particles.
3. Results and Discussion
3.1. SERS Spectral Analysis and Peak Assignment
The SERS performance of the DNA-AuNP crystals was evaluated using R6G as a probe molecule (Fig. 2). While the Raman signals in the bulk solution were entirely obscured by intense fluorescence, the DNA-AuNP crystals yielded sharp R6G fingerprint peaks with a high signal-to-noise ratio. The observed peaks at 610 cm\(^{-1}\) and 770 cm\(^{-1}\) correspond to the C–C–C ring in-plane bend and the C–H out-of-plane bend, respectively. Other identified features include C–H in-plane bends at 1126 and 1177 cm\(^{-1}\), and a series of aromatic C–C stretching vibrations at 1364, 1513, 1576, and 1654 cm\(^{-1}\) 17. The successful acquisition and assignment of these enhanced signals demonstrate that the DNA-AuNP crystals provide surface enhancement. These results validate the appropriateness of the prepared crystals as a functional SERS substrate for the detection of probe molecules.
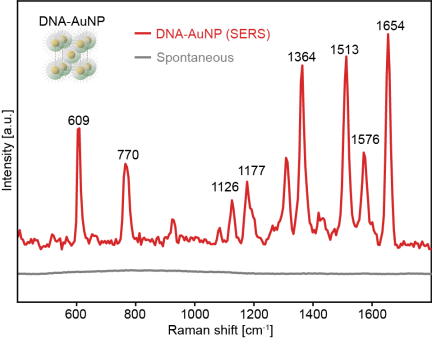
Fig. 2. SERS spectrum of 1 μM R6G adsorbed on a DNA-AuNP crystal (red) and spontaneous Raman spectrum of 1 μM R6G bulk solution (gray).
3.2. Multivariate Analysis of Intra-Particle Signals
Having confirmed the SERS activity of the DNA-AuNP crystals, we next investigated the spatial distribution of these signals within the individual particles to understand the internal hotspot characteristics. The MCR-ALS analysis identified three primary spectral components (Fig. 3(a)). Components 1 and 2 correspond to the fingerprint signatures of adsorbed R6G, featuring characteristic bands at 609, 770, and 1364 cm\(^{-1}\). Component 1 exhibits a higher relative intensity of the aromatic C–C stretching mode at 1364 cm\(^{-1}\) compared to component 2, whereas component 2 shows more prominent bands at 609 cm\(^{-1}\) (the C–C–C ring in-plane bend) and 770 cm\(^{-1}\) (the C–H out-of-plane bend). Notably, these two modes in component 2 correspond to vibrations oriented in the same direction, causing their intensities to fluctuate in synchronization. This simultaneous enhancement serves as a distinctive signature for a horizontal (flat-on) orientation. According to SERS surface selection rules, vibrational modes with a transition dipole moment perpendicular to the metal surface undergo preferential enhancement. These spectral differences suggest distinct adsorption geometries: a vertical (edge-on) or highly tilted orientation for component 1, and a horizontal (flat-on) orientation for component 2. The spatial distribution maps (Fig. 3(b)) reveal that the high-intensity regions of components 1 and 2 are spatially segregated, suggesting that the adsorption orientation is governed by local variations in facet geometry or surface potential.
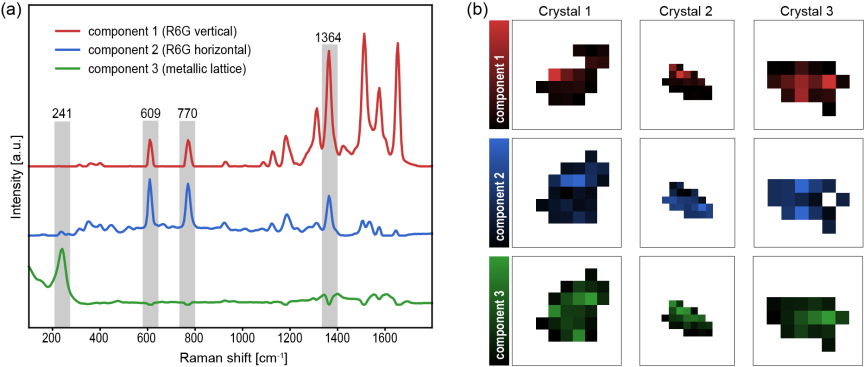
Fig. 3. (a) Pure component spectra extracted by MCR-ALS: component 1 (R6G vertical orientation), component 2 (R6G horizontal orientation), and component 3 (metallic lattice vibrations). (b) Spatial distribution maps of MCR scores (coefficients) for each component across three representative DNA-AuNP crystals. The intensities in the maps represent the relative contribution of each spectral component at each pixel.
Component 3 is characterized by a prominent low-frequency vibration at 241 cm\(^{-1}\), which is attributed to the intrinsic metallic lattice vibrations or metal–metal bonds of the DNA-AuNP assembly. Notably, in certain particles such as crystals 2 and 3, the distribution of component 3 spatially overlaps significantly with that of component 1. This spatial correlation suggests that the vertical orientation of R6G is preferentially induced at sites where the metallic lattice signal is dominant. This observation implies that the local environment favoring the reported SERS bands of probe molecules (component 1) is intrinsically linked to the structural characteristics reflected in the low-frequency metallic lattice vibrations (component 3).
3.3. Statistical Analysis of Inter-Particle Signals
To establish a robust framework for the quantitative evaluation of SERS probes, we analyzed the statistical distribution of the enhancement performance across the ensemble of 190 individual DNA-AuNPs. Unlike conventional methods that rely on single-peak intensities, we utilized the scores (coefficients) obtained from MCR-ALS to evaluate the inter-particle variability. This approach allows for a more holistic assessment of signal stability, encompassing both total enhancement and spectral shape consistency.
Figure 4(a) shows the scatter plot of the coefficients for component 1 (C\(_{1}\)) and component 2 (C\(_{2}\)), representing the vertical and horizontal adsorption geometries, respectively. The plot reveals a moderate positive correlation (\(r=0.6791\)), suggesting that while the overall enhancement is governed by the common plasmonic properties of the crystals, the two adsorption modes are subject to distinct stochastic processes. Notably, the coefficient of variation (CV) for C\(_{1}\) (2.264) is significantly higher than that for C\(_{2}\) (0.767). This difference indicates that the vertical orientation, which typically requires stronger field confinement in narrow gaps, is more sensitive to the structural heterogeneity of the hotspots compared to the more stable horizontal orientation.
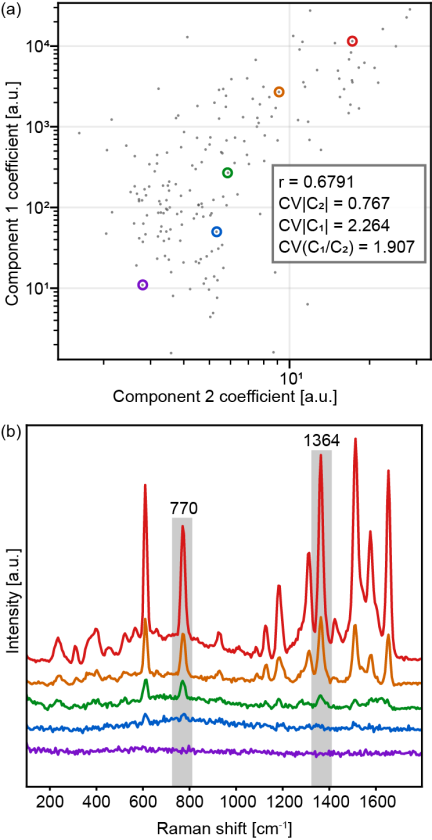
Fig. 4. (a) Scatter plot of the MCR-ALS coefficients for component 2 versus component 1. (b) Representative SERS spectra of individual DNA-AuNP crystals in (a).
The high variability in absolute coefficients reflects the inherent challenges in the reproducible synthesis of particle-like SERS substrates. However, the primary value of our platform lies in the ability to quantify these fluctuations accurately. As shown in the representative spectra (Fig. 4(b)), the transition from high-intensity particles (red) to low-intensity ones (purple) involves not only a decrease in signal-to-noise ratio but also subtle shifts in the relative contribution of each MCR component. The CV of the ratio (\(\textrm{C}_{1}/\textrm{C}_{2}\)) was calculated to be 1.907, providing a quantitative measure of “spectral shape consistency” across the population.
These results demonstrate that our evaluation platform can successfully decompose complex SERS signal fluctuations into interpretable physical parameters. While the current DNA-AuNP crystals exhibit significant heterogeneity, this methodology provides a necessary “performance report” for any candidate SERS probe. By quantifying the limits of both intensity and spectral stability, this framework paves the way for the rational optimization of SERS sensors for reliable intracellular applications.
4. Conclusion
We have established a robust high-throughput platform for the quantitative evaluation of particle-type SERS probes, using DNA-AuNP crystals as a proof-of-principle model. By performing hyperspectral imaging and statistical analysis on a large ensemble of 190 individual particles, we demonstrated that complex signal fluctuations can be decomposed into interpretable physical parameters using MCR-ALS. This entire workflow, including measurement and data analysis, is completed in approximately 1 min per particle, ensuring high-throughput performance.
Our findings reveal a significant difference in the stability of different molecular adsorption geometries. The vertical orientation (C\(_{1}\)), which is highly sensitive to the local electromagnetic field confinement in nanoscale junctions, exhibited a high variability (\(\textrm{CV}=2.264\)), whereas the more stable horizontal orientation (C\(_{2}\)) showed a much lower variability (\(\textrm{CV}=0.767\)). Furthermore, the CV of the ratio between these components (\(\textrm{C}_{1}/\textrm{C}_{2}=1.907\)) provides a quantitative benchmark for spectral shape consistency, distinguishing it from absolute intensity fluctuations.
This platform is highly versatile and applicable to various SERS-active particle systems. MCR-ALS is generally effective for different particles. However, the number of components must be estimated carefully. This is necessary because noise factors such as fluorescence may appear as distinct spectral components. While R6G was used as a benchmark, other probe molecules are also suitable. In such cases, the results must be discussed based on the orientation and electronic states derived from the specific molecular structure. To ensure statistical robustness, the MCR-ALS model requires a large dataset of at least 100 spectra. Currently, collecting this volume of data requires several hours. Increasing the sample density on the substrate can shorten this duration and further improve the operational throughput.
The primary significance of this study lies not in the pursuit of perfect substrate reproducibility, but in the implementation of a methodology that can quantitatively define the performance limits of SERS enhancers. By integrating classical SERS surface selection rules with multivariate statistical metrics, we have moved beyond qualitative observations toward a standardized “performance report” for SERS-active substrates.
This framework establishes a necessary foundation for the rational design and quality control of next-generation SERS probes. Such quantitative assessment is essential for ensuring the reliability of SERS-based molecular sensing in complex biological environments, ultimately paving the way for robust intracellular applications.
- [1] G. van Meer, D. R. Voelker, and G. W. Feigenson, “Membrane lipids: Where they are and how they behave,” Nature Reviews Molecular Cell Biology, Vol.9, No.2, pp. 112-124, 2008. https://doi.org/10.1038/nrm2330
- [2] R. Zenobi, “Single-cell metabolomics: analytical and biological perspectives,” Science, Vol.342, No.6163, Article No.1243259, 2013. https://doi.org/10.1126/science.1243259
- [3] E. Lundberg and G. H. H. Borner, “Spatial proteomics: A powerful discovery tool for cell biology,” Nature Reviews Molecular Cell Biology, Vol.20, No.5, pp. 285-302, 2019. https://doi.org/10.1038/s41580-018-0094-y
- [4] L. D. Lavis and R. T. Raines, “Bright ideas for chemical biology,” ACS Chemical Biology, Vol.3, No.3, pp. 142-155, 2008. https://doi.org/10.1021/cb700248m
- [5] S. J. Sahl, S. W. Hell, and S. Jakobs, “Fluorescence nanoscopy in cell biology,” Nature Reviews Molecular Cell Biology, Vol.18, No.11, pp. 685-701, 2017. https://doi.org/10.1038/nrm.2017.71
- [6] E. A. Specht, E. Braselmann, and A. E. Palmer, “A critical and comparative review of fluorescent tools for live-cell imaging,” Annual Review of Physiology, Vol.79, pp. 93-117, 2017. https://doi.org/10.1146/annurev-physiol-022516-034055
- [7] A. F. Palonpon, M. Sodeoka, and K. Fujita, “Molecular imaging of live cells by Raman microscopy,” Current Opinion in Chemical Biology, Vol.17, No.4, pp. 708-715, 2013. https://doi.org/10.1016/j.cbpa.2013.05.021
- [8] R. R. Jones, D. C. Hooper, L. Zhang, D. Wolverson, and V. K. Valev, “Raman techniques: Fundamentals and frontiers,” Nanoscale Research Letters, Vol.14, No.1, Article No.231, 2019. https://doi.org/10.1186/s11671-019-3039-2
- [9] J. Langer et al., “Present and future of surface-enhanced Raman scattering,” ACS Nano, Vol.14, No.1, pp. 28-117, 2020. https://doi.org/10.1021/acsnano.9b04224
- [10] K. V. Serebrennikova, N. S. Komova, A. V. Zherdev, and B. B. Dzantiev, “SERS sensors with bio-derived substrates under the way to agricultural monitoring of pesticide residues,” Biosensors (Basel), Vol.14, No.12, Article No.573, 2024. https://doi.org/10.3390/bios14120573
- [11] J. Ando, K. Fujita, N. I. Smith, and S. Kawata, “Dynamic SERS imaging of cellular transport pathways with endocytosed gold nanoparticles,” Nano Letters, Vol.11, No.12, pp. 5344-5348, 2011. https://doi.org/10.1021/nl202877r
- [12] J. Taylor, A. Huefner, L. Li, J. Wingfield, and S. Mahajan, “Nanoparticles and intracellular applications of surface-enhanced Raman spectroscopy,” Analyst, Vol.141, No.17, pp. 5037-5055, 2016. https://doi.org/10.1039/C6AN01003B
- [13] K. Koike, K. Bando, J. Ando, H. Yamakoshi, N. Terayama, K. Dodo, N. I. Smith, M. Sodeoka, and K. Fujita, “Quantitative drug dynamics visualized by alkyne-tagged plasmonic-enhanced Raman microscopy,” ACS Nano, Vol.14, No.11, pp. 15032-15041, 2020. https://doi.org/10.1021/acsnano.0c05010
- [14] H. Sumi, N. Ohta, H. Sekiguchi, S. Harada, T. Ujihara, K. Tsukamoto, and M. Tagawa, “Designing a high-crystallinity nano-gapped particle superlattice via DNA-guided colloidal crystallization and dehydration,” Crystal Growth and Design, Vol.22, No.6, pp. 3708-3718, 2022. https://doi.org/10.1021/acs.cgd.2c00075
- [15] N. Tottori, M. Tagawa, A. Takao, L. Zhang, M. Yokomori, S. Sakuma, and Y. Yamanishi, “Thermally regulated droplet microfluidics enables uniform, size-controllable DNA-nanoparticle superlattices,” Small, Vol.22, No.54, Article No.e74787, 2026. https://doi.org/10.1002/smll.74787
- [16] T. Ikeuchi, S. Kozawa, H. Niinomi, X. Li, S. Ogawa, M. Kuwahara, T. Oshikiri, K. Hiramatsu, and M. Tagawa, “DNA-programmed core–shell nanoparticle superlattice crystals with nanogaps for SERS sensing,” ACS Applied Optical Materials, Vol.4, No.7, pp. 2028-2039, 2026. https://doi.org/10.1021/acsaom.6c00173
- [17] P. Hildebrandt and M. Stockburger, “Surface-enhanced resonance Raman spectroscopy of Rhodamine 6G adsorbed on colloidal silver,” J. of Physical Chemistry, Vol.88, No.24, pp. 5935-5944, 1984. https://doi.org/10.1021/j150668a038
This article is published under a Creative Commons Attribution-NoDerivatives 4.0 Internationa License.